

Kameleon007
The SPDR Portfolio Long Term Corporate Bond ETF (NYSEARCA:SPLB) is designed to provide simple low-cost exposure to long-duration investment grade corporate bonds.
The SPLB suffered a large drawdown in 2022 as long-term treasury yields increased in response to soaring inflation and the Fed’s rate hikes. However, as long-term treasury yields appear to have peaked, the SPLB ETF may return to generating positive returns in 2023.
Fund Overview
The SPDR Portfolio Long Term Corporate Bond ETF provides low-cost exposure to long-duration corporate bonds. The fund has $595 million in assets and charges a low 0.04% gross expense ratio.
Strategy
The SPLB ETF tracks the Bloomberg U.S. Long Term Corporate Bond Index (“Index”). The index is designed to measure the performance of U.S. investment grade (“IG”) corporate bonds with maturity greater than 10 years. To qualify for the index, the corporate issue must be denominated in U.S. dollars, have fixed-rate coupons, and have more than $300 million of par amount outstanding.
Structured notes with embedded swaps or other special features, private placements, floating-rate securities, and Eurobonds are excluded. The Index is rebalanced monthly, on the last business day of the month.
Portfolio Holdings
SPLB’s holdings consist of over 2,800 positions with an average maturity of 23 years and an average yield of 5.2%. The option adjusted duration of the portfolio is 13.3 years (Figure 1).
Figure 1 – SPLB fund characteristic (ssga.com)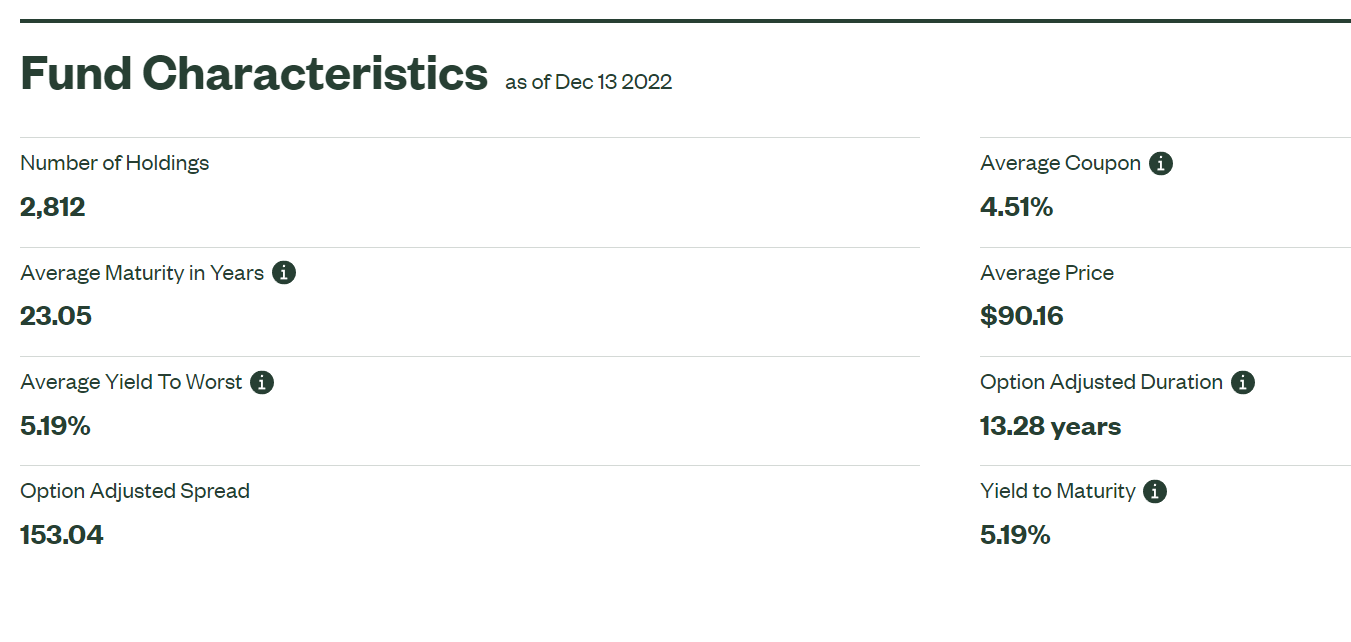
The SPLB’s portfolio is heavily weighted towards industrials, financials, and utilities, which account for 71%, 17%, and 12% of the portfolio, respectively (Figure 2).
Figure 2 – SPLB is heavily weighted towards only 3 sectors (ssga.com)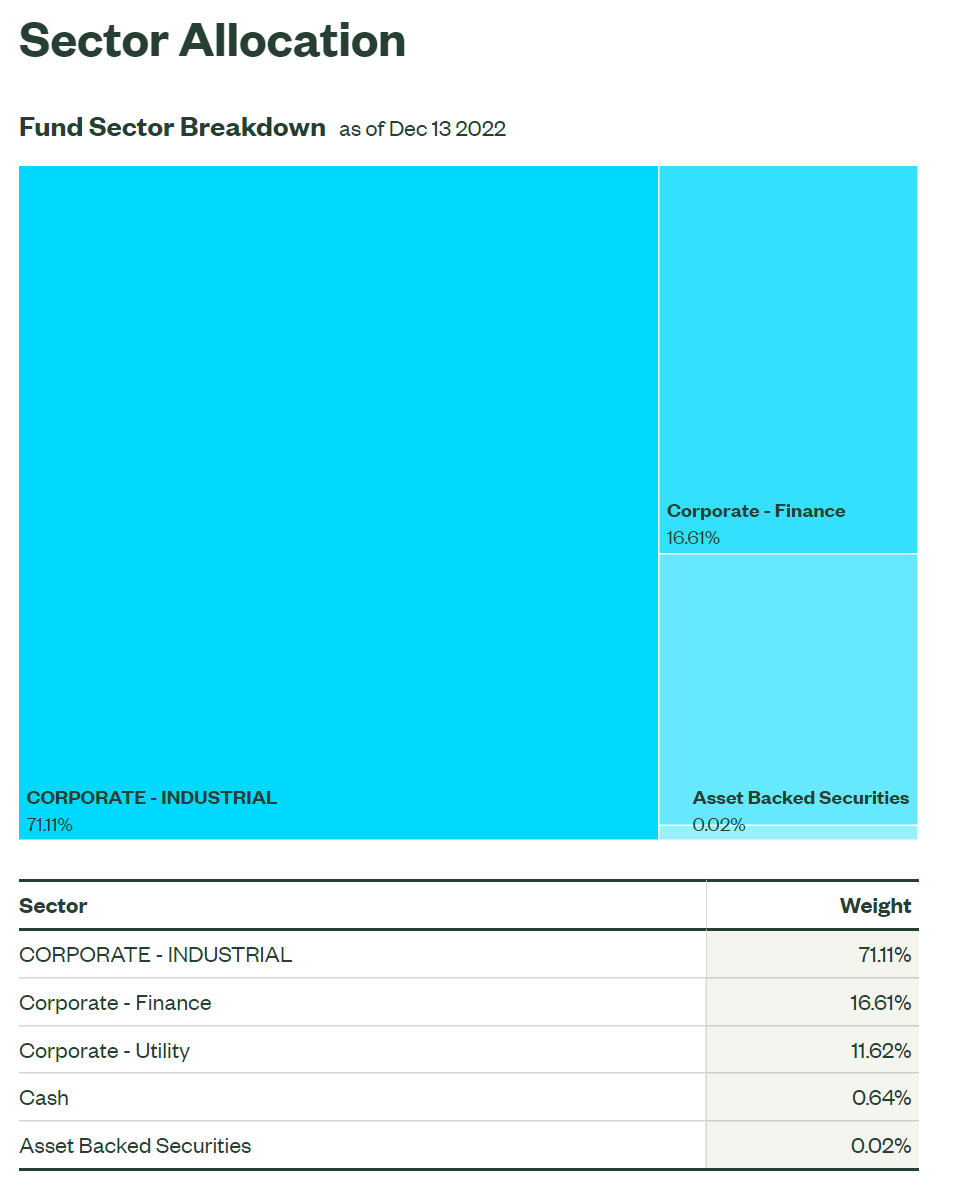
Although the fund’s holdings are all investment grade bonds, the portfolio is weighted towards the lower end of the credit spectrum, with almost 50% of the portfolio rated below Single-A.
Figure 3 – SPLB credit allocation (ssga.com)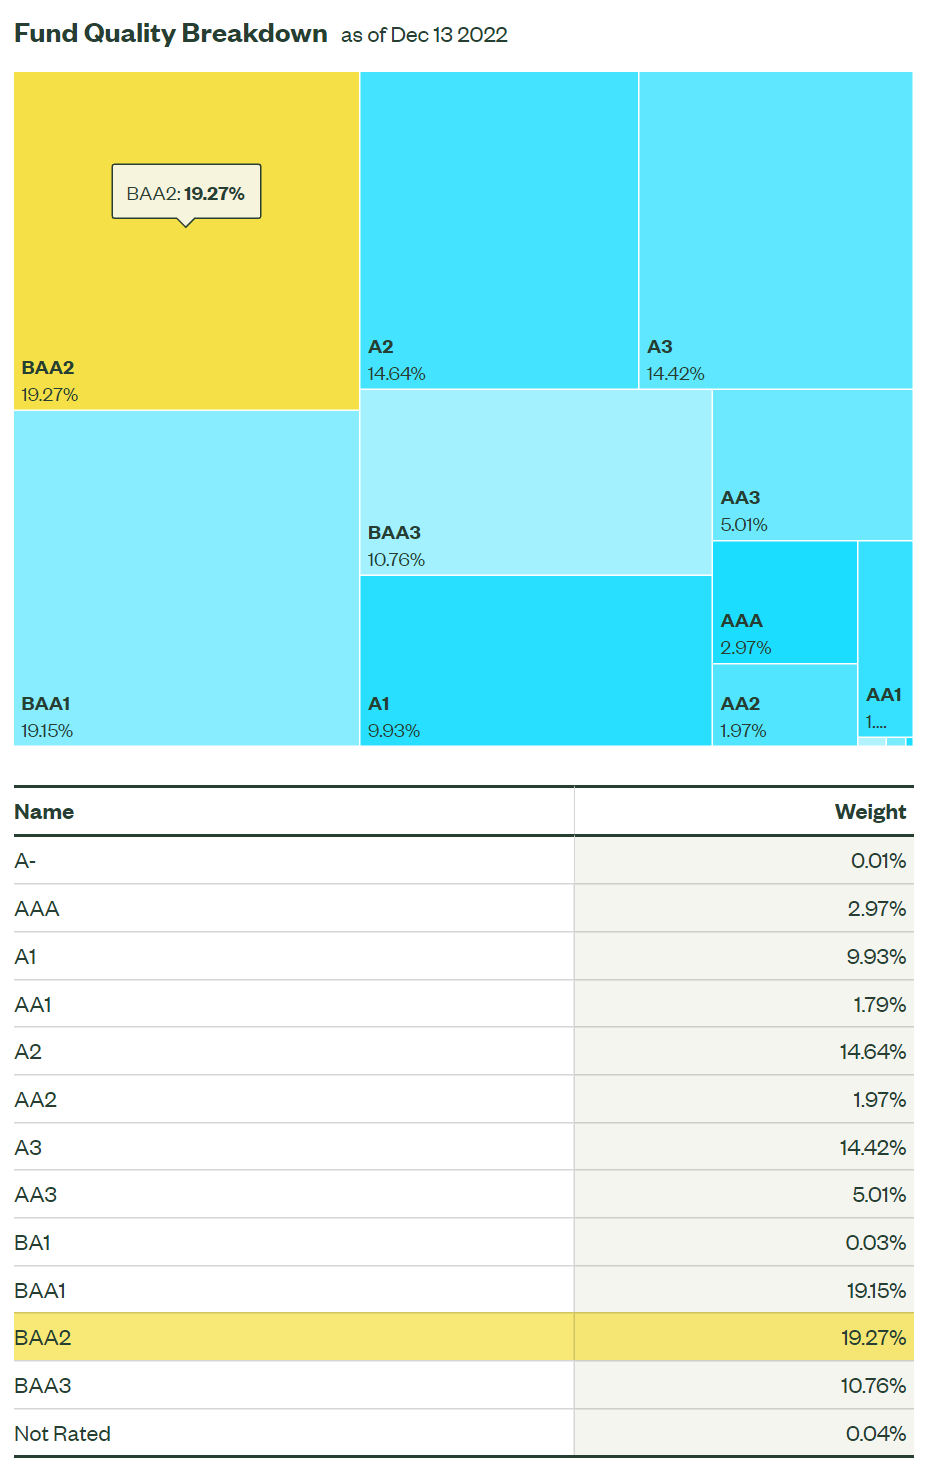
Returns
Due to SPLB’s long duration, 2022 has been annus horribilis for the fund, with SPLB returning -24.7% YTD to November 30, 2022. SPLB’s poor 2022 performance erased several years of positive returns, leaving average annual returns negative out to 5 years (Figure 4).
Figure 4 – SPLB returns (ssga.com)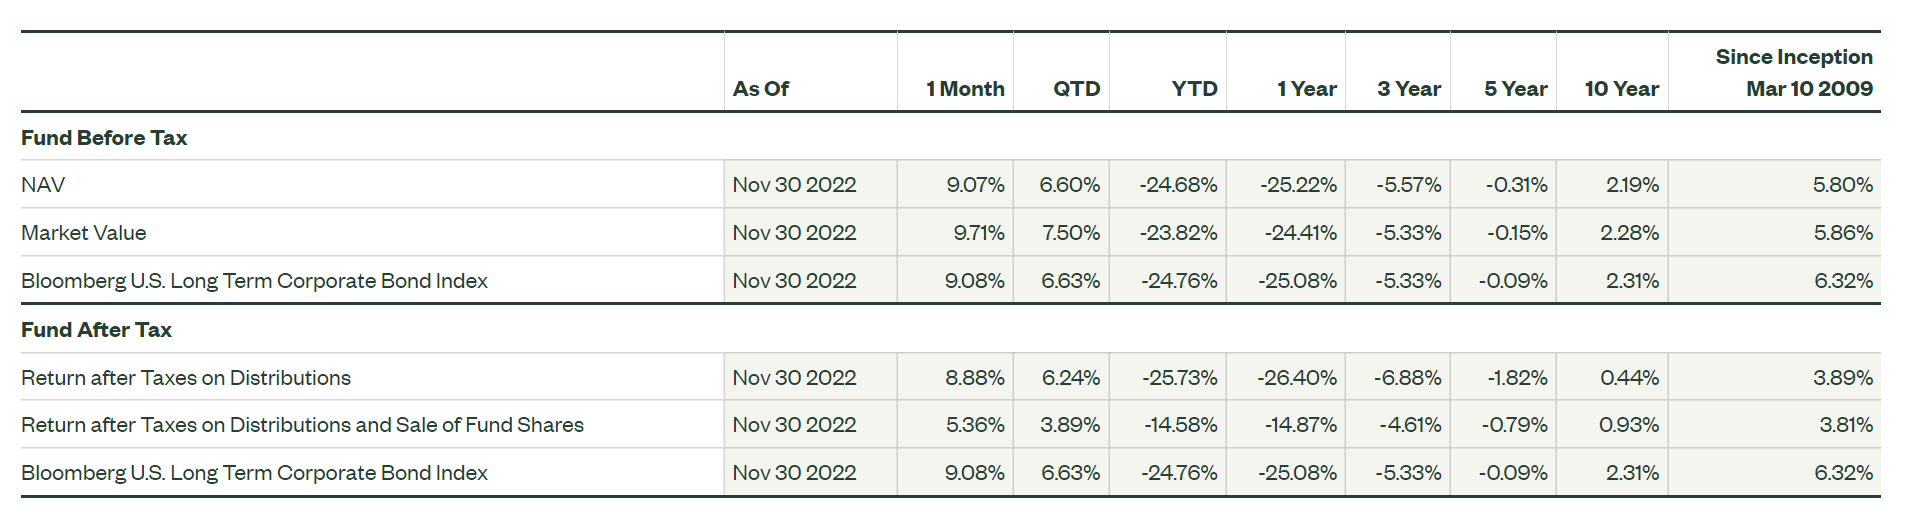
However, if we look at SPLB’s annual returns, we can see that if we ignore the especially poor 2022 performance, SPLB has generated a respectable 6.9% annual return from 2012 to 2021, with the prior largest declines being 2018 at -7.4%.
Figure 5 – SPLB losses tend to be caused by rising interest rates (Author created with returns from Morningstar and price chart from StockCharts.com)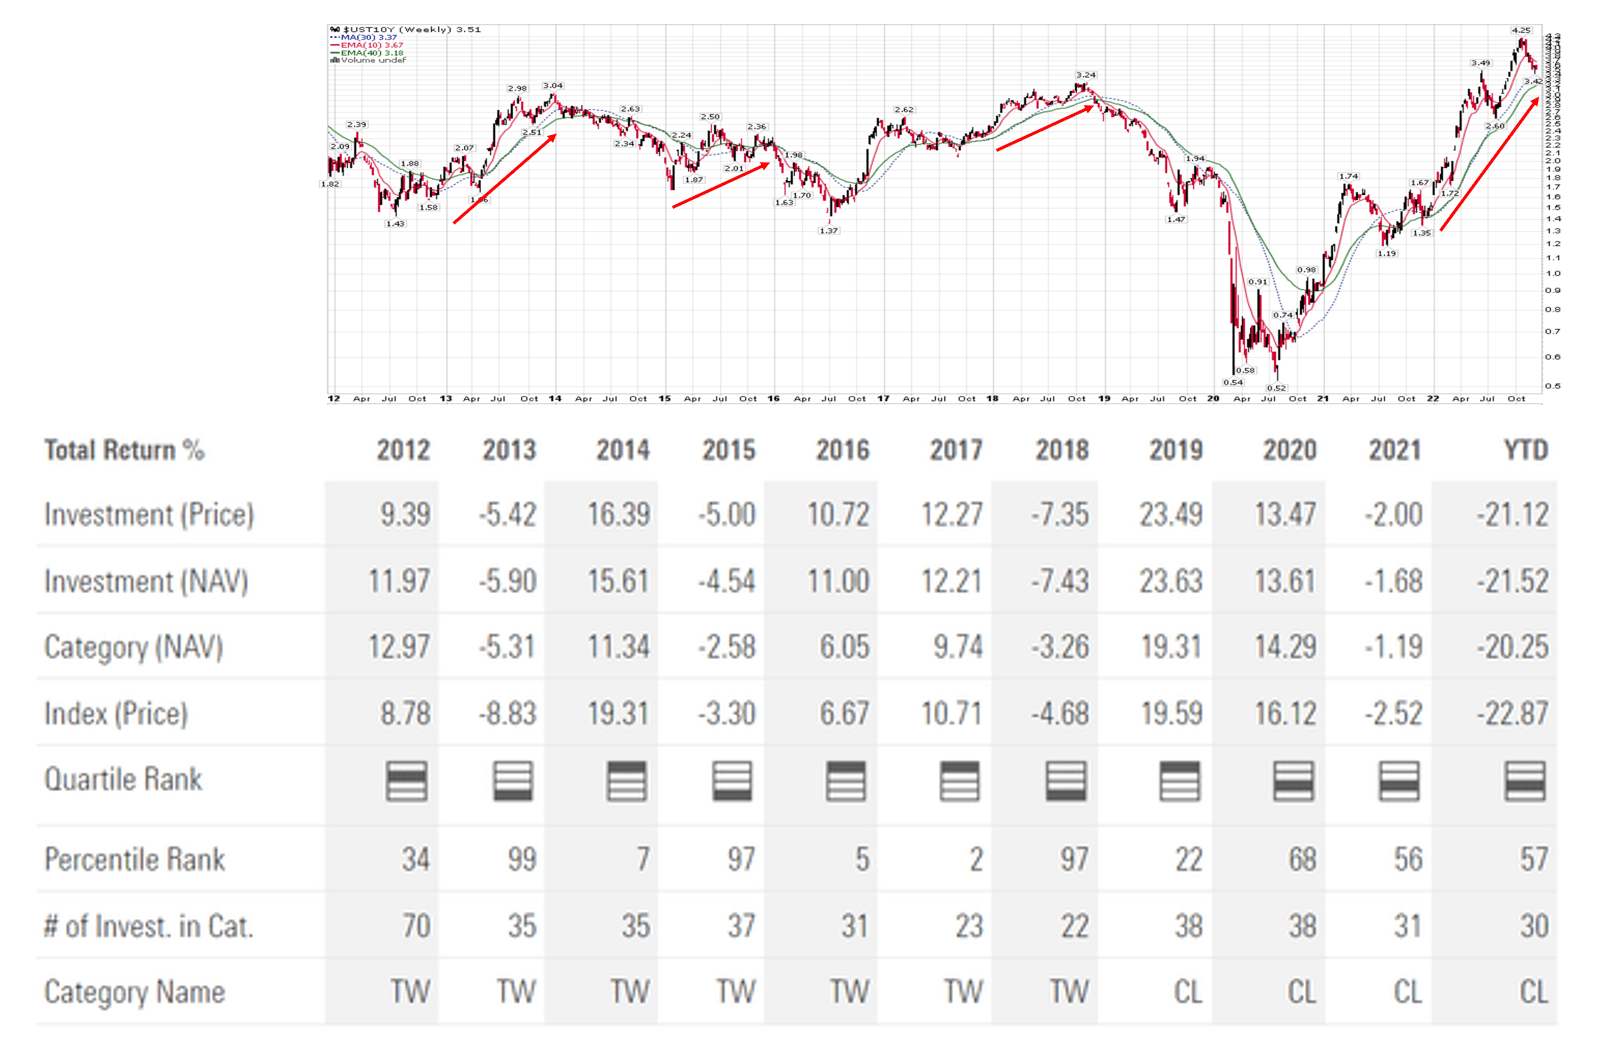
Historically, large declines in SPLB tend to correspond to rising long-term treasury yields, as shown in figure 5 above, due to the fund’s long-duration component.
Returns May Normalize With Peaking Yields
Looking forward, long-term treasury yields may have peaked, as investors start to price in a recession for 2023 and the Fed having to cut rates in the 2nd half of next year (Figure 6).
Figure 6 – 10 Yr treasury yields breaking from a bearish wedge (Author created with price chart from StockCharts.com)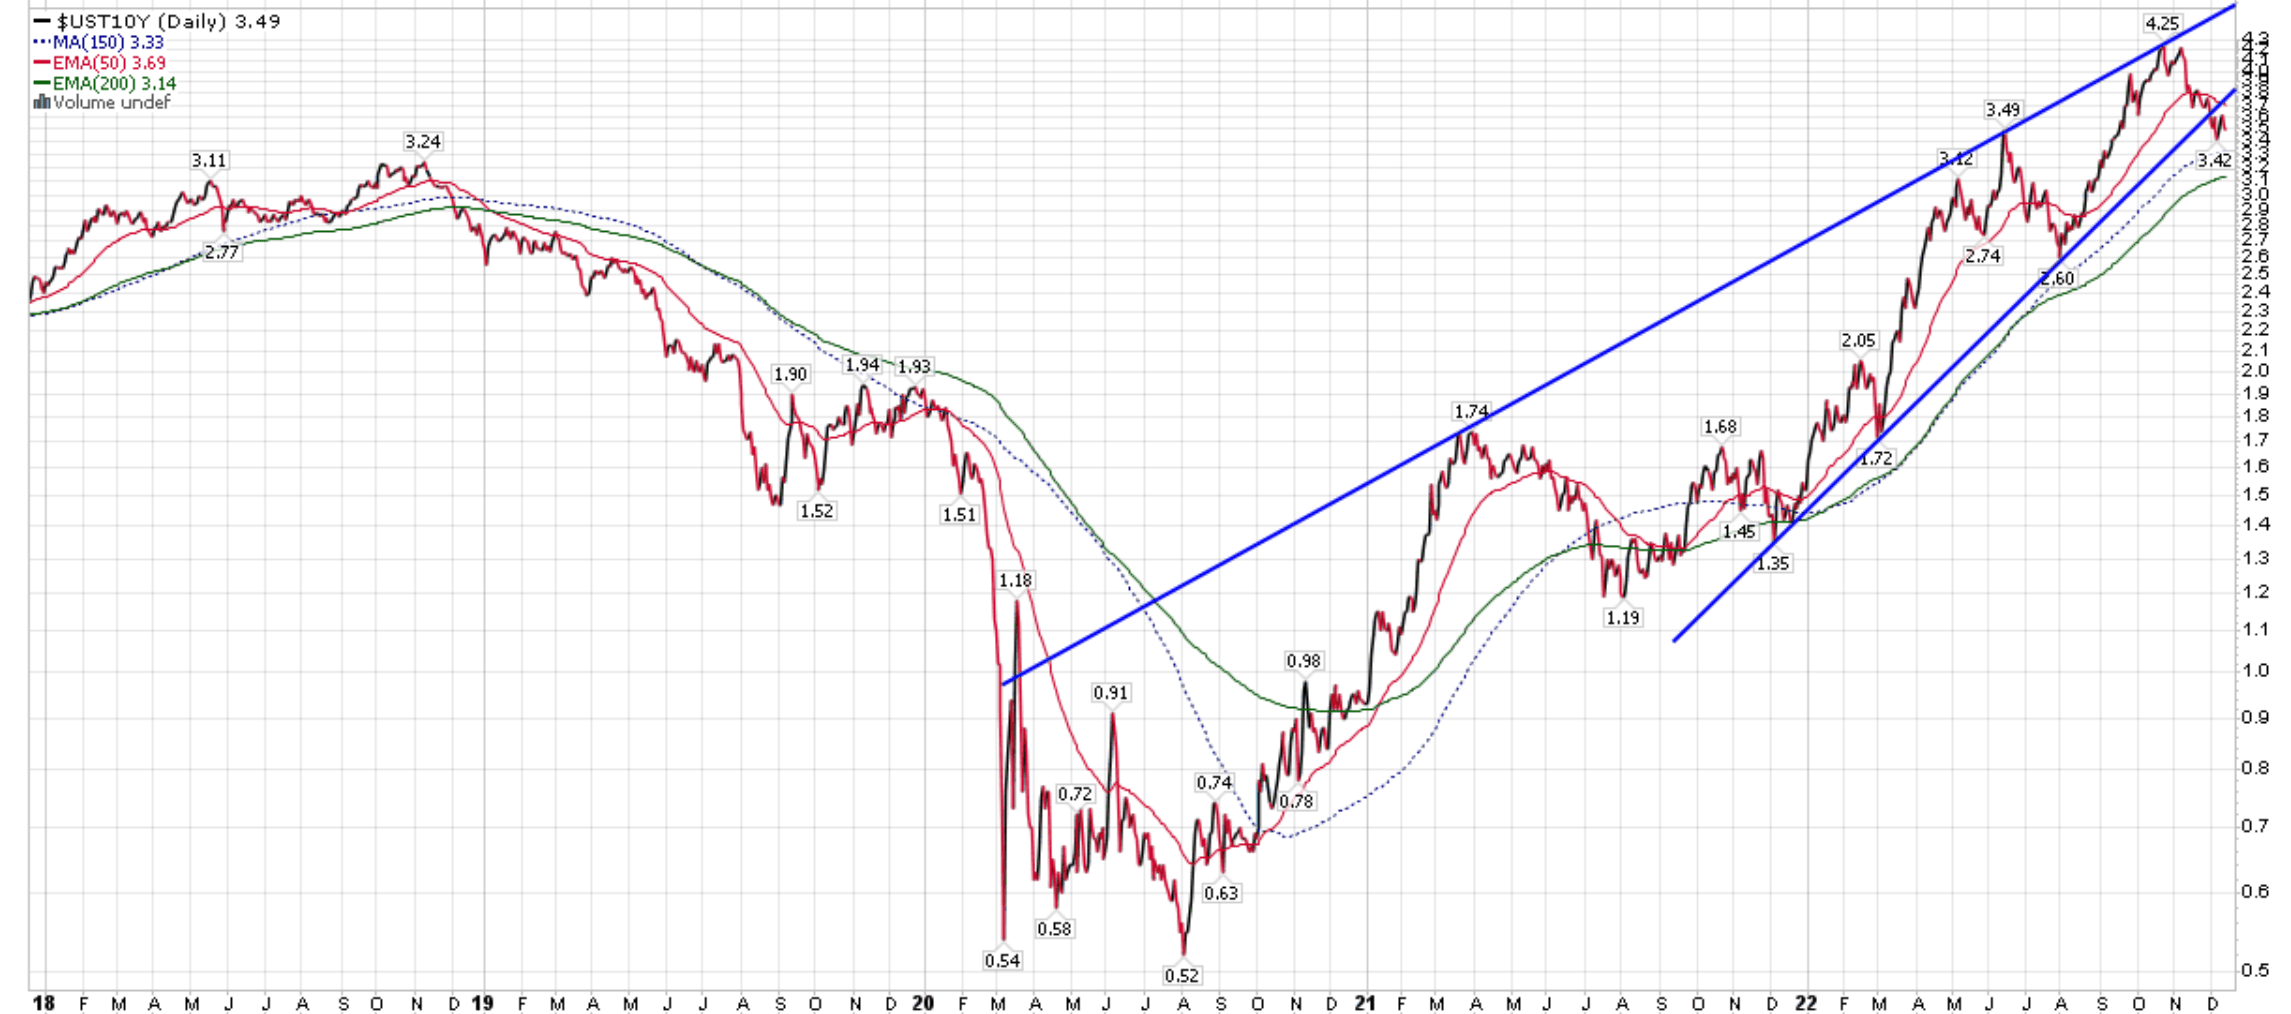
The implication for SPLB is that if long-term yields have normalized, then SPLB may return to generating positive returns. Since long-term treasury yields peaked in late October, 10Yr treasury yields have declined approximately 75 bps to 3.5% and the SPLB ETF returned a strong 9.1% in November.
Distribution & Yield
The SPLB ETF pays a trailing 12-month distribution yield of 4.2%. SPLB’s distribution is paid monthly (Figure 7).
Figure 7 – SPLB distribution (Seeking Alpha)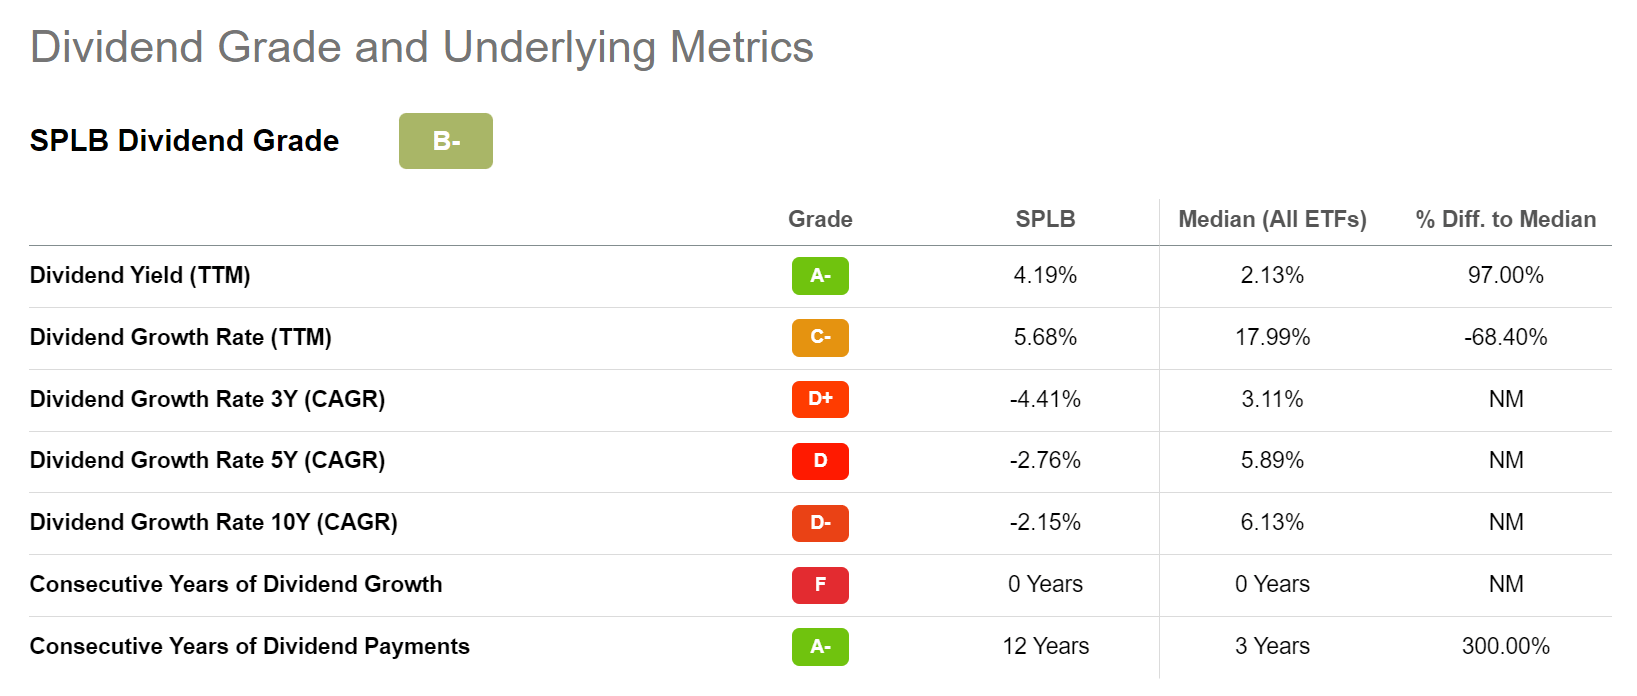
Risk
The biggest risk to holding SPLB is the severity of the Fed-induced economic slowdown. While long-term treasury yields may have peaked, there is still potential downside if the economy worsens and credit spreads widen.
Historically, recessions are marked with significant widening of credit spreads, as shown by ICE BofA Single-A US Corporate spreads in figure 8 below.
Figure 8 – Recessions are marked by widening credit spreads (St. Louis Fed)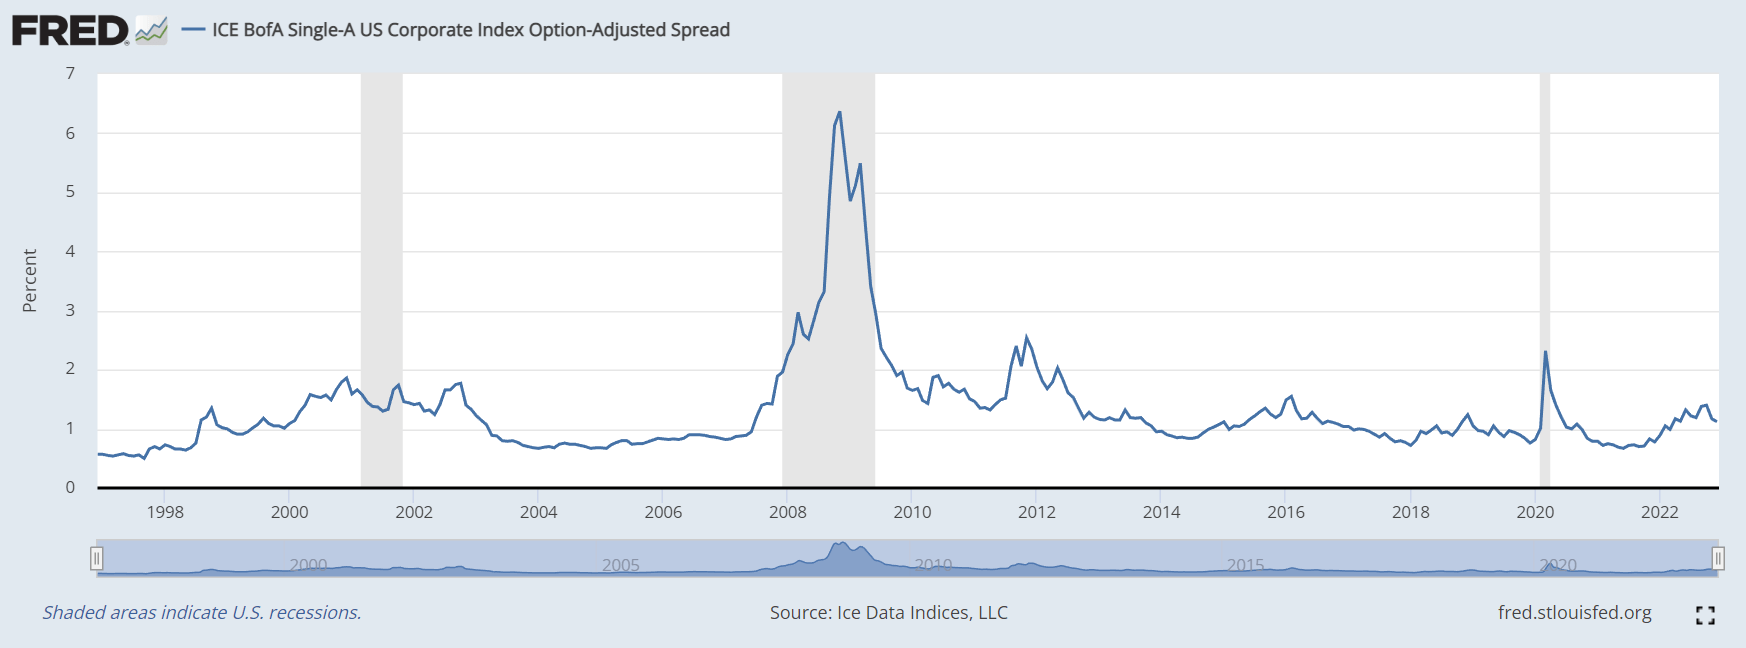
Single-A spreads widened to over 2% during the COVID recession and to over 6% during the Great Financial Crisis. Currently, they are trading at 1.1%.
However, if the coming recession is relatively mild and long-term treasury yields decline in anticipation of Fed rate cuts, then the SPLB ETF may be able to generate positive returns as duration works in the fund’s favor, counteracting the potential declines from widening spreads.
Conclusion
The SPDR Portfolio Long Term Corporate Bond ETF provides low-cost exposure to long-duration investment grade corporate bonds. SPLB had a terrible 2022 as long-term treasury yields increased dramatically in response to soaring inflation and the Fed’s rate hikes. However, as long-term treasury yields appear to have peaked in anticipation of the Fed cutting rates due to a coming economic slowdown, the SPLB ETF may return to generating positive returns in 2023 as duration balances widening spreads.
Be the first to comment