

insta_photos
(This article was co-produced with Hoya Capital Real Estate.)
As a recent retiree, I find myself spending a fair amount of time pondering how best to allocate, locate, and preserve the assets I managed to acquire during my working career.
In my personal portfolio, I currently hold four dividend-focused ETFs. At the same time, I am always looking at other options, to evaluate these against what I currently hold. From time to time, this research has led to making adjustments in my holdings.
As one example, early in my career as ETF Monkey, I held a position in iShares Core High Dividend ETF (HDV). Initially, I was attracted by the high dividend yield that HDV offered. However, as time went on, and I became more familiar with tools that allowed me to compare HDV’s performance against other options over long stretches of time, I eventually replaced HDV with other options.
In the course of my work, SPDR S&P Dividend ETF (NYSEARCA:SDY) has appeared from time to time on my radar. However, to this point, I had never taken the time to dive in for a detailed look at this offering. With this article, I will do so.
SPDR S&P Dividend ETF – Digging In
With an inception date of 11/8/2005, SDY ranks among the top ETFs in terms of longevity. Its AUM is $21.08 billion. In terms of expenses, however, it is a little higher than several ETFs that could be considered competitors, with an expense ratio of .35% and a trading spread of .03%.
The fund seeks to provide investment results that, before fees and expenses, correspond generally to the total return performance of the S&P High Yield Dividend Aristocrats Index.
Digging into the summary prospectus, here is what we find about this index.
The Index is designed to measure the performance of the highest dividend yielding S&P Composite 1500 Index constituents that have followed a managed-dividends policy of consistently increasing dividends every year for at least 20 consecutive years. Stocks included in the Index have both capital growth and dividend income characteristics, as opposed to stocks that are pure yield, or pure capital oriented, and must meet minimum float-adjusted market capitalization and liquidity requirements.
When I first saw this description, it reminded me of Vanguard Dividend Appreciation ETF (VIG), an ETF I have reviewed several times and also hold in my personal portfolio. That ETF has a somewhat similar policy, requiring that constituents have consistently increasing dividends every year for at least 10 consecutive years.
Next, however, is where SDY varies from VIG. VIG is market-cap weighted, meaning that it holds each stock in approximately the same proportion as its weighting in the index.
In contrast, stocks within the index tracked by SDY are weighted by indicated yield (annualized gross dividend payment per share divided by price per share). The index is re-weighted quarterly after the closing of the last business day of January, April, July and October. Finally, index components are reviewed annually in January for continued inclusion in the Index.
To round out this section, let’s see how this plays out using a section from the Seeking Alpha page for SDY.
SDY: Sector Breakdown & Top 10 Holdings (Seeking Alpha)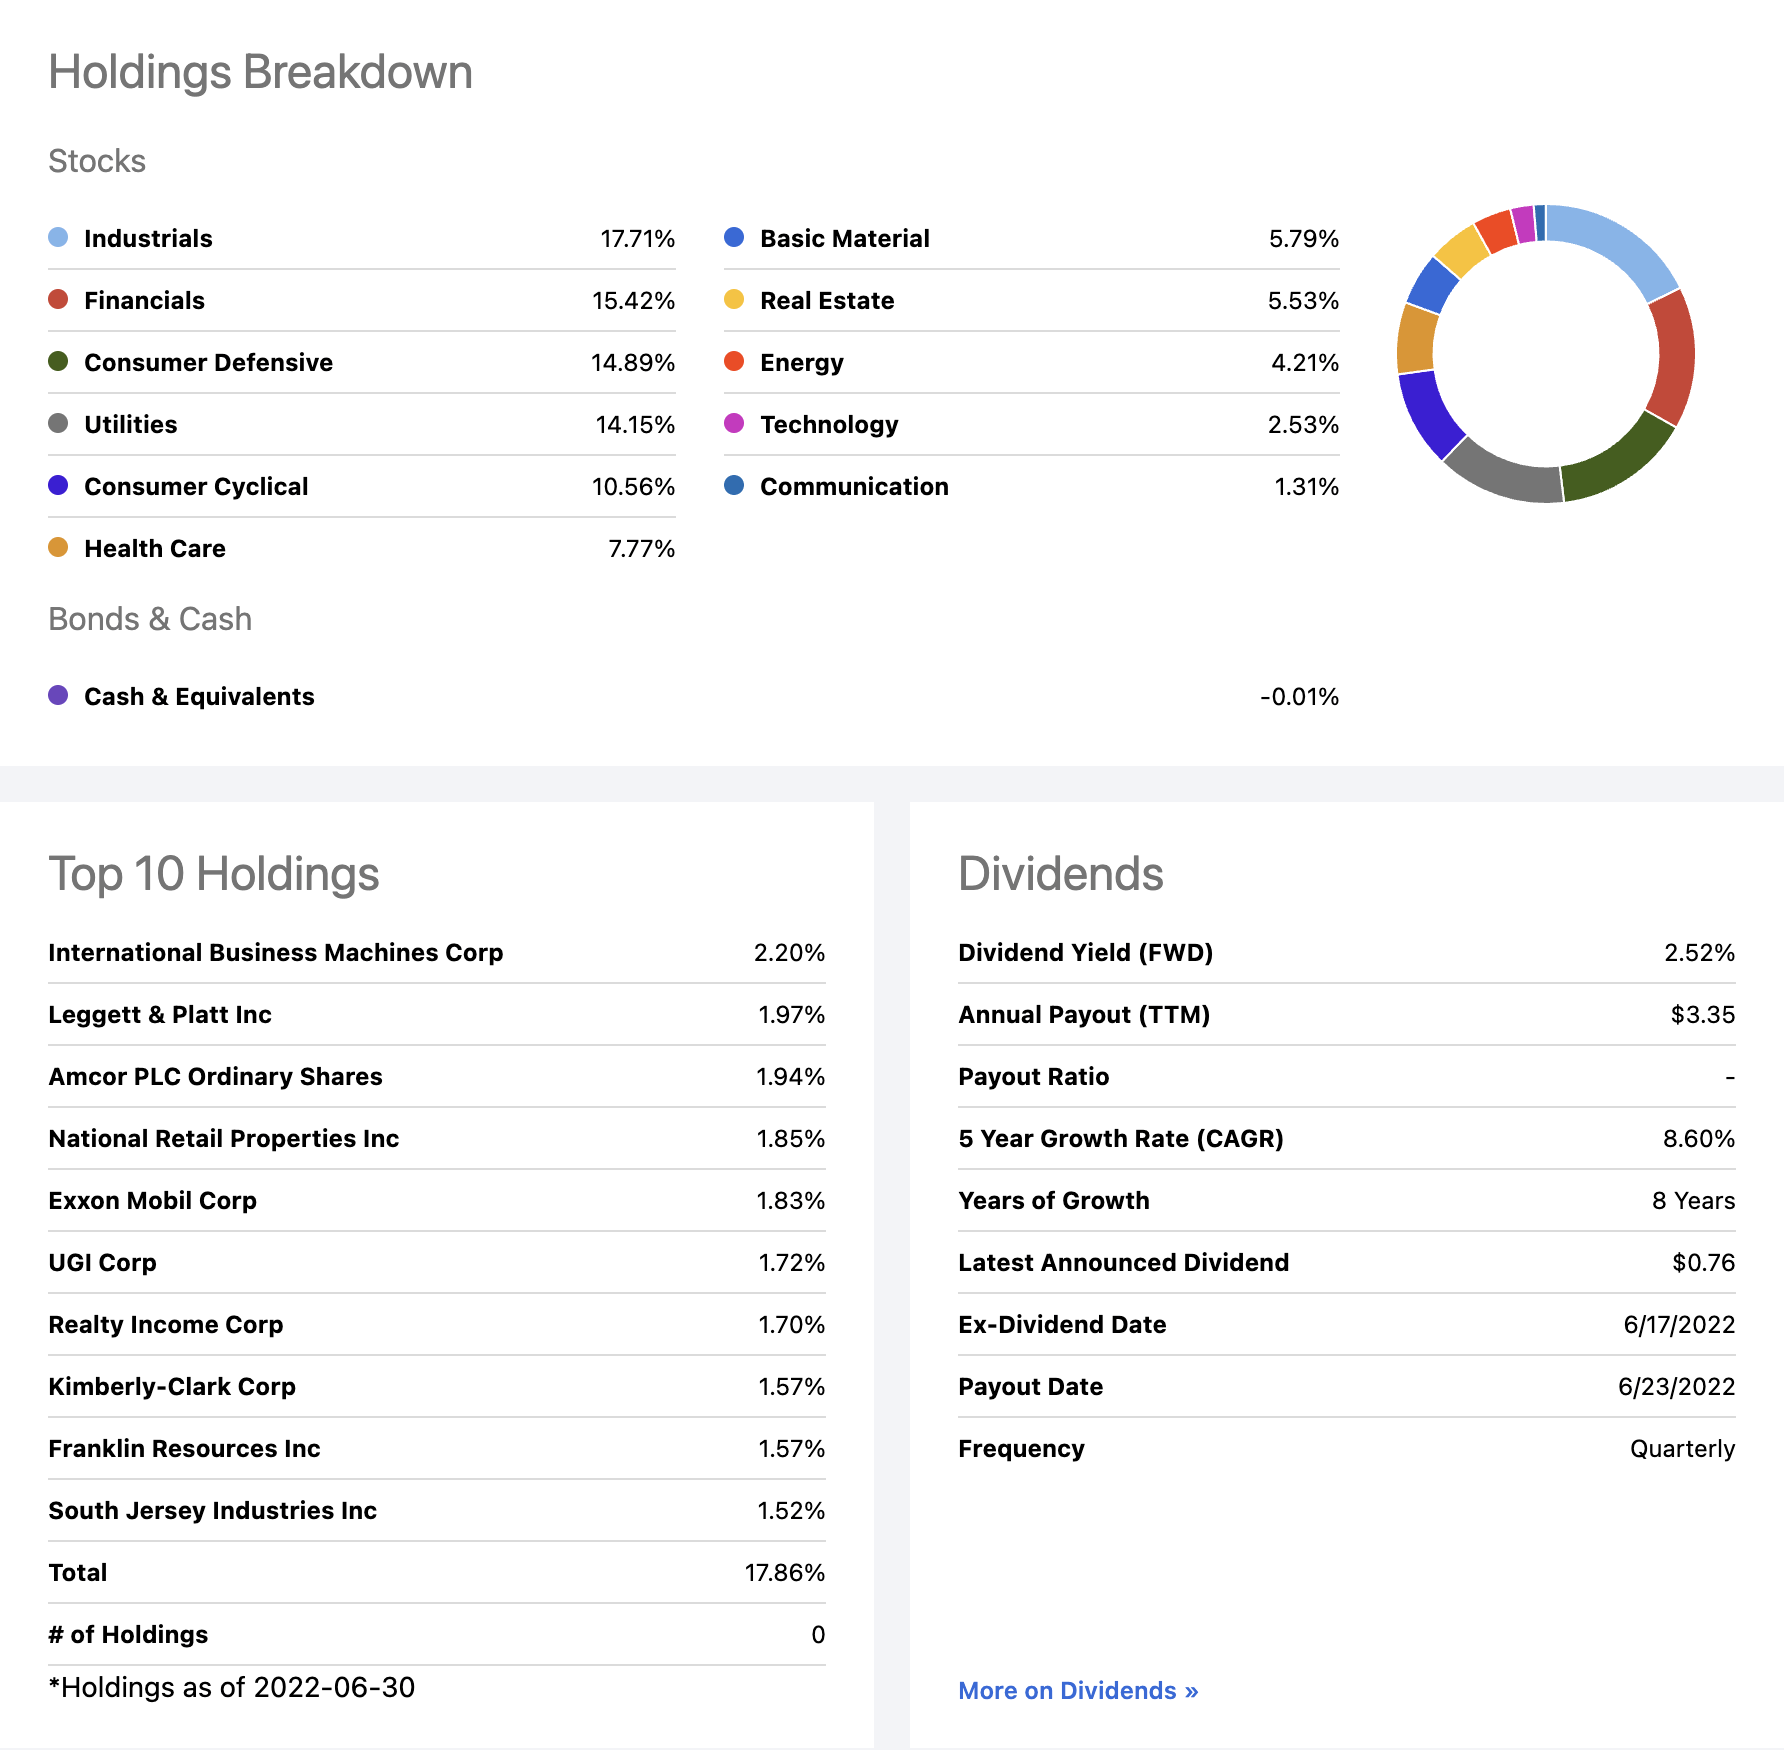
Looking at the sectors that hold the greatest weightings in SDY, as well as its Top 10 holdings, one can begin to see clearly how that requirement of a 20-year track record of increasing dividends plays out.
Simply put, it cuts two ways. On one hand, the quality of its 119 holdings is kept relatively high. On the other hand, it filters out quality dividend stocks that don’t yet have the requisite track record. Think stocks like Microsoft (MSFT) and UnitedHealth Group (UNH).
Additionally, think about the fact that the fund rebalances quarterly and weights by indicated dividend yield. In other words, the largest weightings are always in the highest-yielding stocks. As I have written in other articles, it is sometimes that case that stocks offering high yields find themselves in that spot for a reason, perhaps because their business is growing slowly if at all or, even worse, that they are in danger of experiencing financial difficulties.
It is here that the overall pedigree of the fund can serve to limit any potential damage. As can be seen in the graphic above, the fund is relatively evenly-weighted, with the Top 10 holdings only comprising 17.86% of the fund, as opposed to the 25-30% weighting the Top 10 holds in many a market-weighted fund.
Beauty Is In The Eye Of The Beholder
In my title, I borrowed a well-known phrase and teased that I would share the good, the bad, and the ugly of this ETF. For the heading of this section, I selected yet another well-known phrase.
You see, following my examination, it is my feeling that both sayings may well be applicable to SDY.
Here’s the deal. Let’s say you are an investor of retirement age, perhaps well into retirement age. In your particular circumstance, perhaps what is most important to you is a reliable, steady stream of moderately-high dividends, without taking on undue risk.
In that case, SDY might make for a nice inclusion in your portfolio. On one hand, I sure wish that the .35% expense ratio was a little lower. On the other hand, you might consider this sort of a “no muss, no fuss” ETF. In total, that 20-year filter keeps the quality of the holdings fairly high. Just buy it, hold it, and let SDY’s quarterly rebalancing process into the highest-yielding securities at the time keep that income flowing. Really, not much for you to do except run down to your favorite watering hole for a margarita!
So that’s the good. Here, though, is where we get in to the bad and ugly. You see, for most investors, with minimal fuss and effort, it appears to me that you can easily do better.
Schwab U.S. Dividend Equity ETF (SCHD) and iShares Core Dividend Growth ETF (DGRO) are two top-quality ETFs, both of which I have previously reviewed.
With that in mind, here’s a quick backtest I ran on Portfolio Visualizer.
This backtest runs from January 2015 to the present, constrained by the inception date of DGRO. All dividends are included and reinvested, and the portfolio is rebalanced quarterly, to match SDY’s schedule.
Portfolio 1 is comprised 100% of SDY. Portfolio 2 is 100% SCHD. Finally, Portfolio 3 is a 50/50 mix of SCHD and DGRO.
Have a look.
Backtest: SDY vs. SCHD/DGRO Combinations (PortfolioVisualizer.com)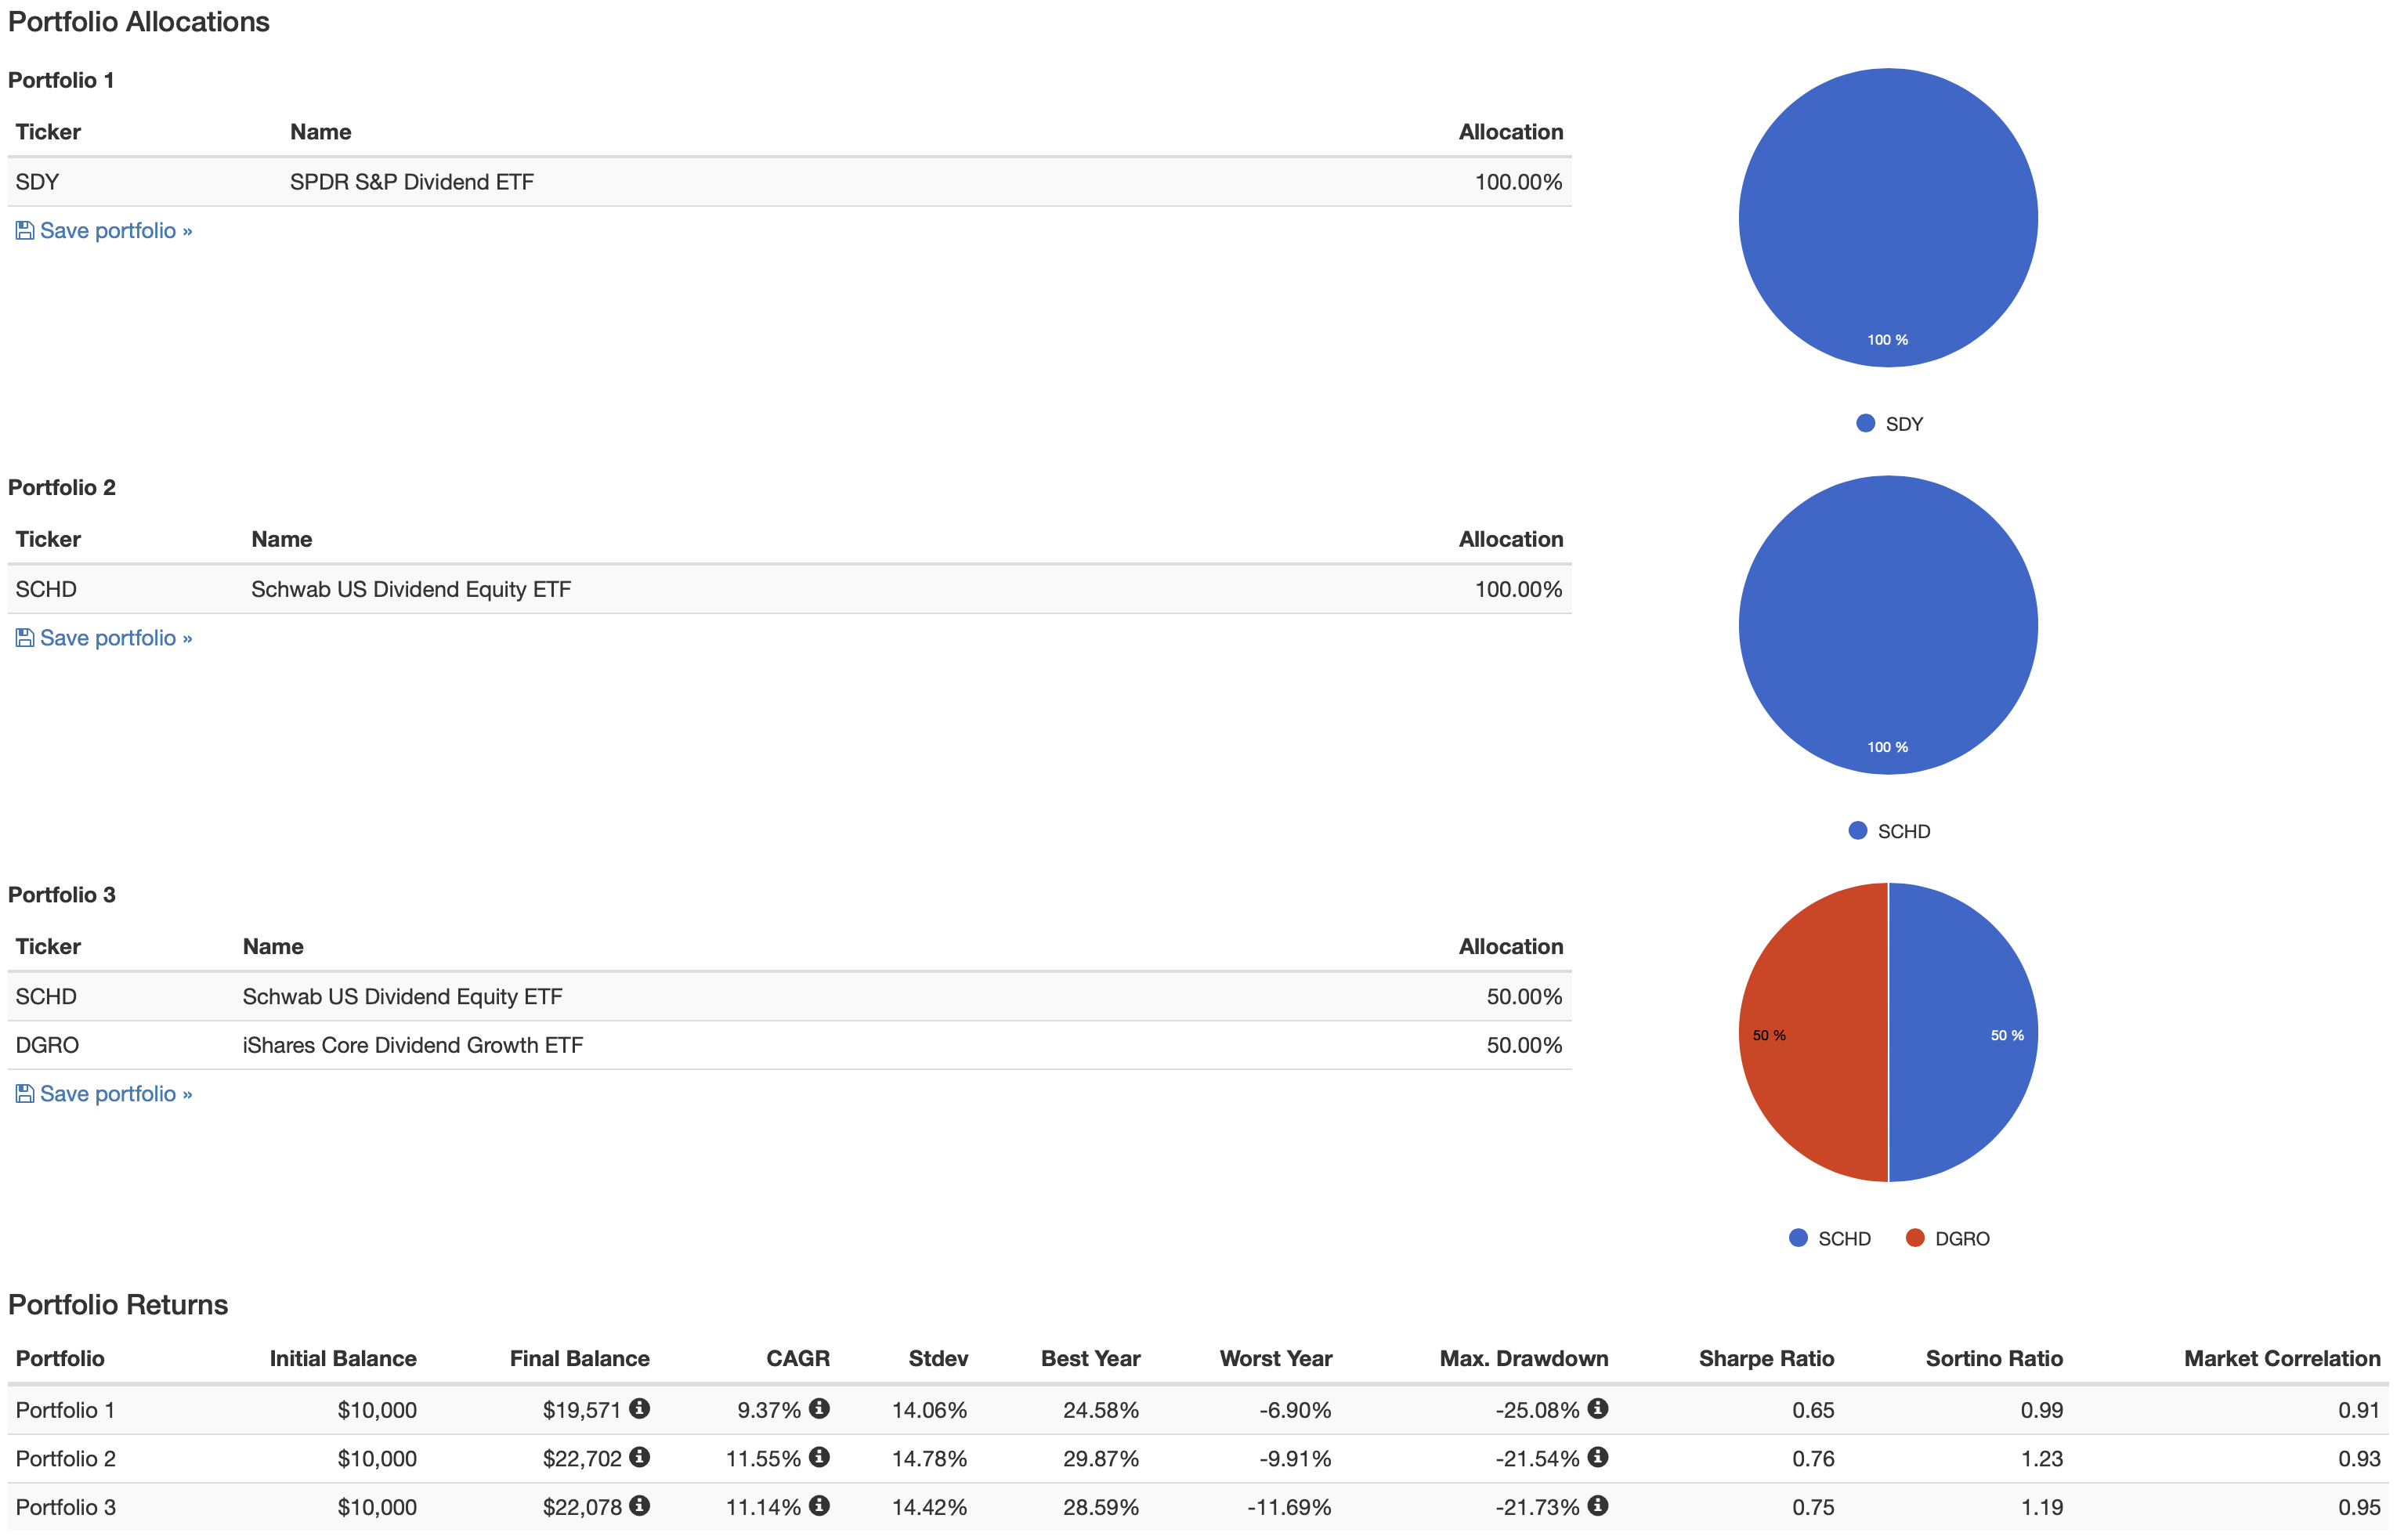
What likely jumps out at you, if you review the results carefully, is that it appears your best option would be to select SCHD and call it a day. On the other hand, if you wanted to hedge your bets, so to speak, by diversifying into two proven, quality, methodologies, you could split your allocation 50/50 between SCHD and DGRO and also obtain excellent results when it comes to superior total return.
But what if dividend income is important to you? Take a look at this next picture, from the same backtest.
Portfolio Income: SDY vs. SCHD/DGRO Combinations (PortfolioVisualizer.com)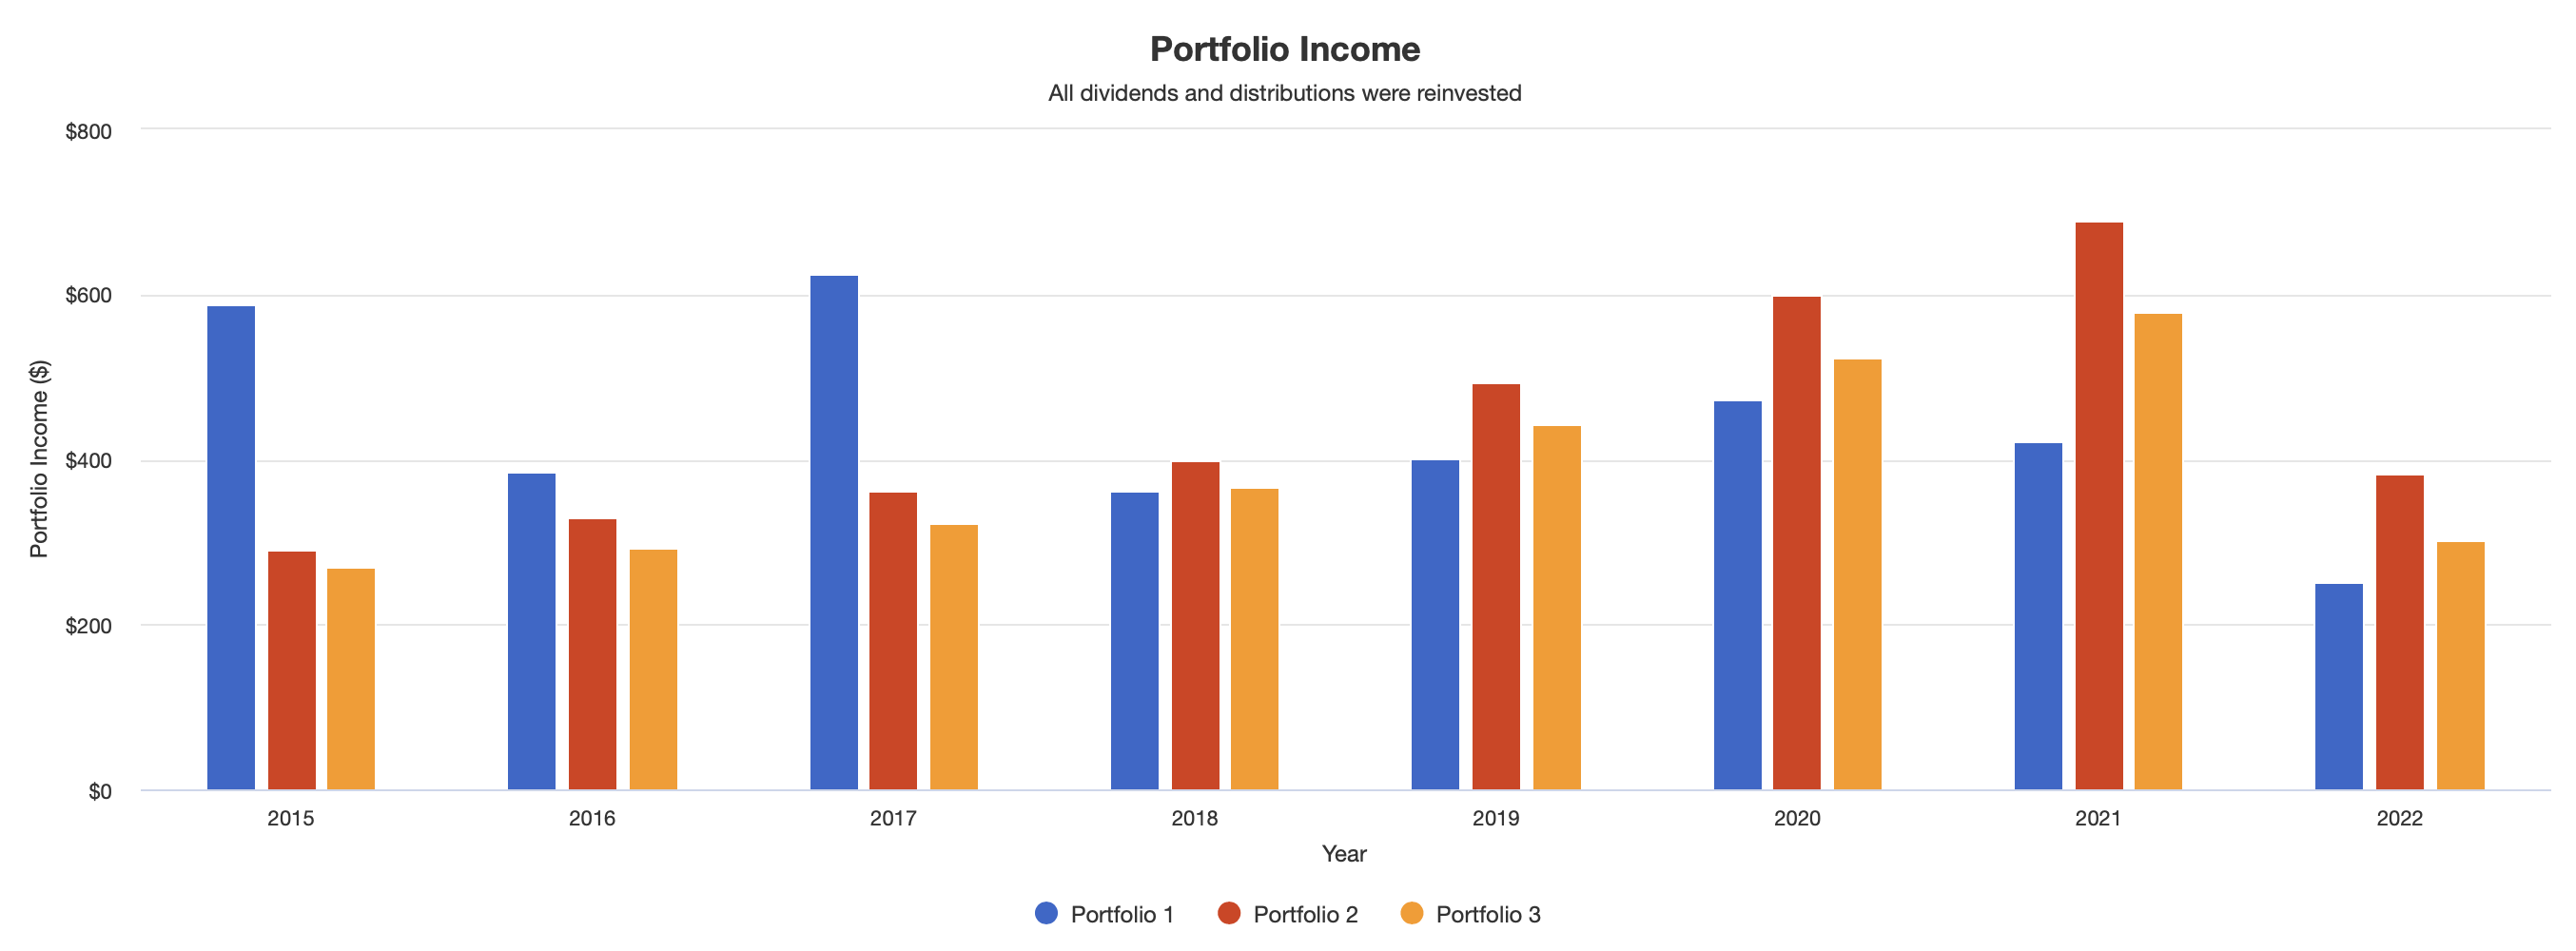
In short, since 2018, you would have generated an even greater amount of income from either SCHD alone, or my SCHD/DGRO combo, than from SDY.
Summary & Conclusion
From the above, I can only come to the conclusion that, for most investors, I believe you can do better than SDY. While, at first, that requirement of 20 consecutive years of rising dividends might seem to be a winning approach, comparing it against top-flight competition exposes the weaknesses of this methodology.
First, it works against the potential for growth, not only by eliminating too many high-quality stocks but also by regularly and deliberately rebalancing into the highest-yielding, but likely slowest-growing, stocks.
Second, you are having to overcome the headwind of that .35% expense ratio. As a comparison, SCHD sports an expense ratio of .06% and DGRO comes in at .08%. That’s a full quarter-percent in your pocket, even assuming all else being equal.
I hope you have found this article interesting, and helpful. Thanks for honoring me by taking the time to read my work.
Until next time, I wish you successful investing.
Be the first to comment