

MicroStockHub
The investment thesis in short
As shares of S&P Global Inc. (NYSE:SPGI) shares have dropped significantly from last year’s all-time high (-34.1%), the stock valuation has become quite attractive now for long-term investors. And if you thought that things couldn’t get any better, this current dividend aristocrat will be crowned dividend king early next year. Especially after the IHS Markit merger, S&P Global is perfectly positioned to generate increasing cash flows and dividend checks.
In this article I will explain why I think that this company will continue its five-decade-long dividend increase streak, and why I rate this stock a buy.
Becoming a dividend king
According to the dividend aristocrat list of 2022, S&P Global has increased its dividend for 49 consecutive years at the time of writing. If management decides to increase the dividend once again, S&P Global will join the dividend kings, a group of companies that has raised the dividend for 50 or more consecutive years.
The company usually announces a dividend increase in January or February, which means that this will happen only two or three months after this article is published. But as we all know, the past is no guarantee for the future. There have been many dividend aristocrats during the past decades that had to suspend the dividend for different reasons.
So, will the dividend increase streak continue into the future? To answer that question, let’s first take a closer look at the business itself.
Diversification into more recurring revenue streams
The safety and growth of dividends are a result of the underlying business performance. For a dividend to grow consistently, it helps that a business has predictable and growing cash flows. S&P Global has taken steps to bolster the stability of future cash flows by lowering exposure to credit ratings. In the following I will briefly discuss S&P Global’s most important Ratings division, and how the company is diversifying its revenue streams.
The Ratings division is responsible for the majority of revenue. In FY2021, Ratings revenue was 49% of total revenue and 57% of total adjusted operating profit with an impressive 63.4% adjusted operating profit margin.
The high profitability is driven by multiple moats that protect the Ratings division. The credit ratings market basically operates in an oligopoly, as the three main players S&P Global, Moody’s Corporation (MCO) and Fitch Ratings account for over 90% of the market. Credit rating agencies have a wide moat due to their long track record, and their services are widely accepted among asset owners and managers. Because credit ratings from S&P Global are used across the world, investors are able to compare credit ratings of companies from different continents and countries. Also, credit ratings are important for debt issuers (such as municipalities, governments, and corporations) because the higher their rating, the lower borrowing costs will be.
Roughly a third of the revenue from Ratings is recognized as transactional. This includes the new issuance of corporate and government debt, structured debt instruments, and bank loan ratings. Other Ratings revenue is recognized as non-transactional, consisting of fees for surveillance of ratings, annual fees for customer pricing programs, and fees related to CRISIL. With interest rates on the rise, the Ratings division is getting impacted significantly, as in Q3 of FY2022, revenue decreased 33% YoY. Especially transactional revenue was impacted by lower debt issuance (56% decrease), while non-transactional revenue only decreased 6%. The main reason for the significant decrease in transactional revenue is that most central banks continue to hike interest rates to combat inflation, resulting in a decreasing demand for new debt offerings.
So on one hand, credit ratings give S&P Global a wide moat and high margins drive strong cash flows. On the other hand, the high exposure to credit ratings makes the company largely dependent on debt issuance volume. But, what distinguishes S&P Global from Moody’s Corporation, is that its businesses are more diversified and thus less sensitive to fluctuations in debt issuance volume. Especially after the merger with IHS Markit, S&P Global has become a more diversified company with a total of six divisions. The following figure shows the pro-forma revenue distribution based on FY2021 financial results.
Pro-forma revenue distribution FY2021 (Investor Call Completion of S&P Global and IHS Markit Merger)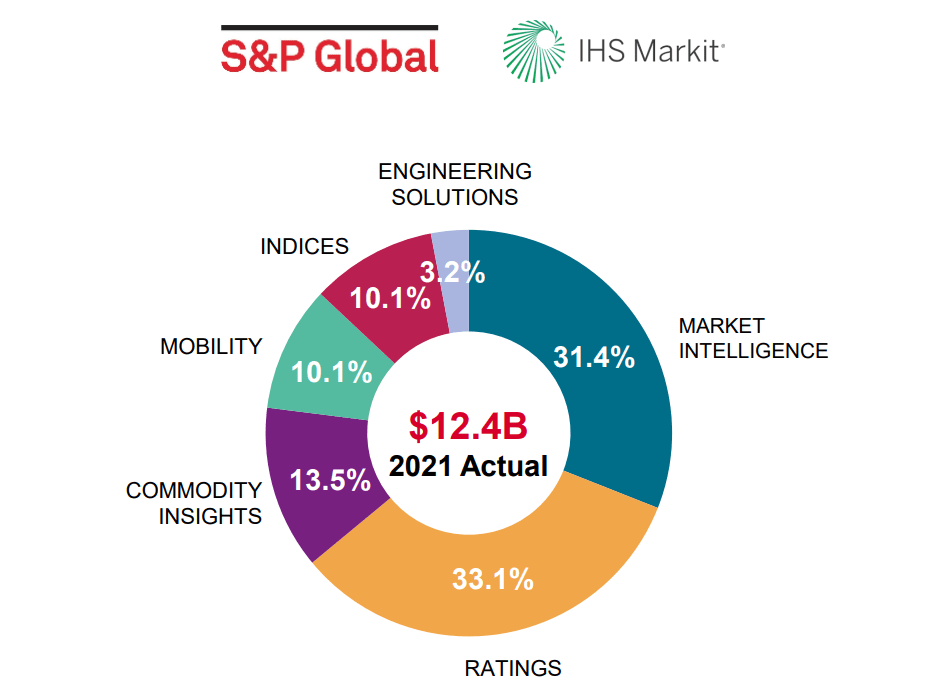
The Market Intelligence division of post-merger S&P Global generated nearly as much revenue as the Ratings division in FY2021. While margins have been typically lower compared to Ratings (33.9% versus 55.9% operating margin in Q3 FY2022), the advantage of Market Intelligence is that most revenue comes from subscriptions (85% in Q3 FY2022). Customers pay a fee to access data, analytic tools, valuation services, research, and credit ratings-related information through feeds and platforms such as Capital IQ, RatingsXpress, and RatingsDirect. Subscription revenue has the characteristic to be recurring, resulting in more stable and predictable cash flows. This is visible in the financial results, as pro-forma revenue from Market Intelligence increased by 4% YoY in Q3 FY2022.
Besides Market Intelligence, S&P Global operates through four other divisions that all have a high share of recurring revenue.
- Commodity Insights division provides benchmark prices, market reports, commentary and analytics for the commodity and energy markets (91% recurring revenue; pro-forma revenue grew 5% YoY in Q3 FY2022).
- The Mobility division provides data and insights on future vehicle sales and production to vehicle OEMs, dealerships, and automotive suppliers (78% recurring revenue; pro-forma revenue grew 8% YoY in Q3 FY2022).
- The Indices division consists of valuation and index benchmarks, such as the S&P 500 index (SPY) and Dow Jones index (DJI), that mainly derive revenue from asset-linked fees (83.5% recurring revenue; pro-forma revenue grew 3% YoY in Q3 FY2022).
- Finally, the relatively small Engineering Solutions division includes product design offerings that provide the knowledge and information to accelerate problem solving, optimize engineering projects, and effectively design products (93.7% recurring revenue; pro-forma revenue decrease 8% YoY in Q3 FY2022). To be honest, I do not really see the synergies here with other divisions of S&P Global.
Market Intelligence, Commodity Insights, Mobility, Indices, and Engineering Solutions combined can compensate for the temporarily poor results in the Ratings division. Despite the tough credit ratings market environment, total pro-forma revenue decreased 8% YoY in Q3 FY2022. For comparison, total revenue of Moody’s Corporation contracted by 16% in the same quarter.
Based on FY2021 numbers, 69.3% of S&P Global’s total revenue was recognized as recurring revenue before the merger. As of Q3 FY2022, 84% of total revenue was recurring. This explains the resilience of S&P Global’s overall business. The increase in predictability and reliability of cash flows reduces the impact of upside and downside scenarios in financial markets and ultimately increases the dividend safety.
Historical financial performance
Because the IHS Markit merger was completed at the start of this year, there is no financial track record of the ‘new’ S&P Global. But, we could get a sense of how the company will perform in the future by looking at the past. Therefore, I will discuss the financial performance of S&P Global from FY2017 to FY2021 (see table below).
|
2017 |
2018 |
2019 |
2020 |
2021 |
4Y CAGR |
|
|
Sales ($ billion) |
$6.1 |
$6.3 |
$6.7 |
$7.4 |
$8.3 |
8.0% |
|
EBITDA ($ billion) |
$2.9 |
$3.2 |
$3.5 |
$4.1 |
$4.7 |
12.8% |
|
EBITDA margin (%) |
47.5% |
50.8% |
52.2% |
55.4% |
56.6% |
|
|
FCF ($ billion) |
$1.9 |
$2.0 |
$2.7 |
$3.5 |
$3.7 |
18.1% |
|
FCF margin (%) |
31.1% |
31.7% |
40.3% |
47.3% |
44.6% |
Source: Seeking Alpha company financials
It can be observed that the business has performed very well over recent years. High-single-digit revenue growth translated into double-digit EBITDA and free cash flow growth through continuing margin expansion. This is even more impressive if you consider how high the margins already were in 2017.
The following table shows the relevant dividend data over the observed period.
|
2017 |
2018 |
2019 |
2020 |
2021 |
4Y CAGR |
|
|
FCF ($ billion) |
$1.9 |
$2.0 |
$2.7 |
$3.5 |
$3.7 |
18.1% |
|
Dividends paid ($ million) |
$421.0 |
$503.0 |
$560.0 |
$645.0 |
$743.0 |
15.3% |
|
FCF pay-out ratio (%) |
22.2% |
25.2% |
20.7% |
18.4% |
20.1% |
|
|
Dividend per share ($) |
$1.64 |
$2.00 |
$2.28 |
$2.68 |
$3.08 |
17.1% |
Source: Seeking Alpha company financials
The total amount of dividends paid out increased at a slower rate compared to free cash flow growth (15.3% versus 18.1%). As a result, the free cash flow pay-out ratio has been decreasing slightly since FY2017. Dividend per share grew slightly faster compared to the dividends paid in millions due to share buybacks. All in all, this dividend policy looks very healthy.
Expected future performance
The million-dollar question is whether the post-merger S&P Global will continue to grow its revenue and margins as it did in the past. The company goals stated for FY2022 and FY2023 during merger presentation on March 1st this year are not very representative anymore, because there have been some downward revisions over the past months. At both the second and third quarter results of FY2022, management lowered full-year guidance. Besides, when you take a look at the earnings revisions page on Seeking Alpha, it can be observed that the analyst estimates have been in a downtrend since April this year.
Still, I think we can make a good assumption of how the future performance will look like.
Revenue growth outlook
During the merger presentation, management stated that it expects 6.5%-8.0% pro-forma revenue growth through FY2023. Obviously, this will not be achievable for FY2022 as the company reported a pro-forma adjusted revenue decrease of 4% over the first nine months. But for the mid-to-long term, a just below mid-point growth rate of 7.0% is a good estimate in my view. This rate is one percent lower than the pre-merger growth rate of S&P Global between FY2017-FY2021, and slightly above the average revenue growth rate of IHS Markit during the FY2017–FY2021 period (6.7% CAGR on average). Growth will be supported by emerging segments with >10% future market growth such as ESG, Climate & Energy Transition, Credit and Risk Management, and Multi-asset Class Data.
Margin outlook
For the full fiscal year 2022, margins are expected to decline, mainly due to the weakness in the Ratings division and merger with IHS Markit. Over the first nine months of FY2022, S&P Global reported a pro-forma EBITDA margin of 47.0%. The businesses from IHS Markit typically have a lower overall margin compared to pre-merger S&P Global. For example, the overall EBITDA margin over FY2021 was 43.6%. I believe that margin suppression will be temporary. Once debt markets improve, margins of the Ratings division will return to previous levels. Moreover, S&P Global stated during the merger presentation that post-merger cost and revenue synergies (see figure below) are expected to drive margin increases in the following years.
Expected cost and revenue synergies (Investor Call Completion of S&P Global and IHS Markit Merger)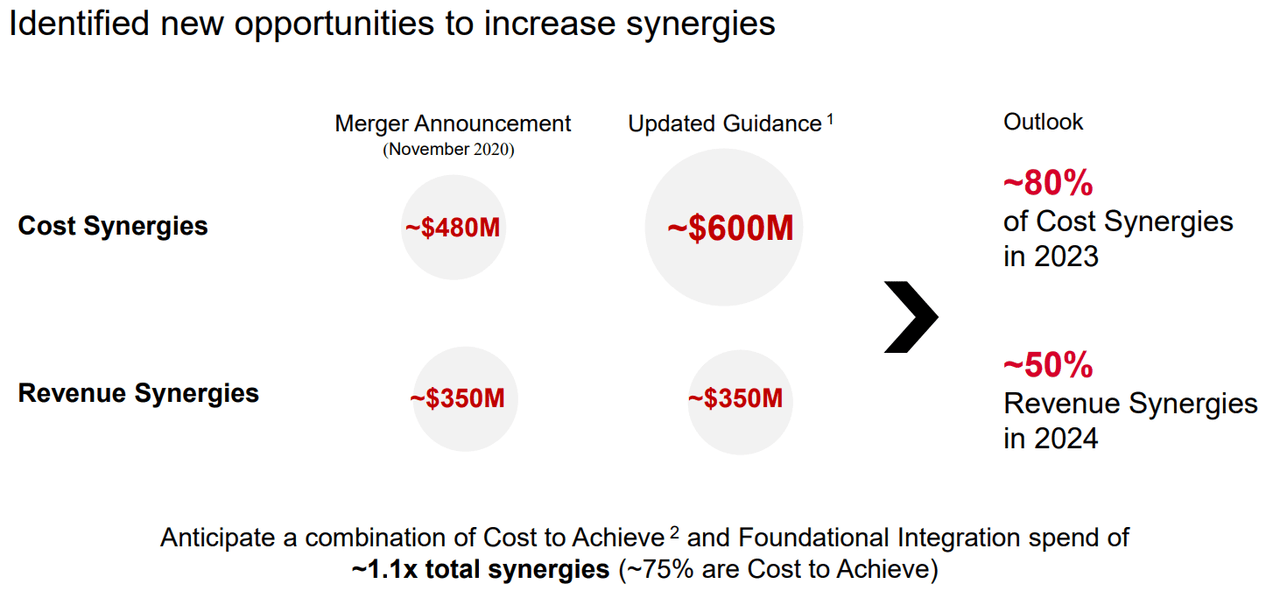
The company expects ~200 bps margin expansion per year through FY2023. If also after FY2023 margins keep expanding at a steady pace, I think double-digit free cash flow growth is very well achievable.
Dividend growth outlook
So what does this all mean for future dividend increases?
The company has a target pay-out ratio of 20%-30% of diluted EPS, so let’s assume the same free cash flow pay-out ratio for this article. Based on the dividends paid out over the first nine months of FY2022, I expect that over the full fiscal year this will be ~1.0 billion. In the Q3 FY2022 earnings release, management also stated that is expects a non-GAAP pro forma adjusted free cash flow of roughly $4.0 billion. This implies a 25% free cash flow pay-out ratio for FY2022. Maybe it will even be a bit less as the company still has to complete its accelerated share repurchase program before the end of year.
For FY2023 management expects free cash flow to be around $5.0 billion. Assuming double-digit free cash flow growth thereafter, it is safe to say that the dividend can nicely grow at a high-single-digit to low-double-digit rate. Thus, the long-term fundamentals will enable the company to expand its dividend increase track record into the future.
Valuation
To calculate the intrinsic value of a company, I often use the Discounted Cash Flow (or DCF) Analysis. It is very hard to predict the exact future growth rate, so I will start with determining a bandwidth for the free cash flow growth rate.
I have already addressed the expected future growth rate in the previous section. Because I think that double-digit growth is very well possible, I will assume a free cash flow bandwidth of 9.0% to 13.0% with 11.0% as a mid-point. This is well below the free cash flow growth rate from the past four years. Moreover, I will use $5 billion as the base free cash flow in FY2023 and assume further growth afterward (in line with the most recent management guidance; this may be updated on the coming investor day).
The perpetuity growth rate is typically between historical inflation (2-3%) and historical GDP growth rate (4-5%). Therefore, the 2.5%-4.5% range is assumed for the perpetuity growth rate.
|
Input |
Value |
|
First year of projections |
2022 |
|
Personal Required rate of Return |
10.0% |
|
Number of shares outstanding |
0.3258 billion |
|
Base free cash flow FY2023 |
$5.0 billion |
|
Free cash flow growth rate after FY2023 |
9.0% / 10.0% / 11.0% / 12.0% / 13.0% |
|
Growth rate in perpetuity |
2.5% / 3.0% / 3.5% / 4.0% / 4.5% |
|
Net borrowings ($ billion) |
$9.4 billion |
The intrinsic values from the DCF analysis are presented for every growth rate combination in the table below. At the mid-point assumptions, I get a fair value of $340.21. Therefore, shares of S&P Global are quite attractive at the current share price ($319.25). Even if the free cash flow growth rate turns out to be a bit lower, the current price level still offers a decent entry point for a 10.0% return on investment.
Discounted Cash Flow Analysis for different growth rates (Author)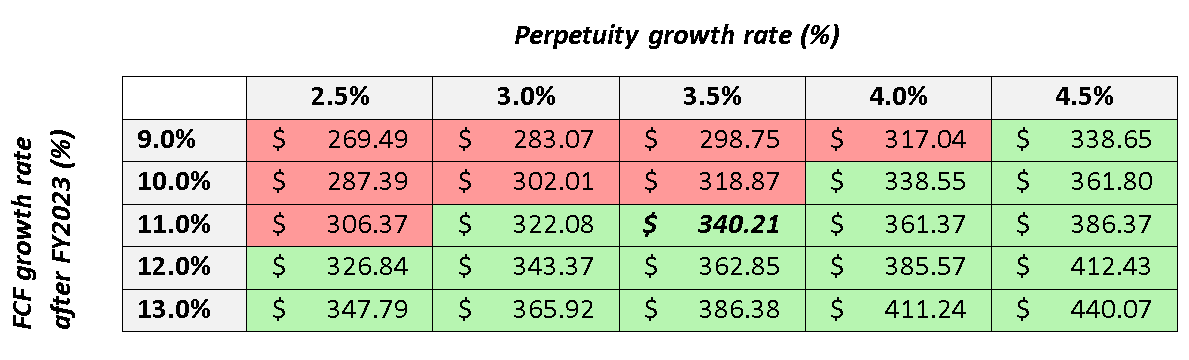
Risks to consider
While the future looks bright for S&P Global, there are some risks to consider. If the underlying business is negatively impacted, this might have consequences for the company’s ability to increase the dividend. I will discuss three of them in the following.
- I think the main risk for the company as a whole is the IHS Markit merger. Studies have shown that the failure rate of mergers and acquisitions lies somewhere between 70% and 90%. Both S&P Global and IHS Markit have excellent track records, but will they also do well together? Management sees some significant cost and revenue synergies, but only time will tell if their vision actually plays out in the future.
- If the global economy continues to slow down and interest rates continue to rise, debt issuance volume could show further weakness. Subsequently, this could further negatively impact revenues and margins from the Ratings division, which remains the largest profit driver of the company. Also, with higher interest rates, investors will apply a lower valuation multiple on growth-oriented companies like S&P Global. On the other hand, FED chairman Jerome Powell hinted slower rate hikes during last week’s press conference. While he still expects a higher future interest rate, it seems that 100 bps hikes are off the table for now.
- Besides Ratings, also revenue from other divisions could be impacted if the financial markets remain suppressed. For example, revenue from the Dow Jones Indices division could decrease if total assets under management (or AUM) further decrease. Revenue for Indices is mainly driven by asset-linked fees. While the overall division revenue was up 3% YoY in Q3, asset-linked fees were down 5%. On the positive side, the decrease in AUM through price depreciation was partly offset by net capital inflows.
Final thoughts
S&P Global offers a wide variety of financial services and it has built an impressive dividend track record. The almost five-decade-long dividend increase streak is a result of excellent financial performance. Even if growth of the post-merger S&P Global slows down compared to most recent fiscal years, I strongly believe that the company will continue to increase the dividend.
The IHS Markit merger provides risks as we don’t know how the post-merger business will perform, but there are also some significant advantages. Further revenue diversification and a higher share of recurring revenue increase the resiliency of the overall business during tough economic markets, and thus the safety of the dividend.
Assuming low-double-digit free cash flow growth, the stock is currently attractively valued for a 10.0% return on investment. Therefore, I rate S&P Global stock a buy and advise growth-oriented investors to consider adding some shares.
Be the first to comment