ismagilov/iStock via Getty Images
The truly historical start to this year has caused immeasurable pain on the investors of the world. Trillions of dollars of wealth have been wiped out, and the calls for further declines resonate across this platform and countless others. I, however, think we’ve probably seen the bottom, and that we’ll see a strong rally in the coming months and into next year. The level of bearishness that we saw in May and June lines up with other major market bottoms, and while it’s certainly possible some event takes us to a new low, I have placed my bets that we’ve already bottomed.
The case for a bottom
Now, having read that one paragraph, you may already think I’m a bit mad. How can I call a bottom when we have a war in Ukraine, massive inflation across the globe, surging interest rates, plummeting consumer sentiment, and the threat of a recession looming? The simple answer is that the stock market always bottoms before the news cycle does. In other words, if you wait for everyone to tell you it’s okay to buy stocks, the move will already be mostly over and you’re buying in at much higher levels. If, however, you use the clues the market provides us, you can greatly increase the odds of success. I believe those clues are saying that fear has reached the point where we can make a bottom, and further, I believe Wall Street is already positioning for the eventual rally. Let’s take a look via the S&P 500 (NYSEARCA:VOO).
VOO is a great way to index invest because it tracks the S&P 500 extremely well, and has a rock-bottom expense ratio. If index investing is your thing, I highly recommend VOO.
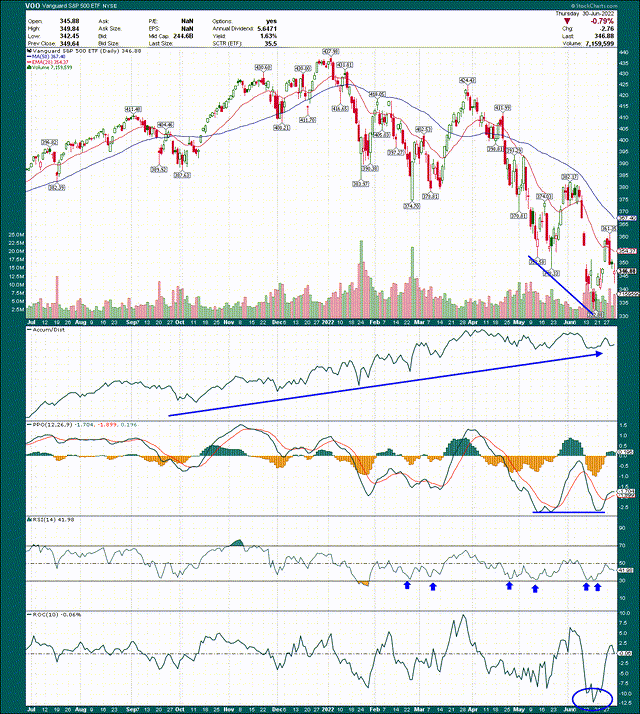
Now, let’s look first at the price chart, which is quite ugly to say the least. However, I’ve drawn a blue trend line from the two May lows to the June low. Now draw your attention to the PPO chart below that, and see that the same time period is flat. That’s called a positive divergence, and what it means is that while price is making new lows – significantly lower lows in this case – momentum is actually waning to the downside. This very often portends the end of a downtrend, and it works in both directions. In other words, we often see negative divergences at tops, and it’s pretty reliable.
Next, the 14-day RSI is showing similar signs that the worst of the selling is done. We’ve had numerous tests of the 30 line, and bounced each time. That’s a good sign for the bulls.
Finally, on the bullish side of the ledger, the June low posted a 10-day rate of change, or ROC, of -12%. That’s an extraordinary value for a US index fund, and it shows just how bad things were. If we look at the VOO price chart at that same time period, we see elevated volume, which is certainly what you’d expect at a significant bottom.
Now, none of these things guarantee us anything. However, the confluence of these factors occurring at a time when there is other cause for bullishness is too much for me to ignore. I told subscribers last week I thought the bottom was in, and that it was time to increase risk exposure. I still think that’s the case, and I will unless we make a new lower low.
Now, let’s take a look at some sentiment indicators to see what they’re telling us, and why I believe all of this supports the idea that the bottom is in.
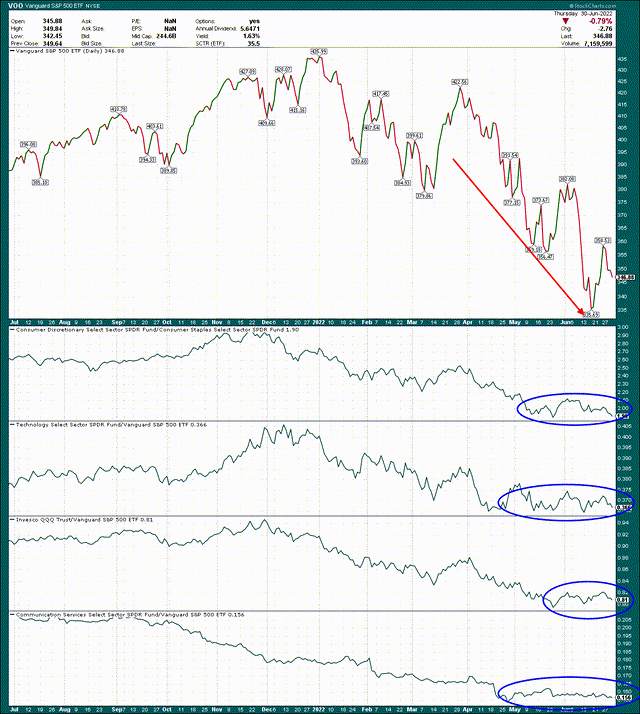
We’ll start with a simplified price chart of VOO, along with some ratios I follow closely.
Our first ratio is consumer discretionary against consumer staples. This ratio shows whether Wall Street believes the economy is strong enough to support incremental spending. You can see this ratio topped in November last year before rolling over, well before the VOO rolled over. I believe the opposite is happening now, and that this ratio is telling us Wall Street thinks we’re about to go higher.
The next one is another aggressive area of the market, which is technology, plotted against VOO itself. This ratio also topped well before the market last year, but is consolidating now, similar to the discretionary/staples ratio.
The same is true for the Nasdaq against the VOO, as well as communication services against the VOO. The point here is that all of these are more aggressive areas of the market that tend to lead during bull market advances. They also tend to lag during bear markets, which is exactly what we’ve seen. What I’m betting on is that these ratios are bottoming because we’re either at or near the bottom for the broader market. The evidence is certainly compelling.
Sentiment says we’re there
Apart from price action, I like to follow sentiment indicators to let us know when investors have reached a level of bearishness sufficient to post a bottom. Sustainable bottoms are made when investors throw in the proverbial towel, unable to take the pain of more selling. Essentially, markets make bottoms when there are no remaining sellers. That is when buyers overwhelm the order books, and prices move up. I believe the price action and ratios we looked at above support this, as does what we’re about to look at now.
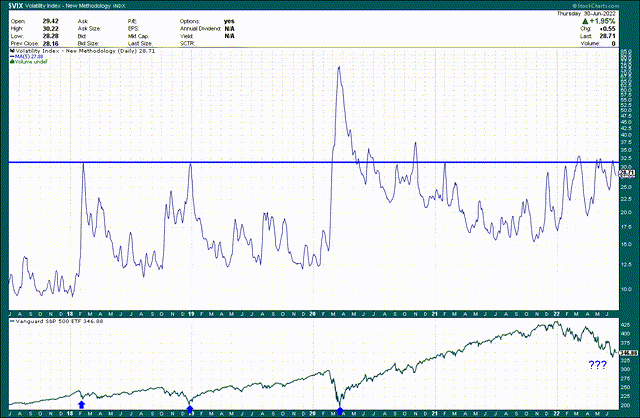
First up, I’ve plotted the 5-day moving average of the volatility index (VIX). I plot the 5-day MA because it’s much smoother than the daily movements, and lets us see volatility over sustained periods rather than the noise of massive daily moves.
I’ve drawn a line at just over 30, which tends to be the level where sustainable bottoms are made. We’ve hit 30 on the VIX 5-day MA four different times in 2022, and it’s certainly possible we hit it another time or two. However, if you look at the 2018 and 2020 instances of this happening, we made very significant bottoms in the VOO. Is it possible we get a 5-day MA at 40? Anything is possible. However, given the rest of the evidence, I think that’s unlikely at this point. And before we get some perma-bears shouting about the COVID spike to 70+, that was an extraordinary event in human history. I believe there is absolutely no chance of that occurring this time around, and that this bear market is a typical cyclical bear market within a larger bull market.
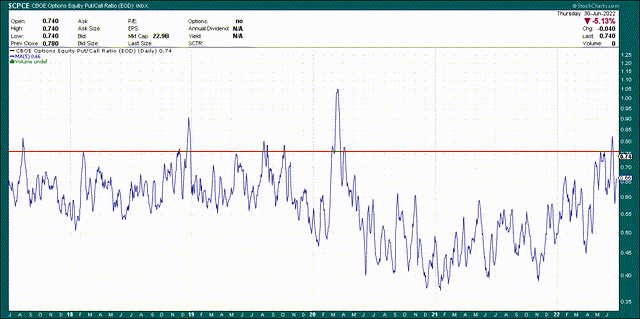
Next, let’s take a look at the equity put to call ratio, or CPCE. This measures the proportion of options traded that are puts versus calls. A higher CPCE means more puts are being bought, and vice versa. This is a great indicator of sentiment because we can see when options buyers are most bearish or bullish. High CPCE readings are when sentiment is the worst and most bearish, and that also happens to be when we see bottoms, typically. Below we have the 5-day MA of the CPCE for the past five years.
I’ve placed a line at the 0.75 level, and as you can see, that level is also only reached during extremely bearish periods. However, if you’re an equity buyer, extremely bearish periods are exactly when you want to buy. We reached more than 0.80 earlier this month on the CPCE 5-day MA, and I believe that’s yet another sign we’ve bottomed. Bearish sentiment like this is quite rare, and investors should ignore it at their own peril.
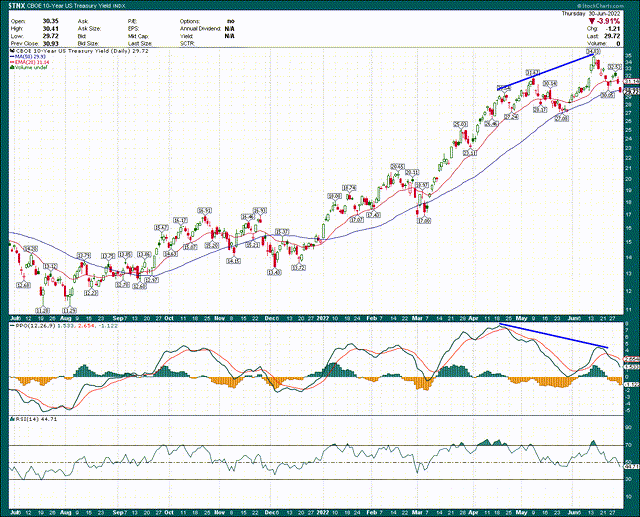
Finally, with the surge in inflation around the world, interest rates are sharply in focus. Below we have the 10-year US Treasury, but you can almost pick whatever your favorite risk-free rate is, and it will look similar.
Remember the positive divergence we look at for the VOO? The opposite has occurred on the 10-year UST, with a massive negative divergence coming into play since April. We have significantly declining momentum to the upside while price made new highs, and I think it is only a matter of time before rates come back down. Again, you may think I’m crazy for saying that, but I’m just looking at where the money is rotating, and it certainly looks to me like the big money thinks we’ve seen the top for rates for now. Lower rates are great for equities, just like higher rates are terrible for them.
Final thoughts
Buying at what looks like a bottom is never a comfortable thing to do. After all, buying the bottom means you’re putting money to work at a time when literally everyone is shouting about the end of days and how stocks will fall for years to come. Selling into that kind of pressure makes no sense to me, and I’ve been taking on more risk exposure in the past week or so for that very reason.
I could certainly be wrong, and we may see another bottom. If that’s the case, I’ll stop out of my positions based upon prior relative lows and will reassess if needed. I advise my subscribers to do the same thing. Always have a well-informed stop in place to limit risk in case you’re wrong. If I’m wrong, I’ll take a small hit and move on to the next trade. However, if I’m right, the rewards could be enormous.
I believe there was plenty of reason two months ago to be bearish, but I also believe the market has discounted those reasons and that unless we get some other massive shock we’re not aware of, stocks are much more likely to go up than down from here. I’m positioned for the next phase of this bull market; are you?


Be the first to comment