

STOCK MARKET KEY POINTS:
- The S&P 500 fails to push above a key technical resistance and turns lower, ending a two-day winning streak
- Despite Monday’s pullback, expectations that the Fed will downshift to a slower pace of interest rate increases should create a constructive backdrop for stocks
- All eyes on U.S PPI on Tuesday whereas on Wednesday, the focus will shift to U.S. retail sales and the November FOMC minutes
Trade Smarter – Sign up for the DailyFX Newsletter
Receive timely and compelling market commentary from the DailyFX team
Subscribe to Newsletter
Most Read: Bitcoin and Ethereum Have Crashed and Recovered Before. Will They Do It Again Now?
After struggling for direction and wobbling for much of the day, U.S. stocks finished lower on Monday, unable to extend last week’s robust rally as sentiment turned a bit more cautious, but not panicky. There were no major catalysts, but comments from Fed Vice Chair Brainard indicating that the FOMC may soon downshift the pace of interest rate hikes seemed to prevent a larger pullback.
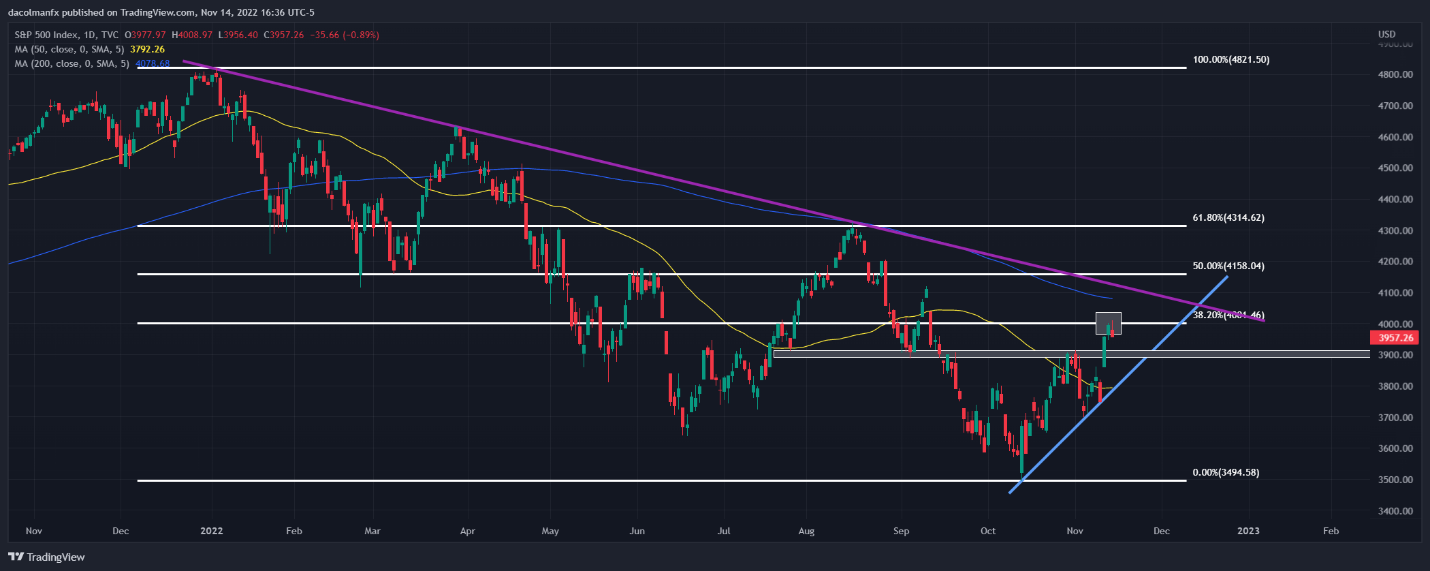
When it was all said and done, the S&P 500 fell 0.89% to 3,957 after stalling at a key Fibonacci resistance near the psychological 4,000 level, with the real estate and consumer discretionary sectors leading the slide. Meanwhile, the Nasdaq 100 declined 0.98% to 11,700, dented by heavy selling in Microsoft (MSFT), Amazon (AMZN) and Tesla (TSLA) stocks.
Looking ahead, there are medium-impact events on the calendar Tuesday to keep a close eye on, with the October PPI on tap, so volatility could trend higher, but Wednesday could be even more active on Wall Street due to the release of last month’s retail sales data and the minutes of the November FOMC meeting.
In terms of market bias, there are reasons to believe that the mood could remain somewhat bullish in the near term. In the grand scheme of things, expectations that the Fed will slow its pace of tightening, easing inflationary pressures, news that China will fine-tune its zero-code policies to support its economy, and positive seasonal factors should all help support risk assets in the coming days and weeks, at least to some extent.
Focusing on price action, the S&P 500 failed to break above key resistance near the 4,000 handle, a ceiling defined by the 38.2% Fibonacci retracement of the 2022 selloff. From those levels, we have seen a modest drop, but the move has not created much technical damage to derail the rebound, meaning prices could resume their ascent soon.
If the bullish scenario plays out, we need to see a decisive climb above 4,000 to have confidence in the recovery prospects. If this area is breached to the upside, the focus shifts to the 200-day moving average, followed by trendline resistance near 4,120. On the flip side, if sellers manage to drive the market lower, initial support appears at 3,900 and then 3,825.
Click the link below to download the quarterly fundamental and technical forecast for the U.S. stock market. It is free!
Recommended by Diego Colman
Get Your Free Equities Forecast
S&P 500 TECHNICAL CHART
S&P 500 Chart Prepared Using TradingView
EDUCATION TOOLS FOR TRADERS
- Are you just getting started? Download the beginners’ guide for FX traders
- Would you like to know more about your trading personality? Take the DailyFX quiz and find out
- IG’s client positioning data provides valuable information on market sentiment. Get your free guide on how to use this powerful trading indicator here.
—Written by Diego Colman, Market Strategist for DailyFX
Be the first to comment