

SPX HITS RECORD HIGHS
The environment for U.S. equities remains favorable despite recent QE taper talk. It is important to remember that tapering simply means “taking your foot off the pedal”, which will not halt asset purchases completely thus maintaining the conducive environment for the stock market.
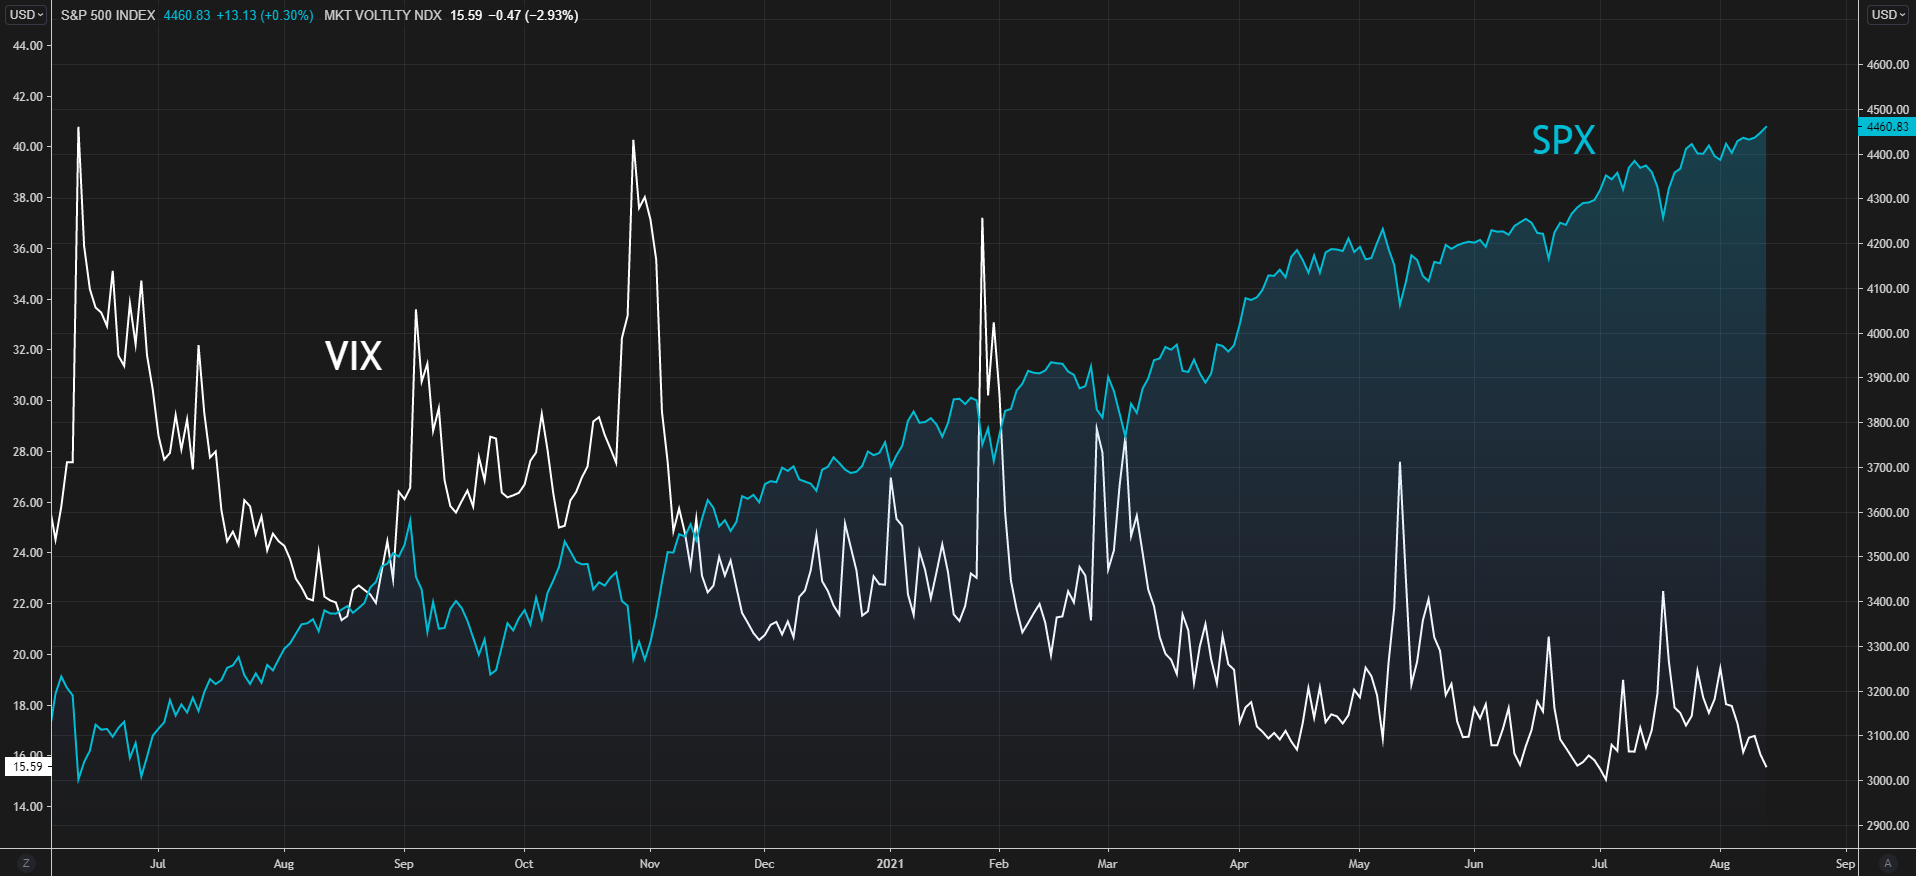
August has traditionally been a relatively inactive month for financial markets which is revealed by incremental candles on the daily chart. This has not deterred the index from reaching historic levels throughout most of the past week, which is not surprising as the index tends to be largely inversely correlated to the Volatility Index (VIX) – see chart below.
*Note: correlation does not necessarily mean causation.
SPX VS VIX
Chart prepared by Warren Venketas, Refinitiv
Boost your stock market knowledge with our articles on the types of stocks available, how equities impact the economy, and getting started with stock trading.
S&P 500 INDEX (SPX) DAILY CHART
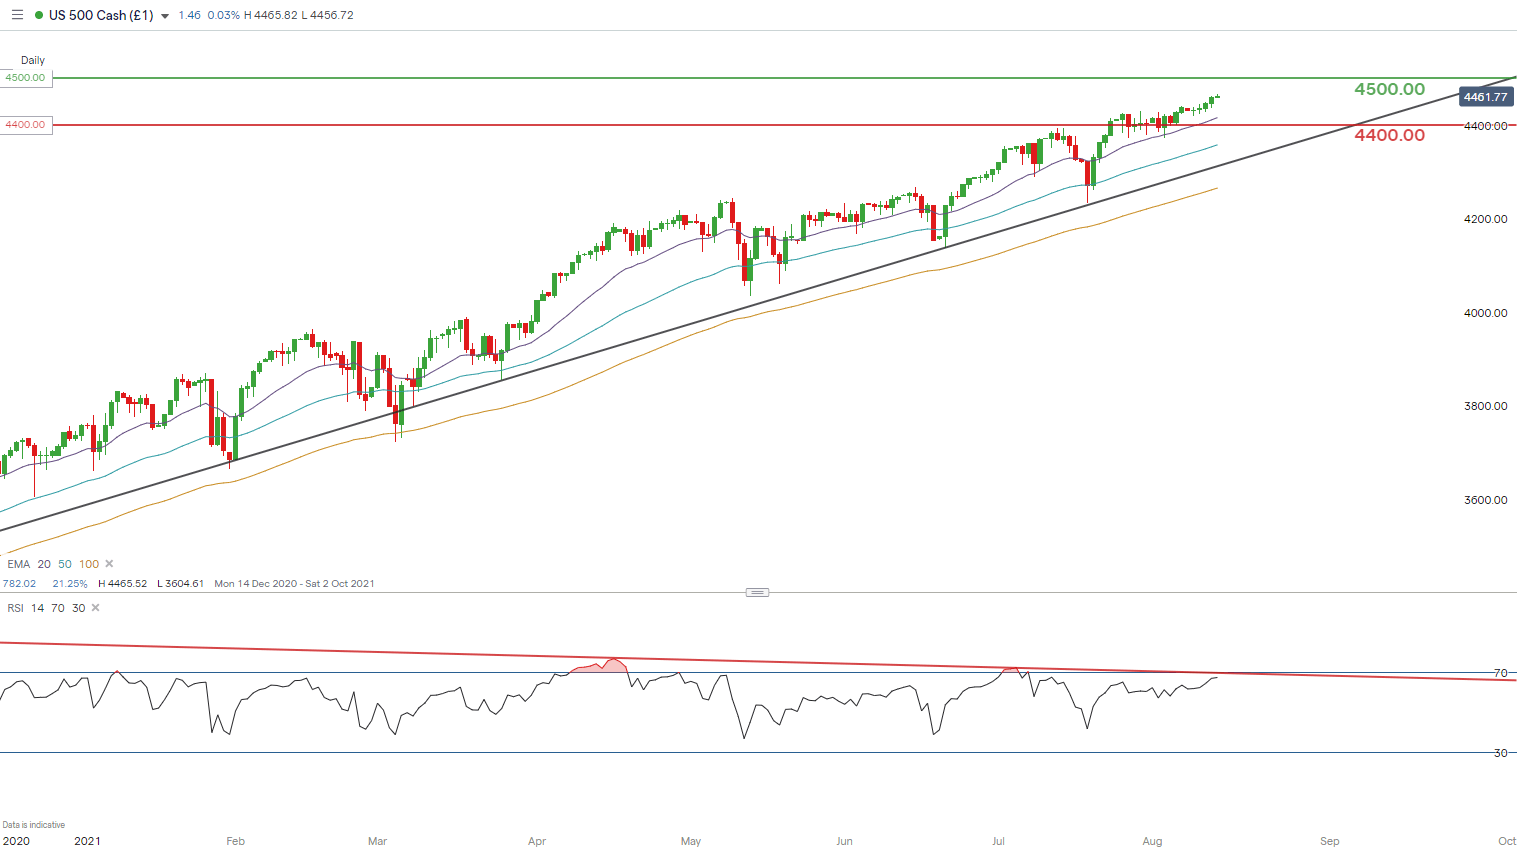
Chart prepared by Warren Venketas, IG
The daily SPX chart above is slowly approaching the 4500.00 psychological level. The Relative Strength Index (RSI) suggests prices are nearing overbought territory. The RSI also indicates a downward trendline as price action rises which is termed as bearish divergence. This opposing movement often results in a subsequent fall in prices which could mean a pullback on the index. For now, the outlook remains bullish but caution should be exercised through sound risk management in the event of the aforementioned potential correction.
3RD BUSIEST PORT IN THE WORLD SHUTS DOWN AFTER COVID-19 CASE
China closed one of it’s primary terminals in the Ningbo-Zhoushan port due to a worker testing positive for COVID-19. The result has been a backlog in shipping and logistics despite efforts to divert vessels elsewhere. China has a strict policy on COVID-19 and the fact that one person can cause such a drastic outcome further adds to this. The likelihood of this happening again is quite high as long as China maintains this zero tolerance approach.
North America and Europe are key partners with this specific port and could have knock-on effects in the near-term. Inflation concerns may be exacerbated by backlogs, container shortages and rising shipping costs (see chart below) with consumers bearing the brunt of the cost – the chart below outlines the exponential rise in the cost of transport from Chinese ports including Shanghai.
SHANGHAI CONTAINERIZED FREIGHT INDEX
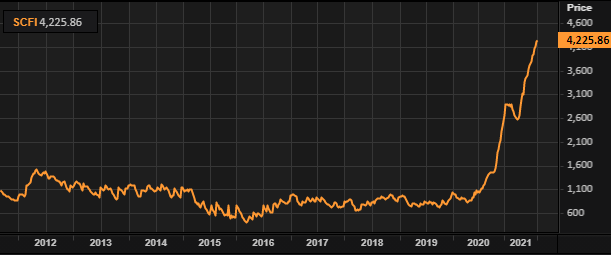
Chart prepared by Warren Venketas, Refinitiv
Commodityprices have also taken a hit as the number of new COVID-19 cases increase in China (see chart below). Projected demand for commodities are on the decline with China being hampered by the delta variant which will impact the world over with emphasis on commodity export dependent countries.
NEW COVID-19 CASES CHINA
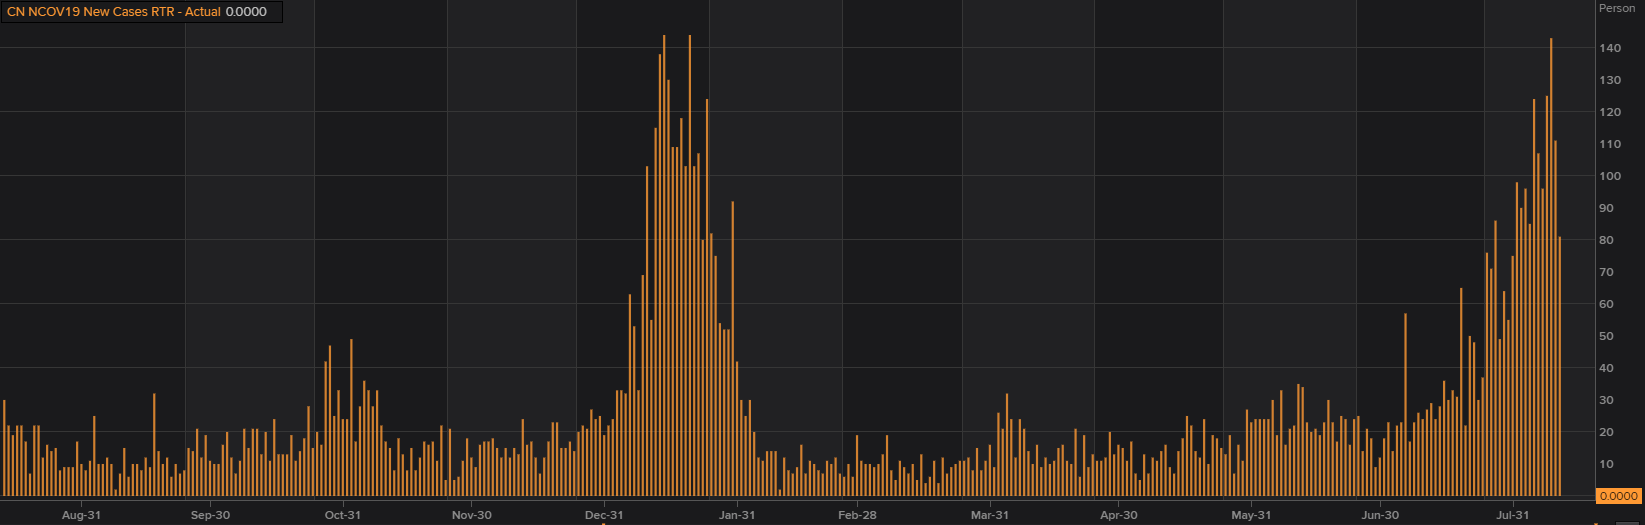
Chart prepared by Warren Venketas, Refinitiv
CRUDE OIL FALLS AS DELTA VARIANT FEARS ENDURE, BIDEN PRESSURES OPEC
Following on from the China effect, global concerns over the delta variant is rife with crude oil prices under pressure since the beginning of August. President Joe Biden has called for OPEC to increase output to essentially drop crude oil prices. This being said, global demand for oil is seemingly lower than it was a few months ago. The request made by President Biden will likely be denied by OPEC.
The International Energy Agency (IEA) has consequently released a report revising demand for oil lower with pre-pandemic levels only forecasted for 2023 (see table below):
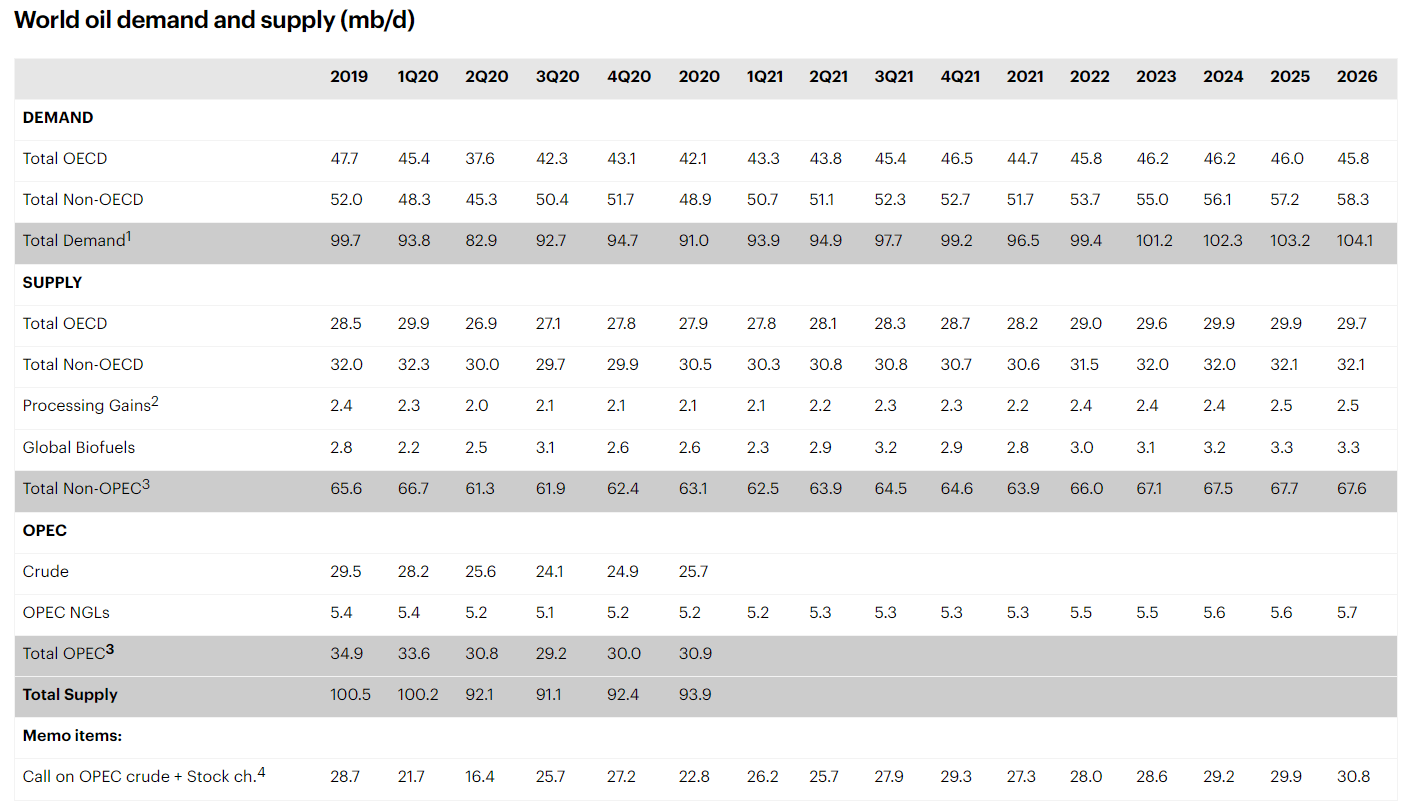
Source: IEA
BRENT CRUDE DAILY CHART
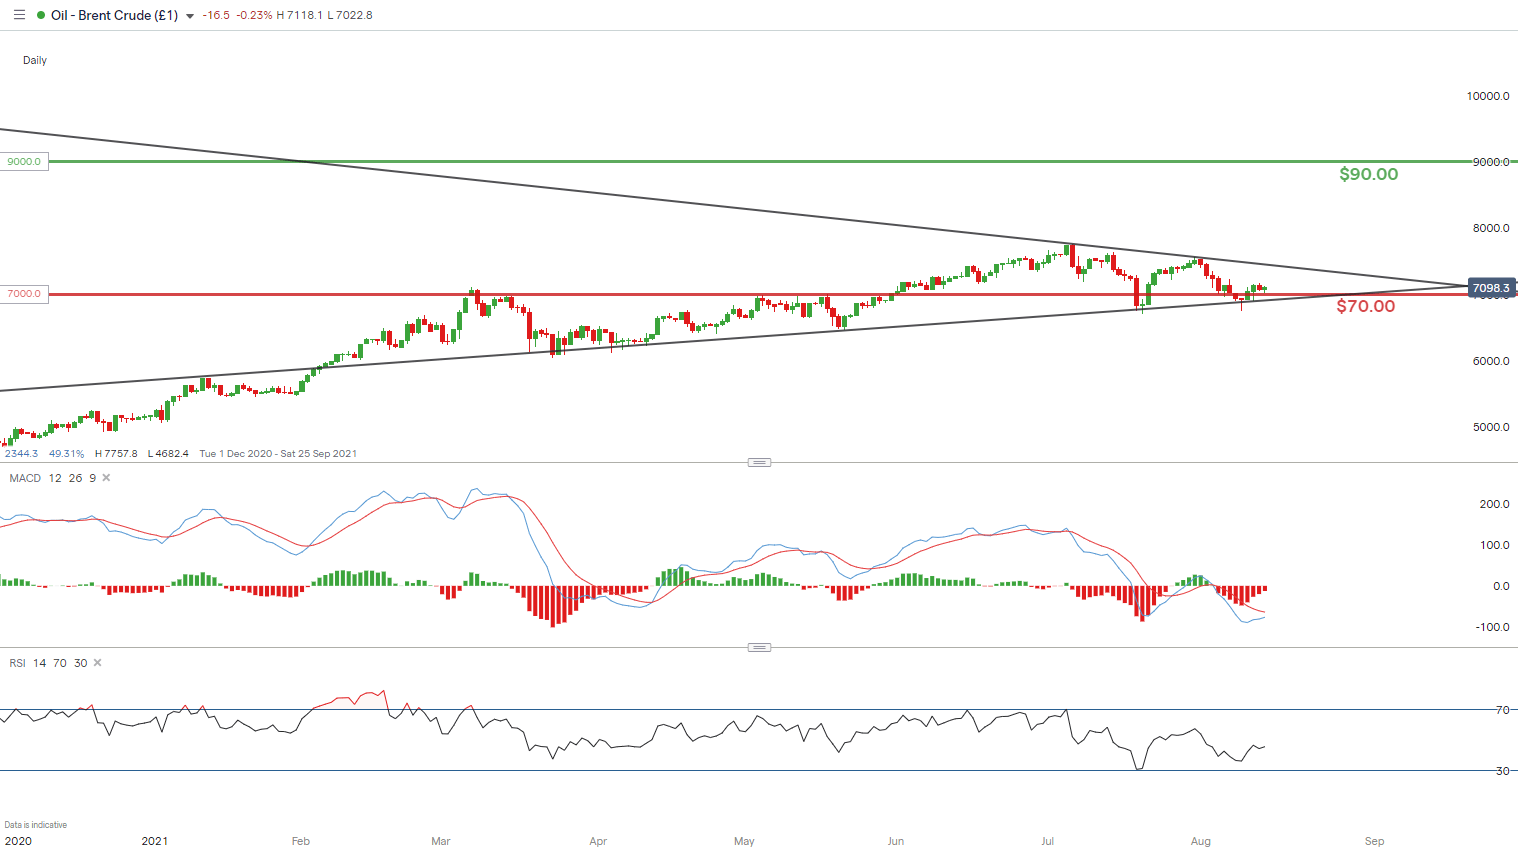
Chart prepared by Warren Venketas, IG
The brent crude daily chart above reflects the hesitancy in crude oil price action with a consolidatory move which has resulted in the formation of a symmetrical triangle (black). These converging trendlines give traders an unbiased outlook which means the market has the potential to breakout higher or lower depending on which trendline prices pierce first. Often traders favor the preceding trend which in this case is higher but, a confirmation close above or below the triangle pattern would likely conclude a directional bias moving forward.
— Written by Warren Venketas for DailyFX.com
Contact and follow Warren on Twitter: @WVenketas
Be the first to comment