

S&P 500, Nasdaq, US Treasuries Price Analysis
- Global markets remain in the crossfire as policymakers attempt to offset the economic slowdown emanating from the novel coronavirus.
- The upcoming jobless claims report out of the United States takes on even more importance than usual as this will be one of the first looks at just how hard the US labor market has been hit by shutdowns.
- The Fed announced even more emergency accommodation around market open yesterday: US equity futures went limit down anyways. More pressing, it appears, is a stimulus package getting passed by Congress.
Fed Fires Again – Markets Shudder
Another weekly open and another announcement from the FOMC designed to, hopefully, arrest the global declines that have eviscerated pretty much every equity index on Earth, at least outside of China. In the US, both the Dow and S&P 500 passed the 30% marker last week, extending their respective slides into the weekly close as the idea of holding risk over the weekend just did not appear very appealing.
That statement can be made on both sides of the matter, even for bears that have seen a precipitous decline over the past month as risk aversion has enveloped global markets. Weekend announcements out of the Fed are becoming a more normal thing; and each time the bank has increased the size and scope of the respective bazooka. Most recently, the Fed announced open-ended QE. This is on top of last weekend’s announcement for $500 billion in Treasuries and $200 billion in mortgage backed securities to be purchased, along with an emergency rate cut of 100 basis points. The one thing that’s clear is that the Fed isn’t going to stop employing stimulus measures in an effort to offset crisis-related moves from the continued growth of the novel coronavirus.
The bigger question is if this will help to arrest the major sell-offs that have engulfed global markets over the past month; or whether some element of fiscal stimulus is going to be needed to help to turn the tides.

Recommended by James Stanley
Building Confidence in Trading
In US equities, the severity of the sell-off has been in large part governed by the constituency of the index. In the Dow Jones Industrial Average, the hit has been harder than what’s shown in the S&P 500 and the Nasdaq 100; as the Dow’s largest component of Boeing has been absolutely hammered over the past month, losing almost 70% of its value as the airplane manufacturer has been best by both the slowdown in airlines and the longer-running issue behind its 737 Max.
The S&P 500 is now closing in on the 50% marker of the post-Financial Collapse move. This shows around the 2k psychological level, with the price of 2023 serving as the election night low for the S&P 500 when Donald Trump was elected as President of the United States. On a shorter-term basis, today’s low is holding around the 76.4% Fibonacci retracement of the 2016-2016 major move.
S&P 500 Monthly Price Chart
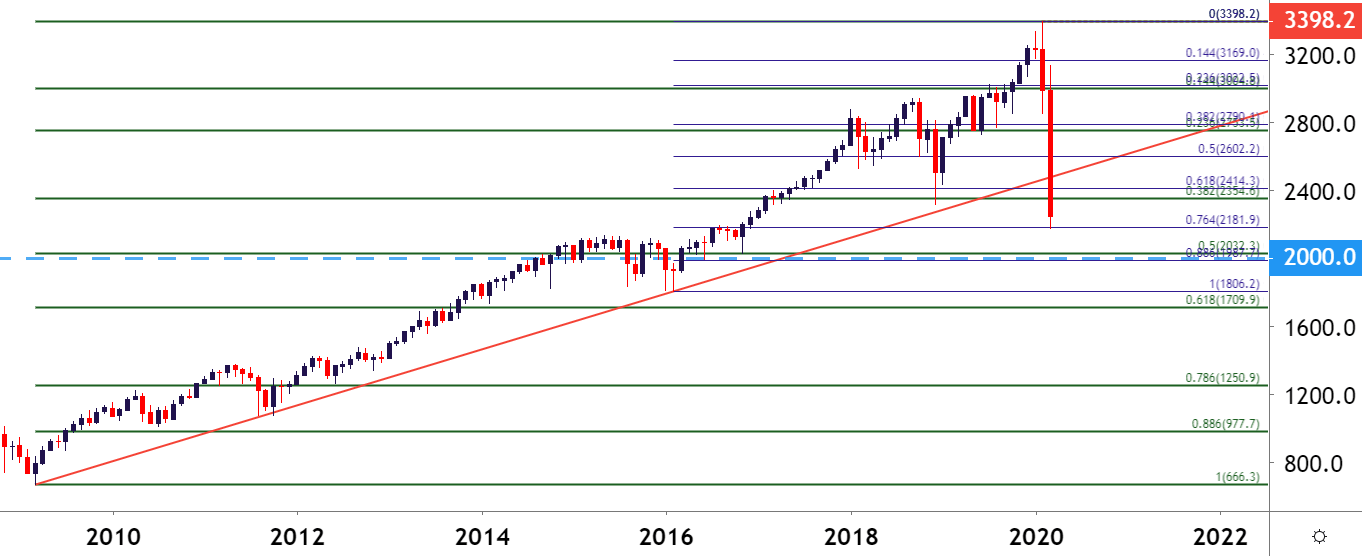
Chart prepared by James Stanley; SPX500 on Tradingview
The losses so far in the tech-heavy Nasdaq 100 have been tame by comparison. The index is currently holding above the 38.2% retracement of the post-Financial Collapse move; with a support assist coming in from a trendline projection that connects the February 2016 and December 2018 swing-lows. Also of interest to near-term price action – the 50% marker of the same 2016-2020 major move is helping to hold the lows whereas the S&P 500 is testing the 76.4% retracement of the move plotted over the same period.
Starts in:
Live now:
Mar 26
( 17:03 GMT )

James Stanley’s Thursday Webinar
Trading Price Action
This could make the Nasdaq 100 as a more compelling option for those that are looking to fade this recent sell-off, looking for the troves of accommodation already provided by the Fed and, perhaps soon provided by Congress on the fiscal front to bring bulls back into the picture.
Nasdaq 100 Monthly Price Chart

Chart prepared by James Stanley; Nasdaq 100 on Tradingview
The nastier of the three major American indices is the Dow, which is getting closer and closer to a test of the 50% marker of the move derived from the post-Financial Collapse backdrop.
In the Dow – the big level of interest is around the 18k level. Last week saw the index drive below the 20k marker and, as yet, buyers haven’t been able to reverse the tide. The 18k level is notable as this helped to set resistance in November of 2014 and, in various ways, remained as such until July of 2016. This level even caught a re-test during the chaos of the Presidential election in 2016; with price action soon launching higher and never looking back – until February of 2020, that is.

Recommended by James Stanley
Download our Q1 Equities Forecast
Dow Jones Industrial Average Monthly Price Chart

Chart prepared by James Stanley; Dow Jones on Tradingview
Treasury Markets Still in Focus After Liquidity Concerns Show with Increased Volatility
One of the more disconcerting aspects of this recent round of risk aversion is something that not very many folks are talking about, at least yet, and that’s the sharp volatility that’s been showing in US Treasuries even as the Fed is rushing to markets with accommodation.
The past couple of weeks have seen outsized volatility in US Treasuries, with the 30-year Treasury bond spiking from a low of .84% on March 9th to a high of 1.94% last Wednesday. Matters have since calmed a bit, with the 30-year settling in at a current rate around 1.3%.
US Treasury 30-Year Bond Yield
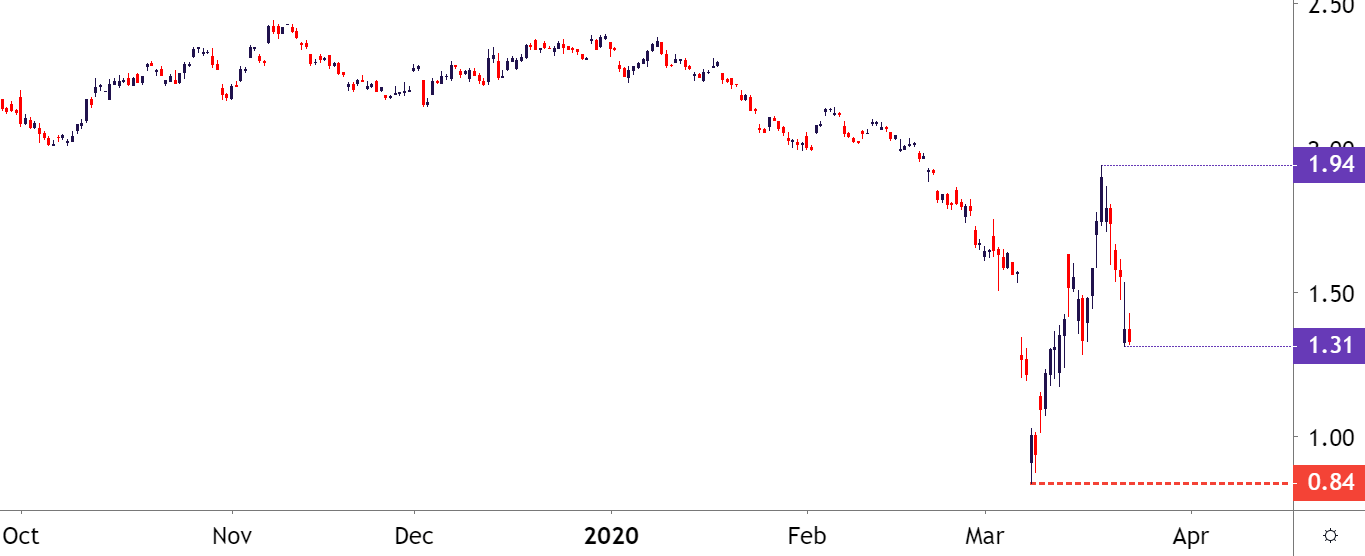
Chart prepared by James Stanley; TYX on Tradingview
The 10-year Treasury note has been on a similarly wild ride, spking down to an all-time-low of .4% just a few weeks ago; and then spiking up to 1.27% last Wednesday. Currently the 10-year is trading around the 75 basis point market, also illustrating a bit of calm after a major gasp of volatility showed in the prior couple of weeks.
10-Year US Treasury Note Yield

Chart prepared by James Stanley; TNX on Tradingview
— Written by James Stanley, Strategist for DailyFX.com
Contact and follow James on Twitter: @JStanleyFX
Be the first to comment