

Scott Olson/Getty Images News
Looking for a way to harness volatility in your portfolio? Many investors use covered call/buy-write funds in order to accomplish this.
In addition to our usual high yield dividend stocks and income vehicles, we’ve also covered NASDAQ and S&P-based Covered Call ETFs in our past articles. This article will focus on S&P-500-based covered call funds, which seek to enhance yield and/or lessen volatility via covered calls.
The JPMorgan Equity Premium Income ETF (NYSEARCA:JEPI) is one of the more heavily-traded covered call funds. It’s a relatively new fund – it IPO’d in May 2020.
Profile:
The JPMorgan Equity Premium Income ETF “Seeks current income while maintaining prospects for capital appreciation. The fund seeks to provide the majority of the returns associated with its primary benchmark, the Standard & Poor’s 500 Total Return Index, while exposing investors to less risk through lower volatility and still offering incremental income.
Under normal circumstances, the fund invests at least 80% of its assets in equity securities. It may also invest in other equity securities not included in the S&P 500 Index. The fund “generates income through a combination of selling options and investing in U.S. large cap stocks, seeking to deliver a monthly income stream from associated option premiums and stock dividends.” (JP Morgan site)
JEPI also invests in Equity-Linked Notes (ELNs), which it utilizes for income: “The Fund may invest up to 20% of its net assets in ELNs. ELNs are structured as notes that are issued by counterparties, including banks, broker-dealers or their affiliates, and that are designed to offer a return linked to the underlying instruments within the ELN. ELNs in which the Fund invests are derivative instruments that are specially designed to combine the economic characteristics of the S&P500 Index and written call options in a single note form.”
Holdings:
Industrials, Healthcare, Tech, and Financials make up ~47% of JEPI’s sector holdings. However, JEPI’s sector weightings are quite different from that of the S&P, with the fund being underweight in Tech, Financials, Communication Services, and Consumer Cyclical; and overweight in Industrials and Consumer Defensive.
Hidden Dividend Stocks Plus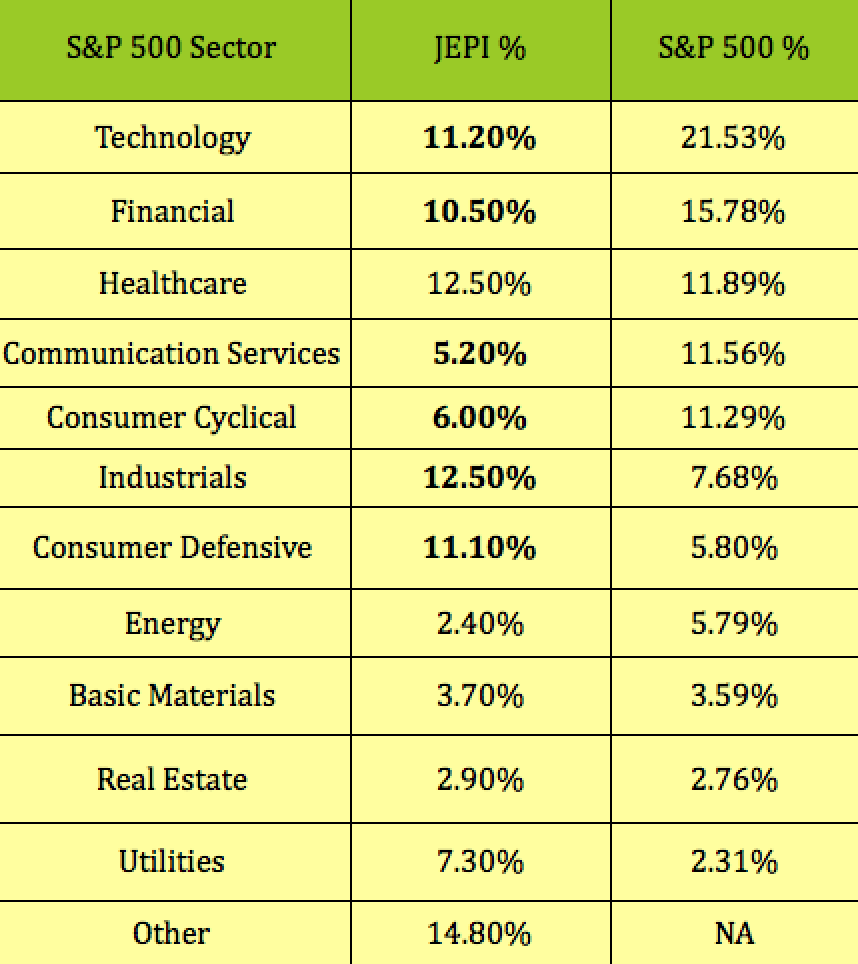
JEPI’s top holdings include some familiar large cap names, as you’d expect from its focus on the S&P 500.The 4 SPX holdings refer to the previously mentioned Equity-Linked Notes (ELNs), which JEPI utilizes for income:
Hidden Dividend Stocks Plus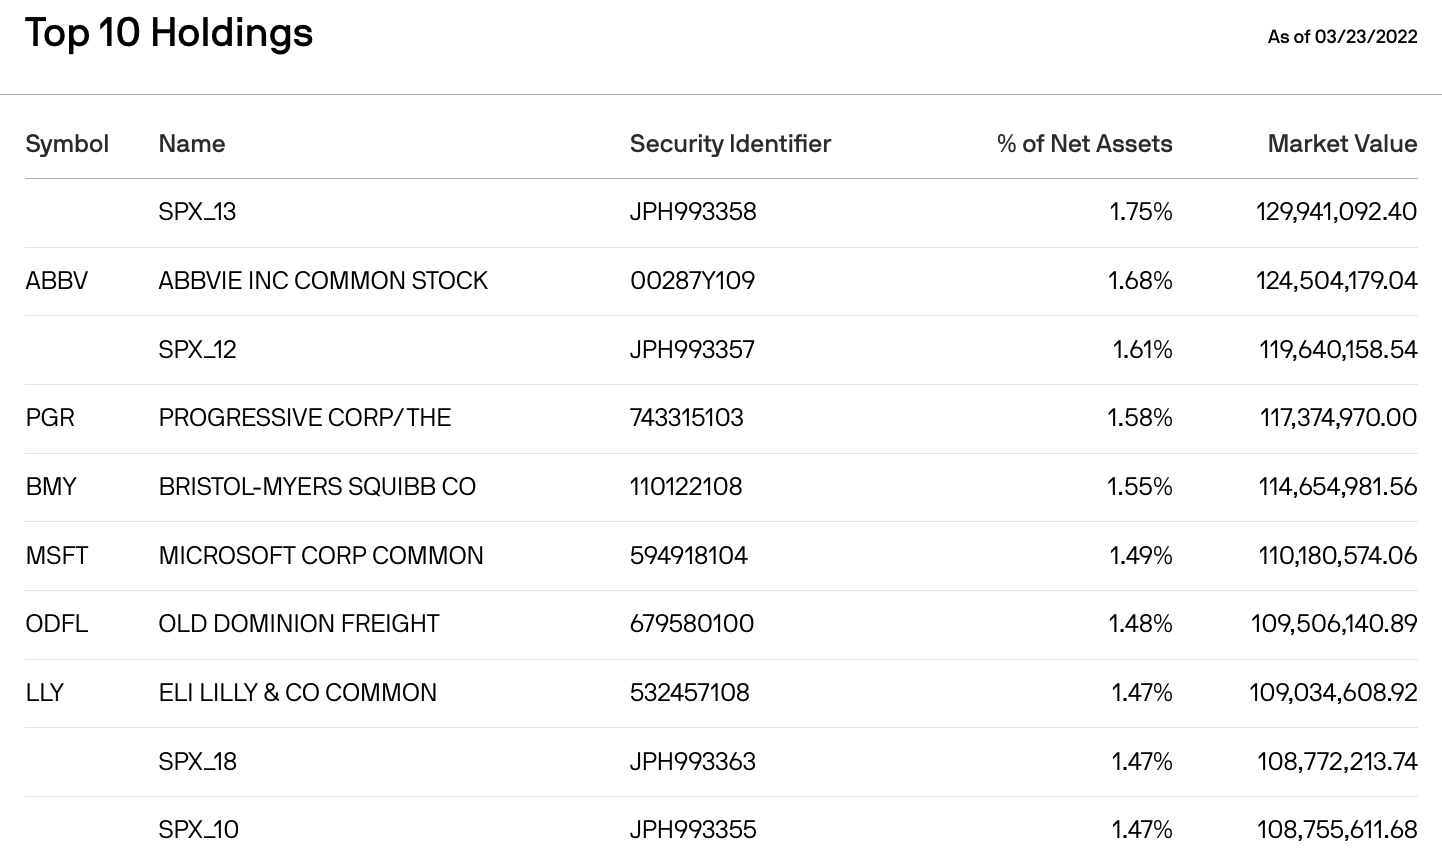
Distributions:
Since JEPI pays a variable monthly distribution, we looked at its dividend yield on a trailing and forward basis. Its current trailing dividend yield is 6.67%, with its forward yield being much higher, at 9.08%.
Hidden Dividend Stocks Plus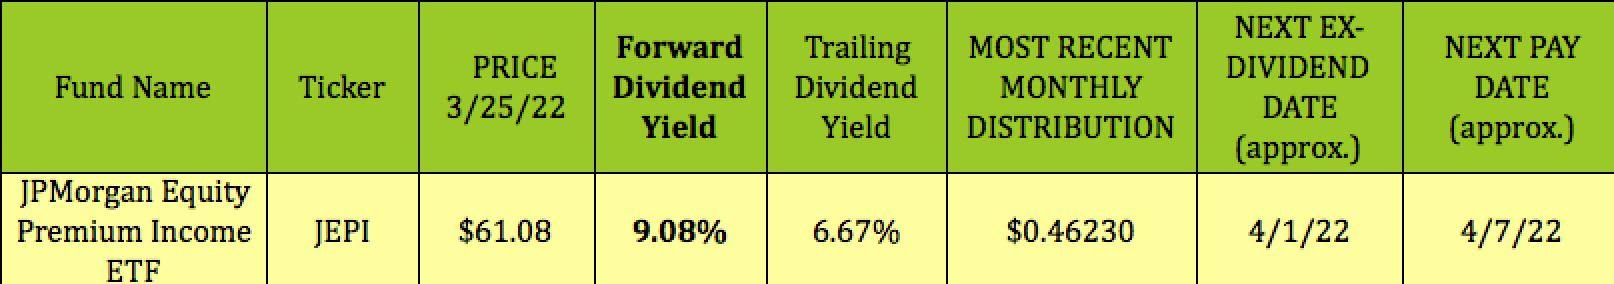
JEPI’s most recent monthly payout was $0.4623, the highest over the past 12 months, vs. $0.2572, its lowest, back in August 2021:
Hidden Dividend Stocks Plus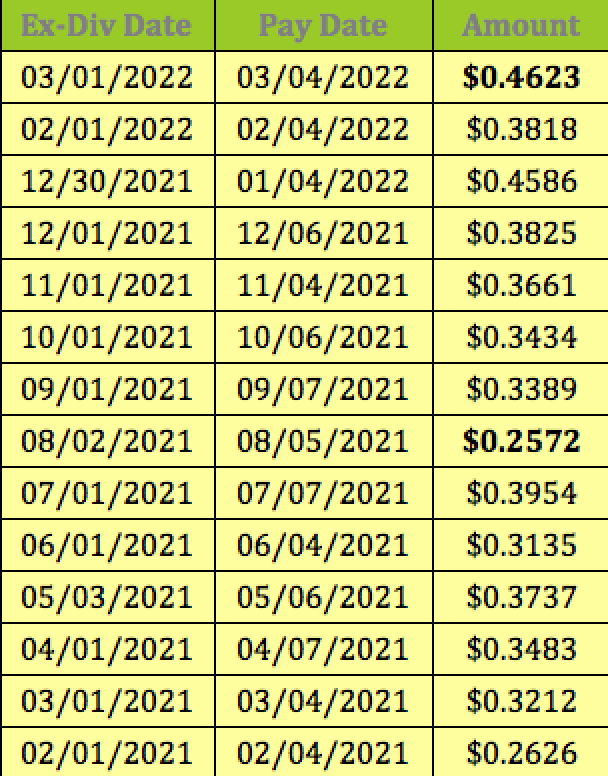
Alternatives:
In addition to JEPI, there are other S&P-oriented ETFs using covered calls, such as the Global X S&P 500 Covered Call ETF (XYLD), which invests at least 80% of its total assets in the securities of the underlying index, and seeks investment results that, before fees and expenses, generally correspond to the performance of the CBOE S&P 500 BuyWrite Index. It also pays monthly distributions.
If you’re looking to buy at a discount, another way to go is using CEFs, Closed End Funds, which can trade at premiums or discounts to NAV. The trick is to buy them at deeper discounts or lower premiums than their historical averages.
We found 4 S&P-based covered call CEFs, 2 of which pay monthly – the Eaton Vance Tax-Managed Buy-Write Income Fund (ETB), and the BlackRock Enhanced Capital and Income Fund (CII).The Nuveen S&P 500 Buy-Write Income Fund (BXMX), and the Nuveen S&P 500 Dynamic Overwrite Fund (SPXX), both pay quarterly.
Of the 4 CEFs, only ETB is trading at a premium to its NAV, 8.64%, while BXMX has the deepest discount, at -4.96%, followed by CII, at -2.51%, with SPXX being roughly even, at -0.33%.
Historically, ETB usually trades at a smaller premium – its 1-year average premium is 3.84%; its 3-year average is ~4%, and its 5-year is 3.15%.
BXMX’s current -4.96% discount to NAV is higher than its 1-, 3-, and 5-year discounts, while CII and SPXX historical discounts are deeper than their current ones.
Hidden Dividend Stocks Plus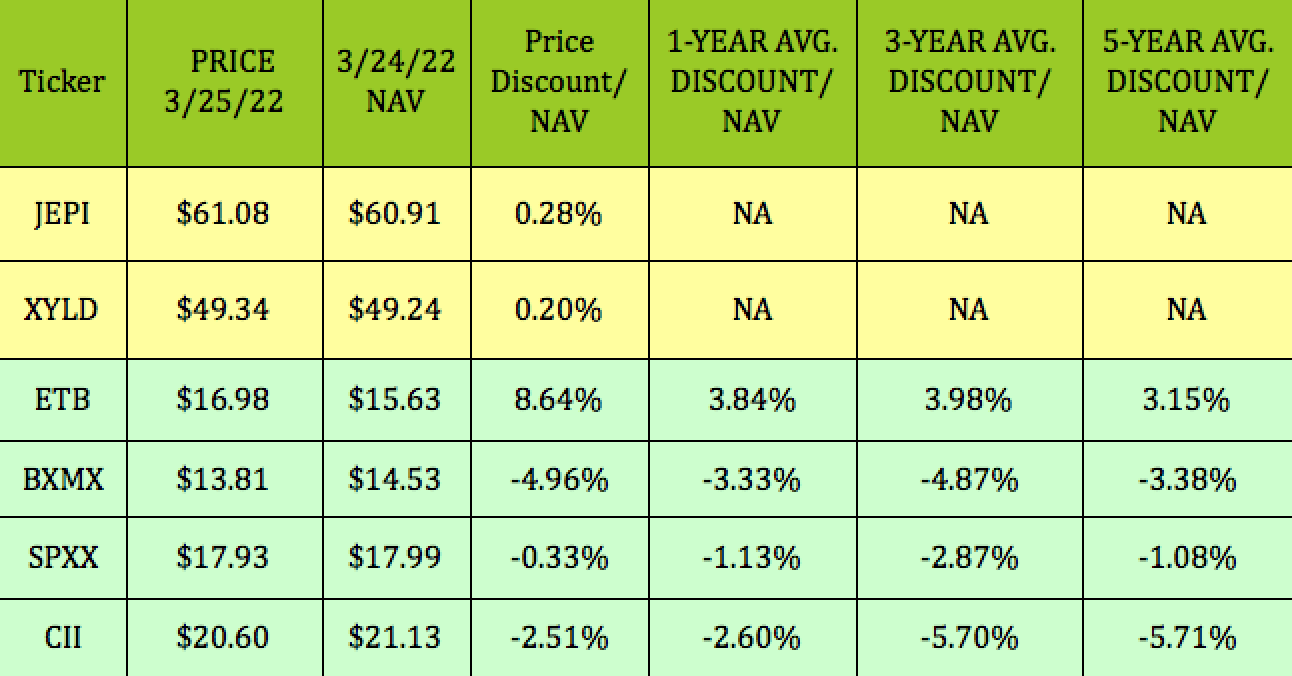
The CEFs tend to have steadier dividends than the ETFs, although BXMX and SPXX both raised their most recent payouts, as did JEPI and XYLD. XYLD has the highest forward and trailing yields in the group.
Hidden Dividend Stocks Plus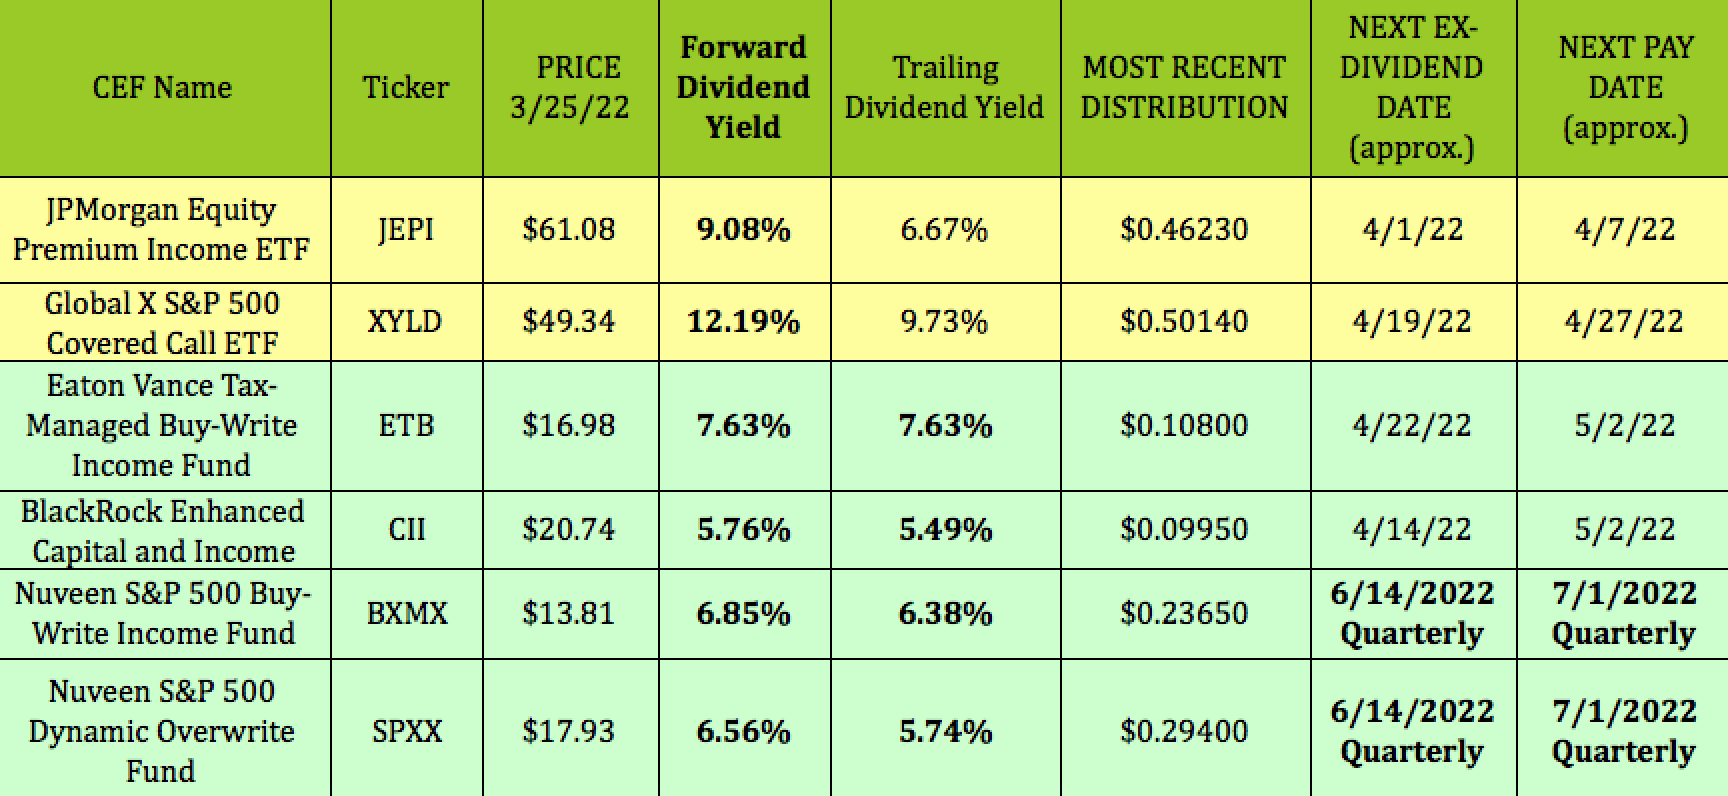
Performance:
While 4 of these funds, JEPI, ETB, XYLD, and SPXX, have outperformed the S&P 500 so far in 2022, the fund with the best record of outperformance over these periods is ETB.
Although ETB has lagged the S&P in price gains over the past year, if you also consider its 7.63% trailing yield, its total return of ~17% would be slightly higher than SPY’s ~16.85% total return.
ETB has also outperformed the S&P on a price basis over the past month, half year, and so far in 2022. That outperformance ties into ETB’s premium over its NAV, as detailed earlier in this article.
JEPI has a more mixed record. It has outperformed the S&P so far in 2022, but it’s still down -3.45%, while it has underperformed over the past year and half year. It’s up 4.59% over the past month though, a bit better than the S&P’s 3.69% gain.
Hidden Dividend Stocks Plus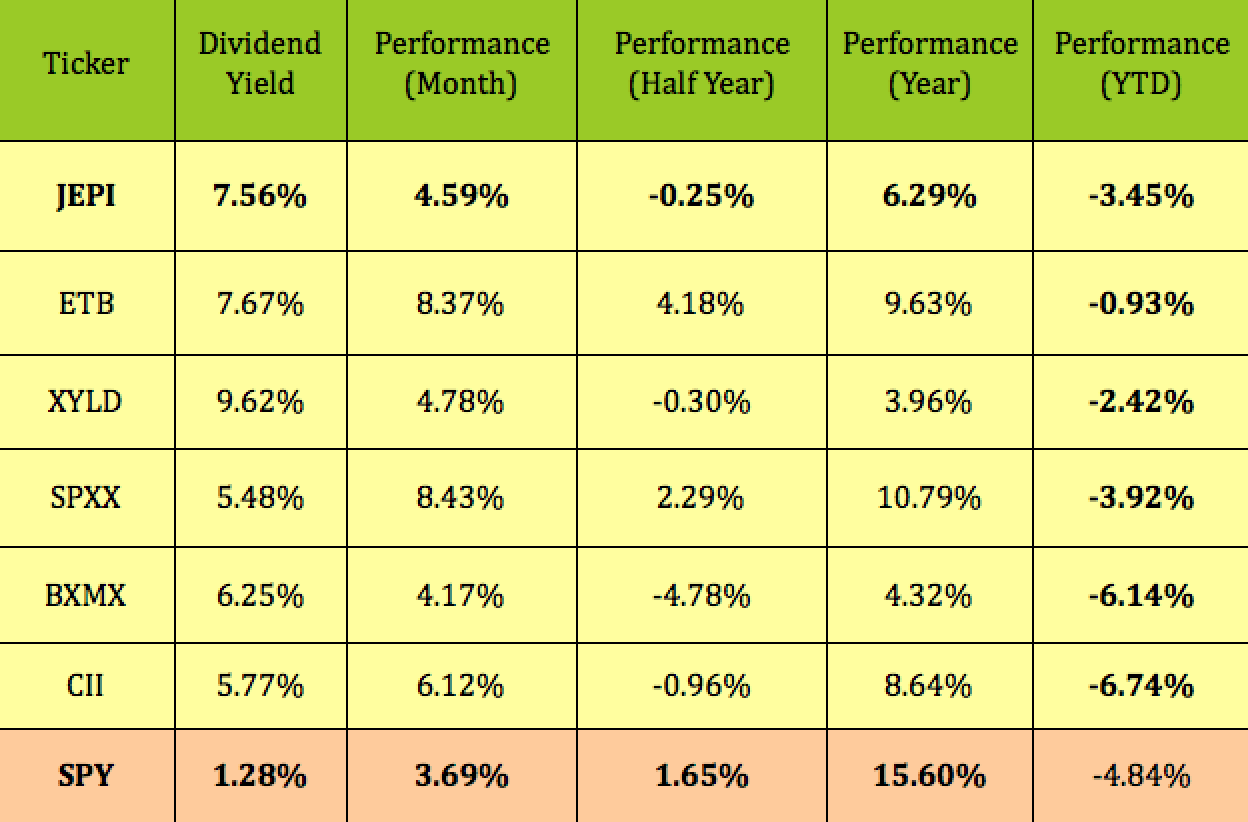
Looking back over the past 5 years, the Blackrock ETF, CII, has come closest to the S&P total return, based upon an initial $10K investment, while XYLD has the lowest figure in the group.
While ETB has done better than most of the other funds more recently, its 5-year total return is in the lower tier of the group. JEPI isn’t included in this chart, since it only began in May 2020.
YCharts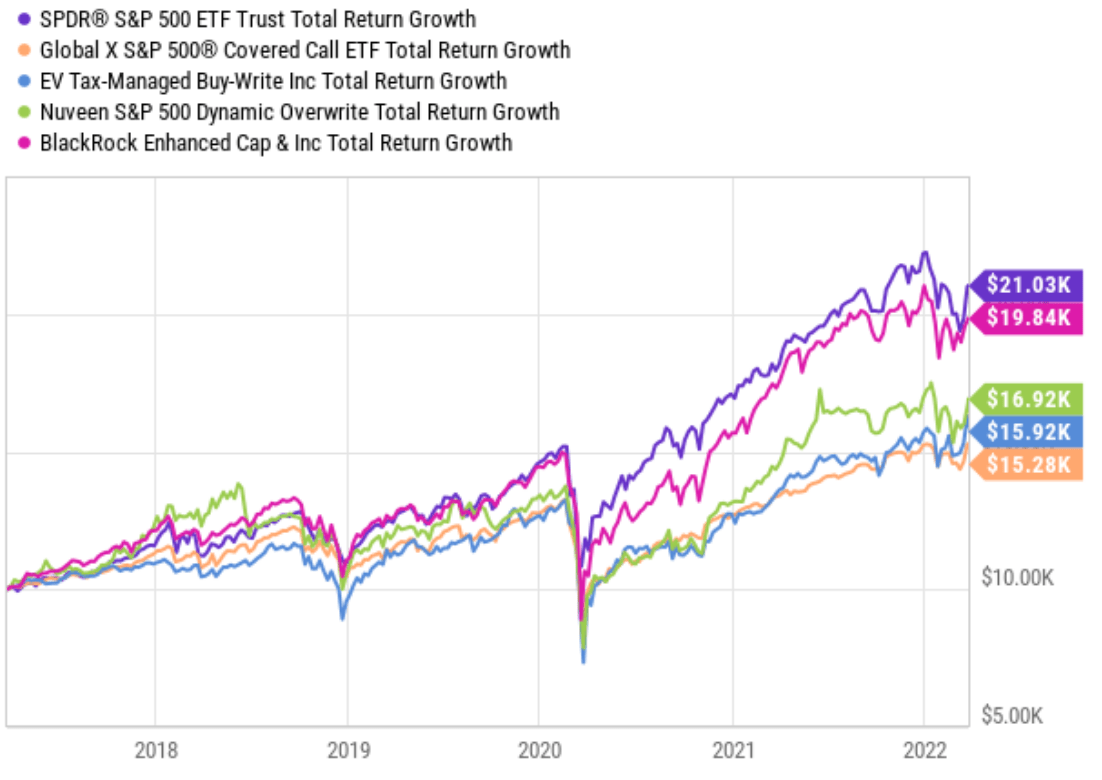
JEPI is by far the biggest fund in this group, with over $7B in assets, and 1.7M shares in average daily volume. Its 0.35% expense ratio is also the lowest. It has one of the lowest amount of holdings, at 113, vs. SPXX, which has 530 holding, and XYLD, which has 509. BCMX and SPXX pay quarterly, while the rest of the group pays monthly.
Hidden Dividend Stocks Plus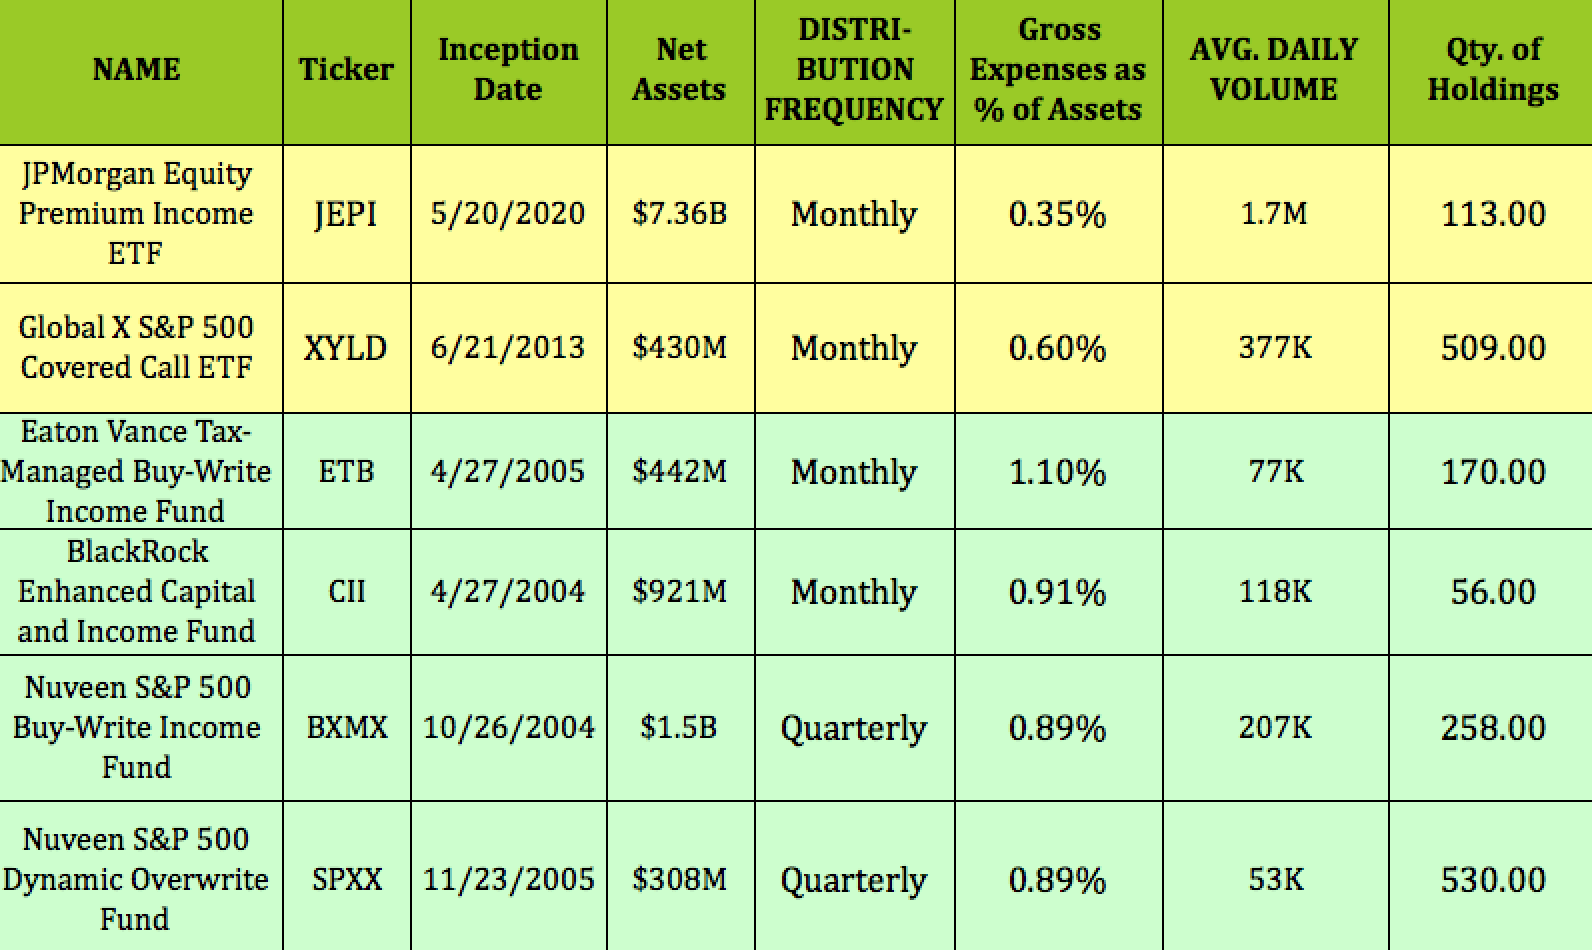
All tables by Hidden Dividend Stocks Plus, except where otherwise noted.
Be the first to comment