

S&P 500, HANG SENG INDEX, ASX 200 WEEKLY OUTLOOK:
- Dow Jones, S&P 500 and Nasdaq 100 indices closed -0.69%, -1.30% and -2.13% respectively
- Rising inflation strengthened the case for Fed tightening, weighing on the rate-sensitive tech sector
- Mainland China and Hong Kong are facing a severe wave of Covid-19 infections, which is casting a shadow over local stock markets
Ukraine war, Inflation, FOMC, Pandemic – Asia-Pacific Week-Ahead:
Wall Street equities pulled back broadly on Friday as investors mulled the Ukraine war and rising inflation around the world. All eleven S&P 500 sectors closed lower. Western sanctions against Russia for its invasion of Ukraine led to supply chain disruptions and fear about energy shortages, sending the price of crude oil, European natural gas, grain and metals to multi-year highs.
This may urge the Fed to tighten monetary policy more aggressively to contain rising price levels. Even before the Ukraine war, US inflation already hit 7.9% in February, the highest level since 1982. Economists now expect inflation to peak at 8-9% amid the jump in commodity prices in recent weeks. The risk of stagflation – an undesirable situation of slow economic growth and high inflation – is rising as corporates may struggle to maintain their profit margins amid wage pressures and rising raw materials costs.
This week’s FOMC meeting will be in the spotlight. The market has fully priced in a 25bps rate hike by the central bank at the two-day gathering. Investors will also scrutinize the Fed’s view about how the Ukraine war would impact its tightening roadmap. A more hawkish-biased tone may intensify selling pressure on the rate-sensitive technology sector, sending the Nasdaq 100 index lower.
In China, locally transmitted Covid-19 cases surged to more than 3,000 after topping 1000 for two days. This marks the most severe outbreak in the country since 2020, urging local governments to enforce social distancing measures and travel bans to contain the spread of the virus. In Hong Kong, some 300,000 Covid-19 patients and their close contacts are under home quarantine as the city reported 32,430 new cases on Sunday. The new pandemic wave may pressure an already slowing economyfurther, weighing on stock markets.
Hang Seng Tech Index – Daily
Chart created with TradingView
APAC markets look set to kick off the week on the back foot following a negative lead on Wall Street. Rising oil prices are a negative catalyst for Asia’s major oil importers, such as China, Japan, South Korea and India. Futures in Japan, Hong Kong, South Korea, Taiwan, Singapore, Malaysia and India are in the red, whereas those in mainland China, Australia and Thailand are in the green.
Chinese tech giants listed on US exchanges tumbled for a second day amid delisting fears. Tencent (-5.19%), Alibaba (-6.68%), NIO (-9,57%) and JD.COM (-8,63%) were among the hardest hit. This points to another bloodbath day for Hong Kong’s technology stocks. Hang Seng Index futures are down more than 2% before cash market open.
For the week ahead, the FOMC meetingdominates the economic docket alongside the BoE and BoJ interest rate decisions. US retail sales and the Australian jobs report are also in focus. Find out more from the DailyFX calendar.
Looking back to Thursday’s close, all 11 S&P 500 sectors ended lower, with 81.8% of the index’s constituents closing in the red. Communication services (-1.88%) and information technology (-1.80%) were among the worst performers, whereas utilities (-0.37%), financials (-0.72%) registered smaller losses.
S&P 500 Sector Performance 11-03-2022
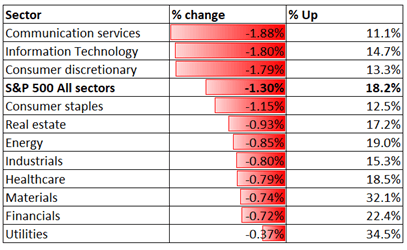
Source: Bloomberg, DailyFX
S&P 500 Index Technical Analysis
The S&P 500 index may have entered a meaningful correction after breaching below an “Ascending Channel” as highlighted on the chart below. Prices extended lower after the formation of a “Double Top” chart pattern, which is commonly viewed as a bearish trend-reversal indicator. An immediate support level can be found at around 4200, a Fibonacci extension. Breaching this level may open the door for further downside potential with an eye on 4100. The MACD indicator is trending lower beneath the neutral midpoint, suggesting that near-term selling pressure may be dominating.
S&P 500 Index – Daily Chart
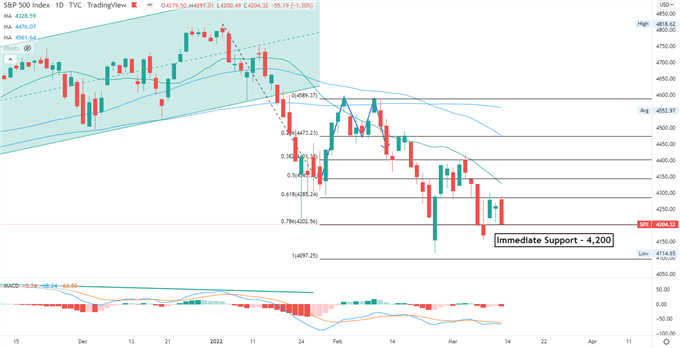
Chart created with TradingView
Hang Seng Index Technical Analysis:
The Hang Seng Index (HSI) breached below multiple support levels and extended lower, underscoring strong selling momentum. An immediate support level can be found at 20,830 – the 200% Fibonacci extension. Holding above this level may pave the way for a technical rebound. The MACD indicator dove deeply into negative territory, suggesting that prices may be severely oversold.
Hang Seng Index – Daily Chart
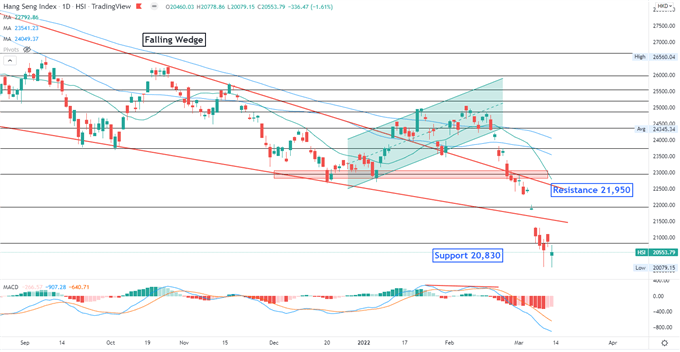
Chart created with TradingView
ASX 200 Index Technical Analysis:
The ASX 200 index is attempting to breach above the trendline resistance as shown on the chart below. A successful attempt may open the door for further upside potential with an eye on 7190, and then 7290. A reversal lower may intensify near-term selling pressure and bring an immediate support level of 6960 into focus. The MACD indicator is trending lower beneath the neutral midpoint, underscoring bearish momentum.
ASX 200 Index – Daily Chart
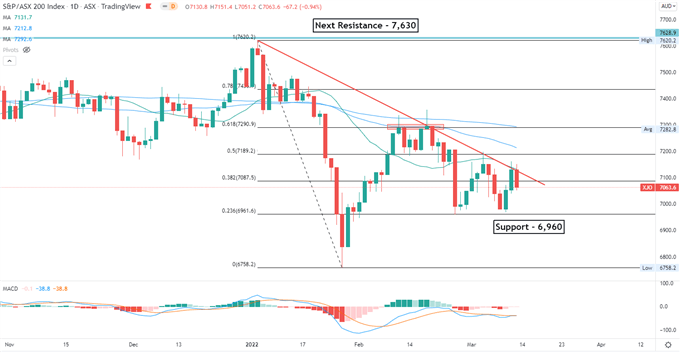
Chart created with TradingView
— Written by Margaret Yang, Strategist for DailyFX.com
To contact Margaret, use the Comments section below or @margaretyjy on Twitter
Be the first to comment