

ijeab
Economic earnings for the S&P 500 dropped quarter-over-quarter (QoQ) in 2Q22, a trend that began in 1Q22.
This report is an abridged version of S&P 500 Economic Earnings: WACC Is Still a Drag In 2Q22, one of our quarterly series on fundamental market and sector trends.
Economic earnings provide a more accurate picture of the true underlying cash flows of a business than GAAP earnings.
Economic Earnings Fall in 2Q22
Economic earnings for the S&P 500 fell from $908.4 billion in 1Q22 to $906.7 billion in 2Q22, while GAAP Earnings fell from $1.8 trillion to $1.7 trillion over the same time. Despite falling in the quarter, economic and GAAP earnings remain near their highest levels since 2004, which is the earliest our analysis is available.
A major headwind facing economic earnings is a rising WACC. Inflation boosts GAAP earnings, but these gains are erased in economic earnings by a higher cost of capital. Investors can protect themselves from such false signals by paying closer attention to economic earnings, which account for the effects of expected inflation on a firm’s WACC.
Key Details on Select S&P 500 Sectors
Eight of eleven S&P 500 sectors saw a QoQ decline in economic earnings.
The Energy sector saw the largest QoQ improvement, $47.5 billion, in economic earnings, which rose from $38.5 billion in 1Q22 to $86.0 billion in 2Q22.
The Technology sector generates the most economic earnings of any sector, but its economic earnings fell by 4% QoQ in 2Q22. On the flip side, the Utilities sector has the lowest economic earnings and was one of eight sectors to see a QoQ decline in economic earnings in 2Q22.
Below, we highlight the Healthcare sector, one of the sectors which saw economic earnings improve QoQ in 2Q22.
Sample Sector Analysis: Healthcare
Figure 1 shows economic earnings for the Healthcare sector, at $166.0 billion, rose 26% YoY in 2Q22, while GAAP earnings, at $228.0 billion, rose 41% over the same time.
Figure 1: Healthcare Economic Earnings Vs. GAAP: 2004 – 2Q22
S&P 500 Healthcare Sector Economic Earnings vs. GAAP Earnings 2Q22 (New Constructs, LLC)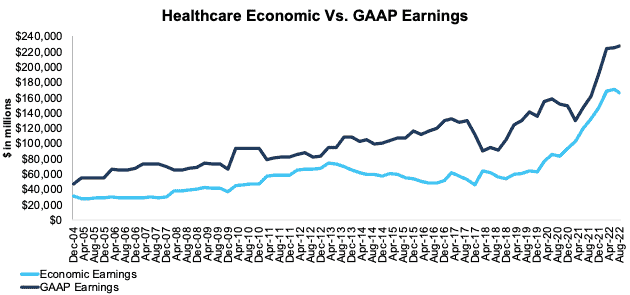
Sources: New Constructs, LLC and company filings. Our economic earnings analysis is based on aggregated TTM data for the sector constituents in each measurement period. The August 12, 2022 measurement period incorporates the financial data from calendar 2Q22 10-Q, as this is the earliest date for which all the calendar 2Q22 10-Qs for the S&P 500 constituents were available.
This article originally published on August 26, 2022.
Disclosure: David Trainer, Kyle Guske II, Matt Shuler, and Brian Pellegrini receive no compensation to write about any specific stock, style, or theme.
Appendix: Calculation Methodology
We derive the economic earnings and GAAP Earnings metrics above by summing the Trailing Twelve Month individual S&P 500 constituent values for economic earnings and GAAP Earnings in each sector for each measurement period. We call this approach the “Aggregate” methodology.
The Aggregate methodology provides a straightforward look at the entire sector, regardless of market cap or index weighting and matches how S&P Global (SPGI) calculates metrics for the S&P 500.
[1] This report is based on the latest audited financial data available, which is the 2Q22 10-Q in most cases. Price data as of 8/12/22.
Be the first to comment