

ijeab/iStock via Getty Images
The rise in the 10-year Treasury yield this week from 2.15% as of Friday, March 18, to 2.49% on Friday, 3/25 was very surprising. That’s a 34 bp increase on the week for the 10-year yield. Stocks didn’t seem to flinch.
If someone has already offered up the analogy, my apologies, but 2022 is looking a little like 2018 at least from the equity side of the equation. In 2018, January ’18 saw a sharp run-up in the stock market, which in many ways resembled the late 1990’s frenzied action, and then on or about January 31 ’18 the S&P 500 peaked and didn’t really bottom until early April. There was a tremendous spike in the VIX resulting in the collapse of one alts fund (here in Chicago) and it definitely put some fear and anxiety back in the stock market. The sharp equity drop was 5 quarters into the Fed and Janet Yellen raising the fed funds rate. With the April ’18 bottom, the S&P 500 didn’t peak again until the last week of September ’18, when that brutal 4th quarter correction started, ultimately accounting for an approximate 20% peak-to-trough correction in the S&P 500.
The point is that the Feb – March ’18 correction was the first warning sign or tremor that culminated in the Q4 ’18 correction. Are we seeing some of this again?
In 2022, the S&P 500 peak was the first week of January ’22 and then we saw the 4,114 S&P 500 tradeable low in late February ’22 and since early March we are now seeing a nice bounce in the indices.
Re-visiting the S&P 500 peak in late September ’19, the S&P 500 started to roll over from a “sequential rate of change” perspective which means that after Yellen’s almost 2 years of tightening or raising fed funds, investors saw a typical “earnings slowdown” correction.
One of the reasons this spreadsheet was created post-2018 was to track that rate-of-change data and here’s what the data shows as of 3/25/22:
Author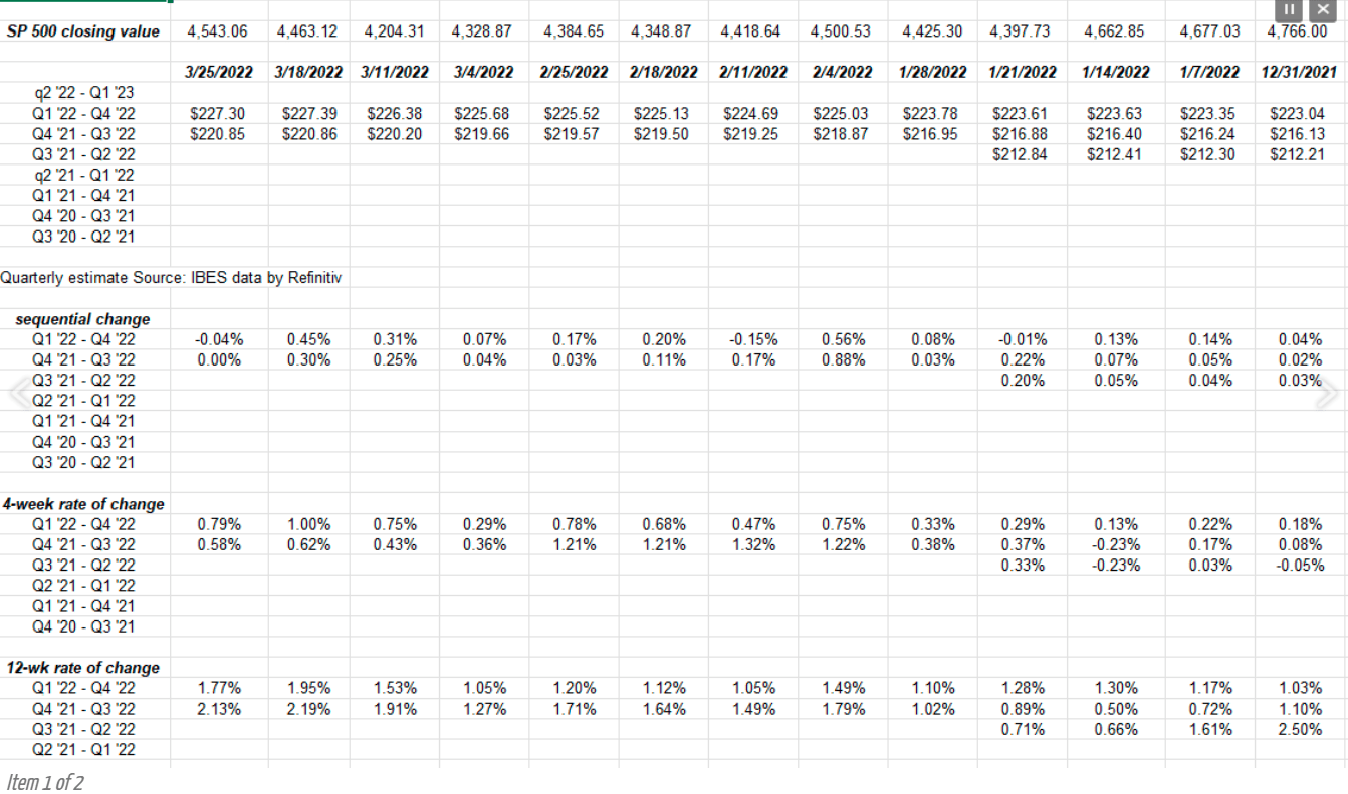
There is no yellow flashing light yet. Just three weeks out of the 11 so far in Q1 ’22, saw a sequential decline in the forward earnings data.
Q1 ’22 earnings will be enlightening for sure.
S&P 500 EPS revisions – number of “Up Revisions” trending lower
Author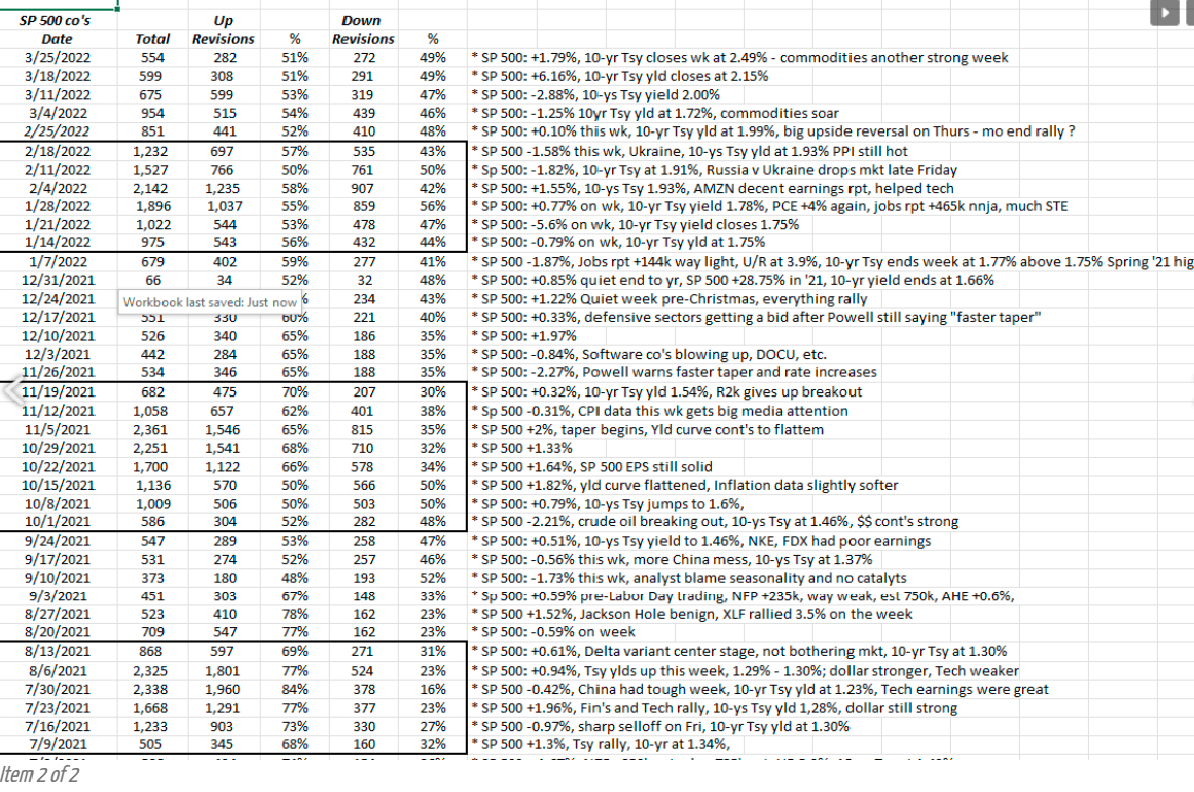
This table (data from IBES data by Refinitiv) is another home-grown spreadsheet and shows the last 3 quarters of S&P 500 and the number of “up revisions” versus the number of “down revisions”.
Readers can see the Q4 ’21 earnings results while still showing positive revisions are less “robust” than Q2 ’21 and Q3 ’21 earnings season. (Start at the bottom of the “up revisions” column and work your way higher.) This is one reason we pay attention to both the absolute dollar EPS and the revisions. Are analysts getting more tentative or is there a problem with forward earnings? Year-over-year growth rates will be lower in 2022 which has been known for a while, but with less upside in stocks, I also think analysts are probably hesitant to be aggressive with positive revisions to forward numbers.
Remember analysts are people too.
S&P 500 data:
- The forward 4-quarter estimate fell this week to $227.28 from last week’s $227.41.
- The P/E ratio on the forward estimate is 20x;
- The S&P 500 earnings yield fell sharply to 5% from 5.10% last week and 5.39% two weeks ago. For comparison, in December ’18, the S&P 500 hit 7% near the bottom for that Q4 ’18 correction.
- With just one week left in Q4 ’21 earnings, neither Q3 ’21 nor Q4 ’21’s bottom-up S&P 500 EPS estimate will exceed $55, which I thought it would. Both quarters will come in around $53 and change;
- The IBES data is still expecting 8.8% S&P 500 EPS growth for calendar 2022. We’ll know within the next few weeks as Q1 ’22 earnings start in 10 – 15 days;
Summary / conclusion: The jump in the 10-year Treasury yield got my attention this week, while the steady decline in positive revisions for the S&P 500 in the last 6 months was surprising as well. With revision data, the last month of the quarter is typically slower since analyst models are set from the first two months of the quarter, but it does appear “the Street”, as we call the sell-side brethren, is turning more cautious.
My own opinion is that we have a sharper correction ahead for the S&P 500, but whether that’s this week or the next quarter or by year-end is unknown.
The stat that keeps coming back to me is that a 1/3rd retrace of the pandemic lows in March ’20 to the early ’22 high for the S&P 500 is 3.800 on the S&P 500 or roughly 700 points lower. The financial media made a big deal of the 2-year anniversary of the pandemic low this week, noting that the S&P 500 is up 100% since.
Take any opinions as just that – an opinion – and know that capital markets can change quickly.
Thanks for reading.
Editor’s Note: The summary bullets for this article were chosen by Seeking Alpha editors.
Be the first to comment