


da-kuk/E+ via Getty Images
As of Friday, June 10th, 2022, the 60/40% balanced portfolio has returned -14.82% YTD, with the SPY declining -17.68%, and the Barclay’s Aggregate (AGG) falling -14.82%.
S&P 500 data:
- The S&P 500 EPS forward 4-quarter estimate rose again this week to $235.61 from last week’s $235.17, and is up from early January ’22’s $223;
- The P/E ratio on the forward estimate this week is 16.5x down from last week’s 17.5x and early January’s 21x;
- The S&P 500 earnings yield this week is back over 6% to 6.04%, up from 5.72% last week and early January’s 4.77%. There was a good Bloomberg article this week from one of the reporters saying that the S&P 500 earnings yield is now approaching the corporate investment-grade bond yield. The spread between the two apparently being the narrowest in some time. Readers can conclude or speculate on which has the bigger delta.
Since mid-April ’22, the S&P 500 EPS forward estimate has bounced back and forth between $233 and $235 and change, as the slope of the weekly improvement has flattened considerably. Looking at the y.y change of the “forward estimate”, the rate of change of the forward estimate as of Friday, June 10th, is 23% versus the mid-April ’22’s 33%. Now readers should be aware that this compares an estimate today, versus an estimate 52 weeks prior.
Using “4-quarter trailing S&P 500 EPS” which is calculated but rarely shown, the y.y growth as of Friday, June 10th is 9.5% versus early ’22’s 8%. The 4-quarter trailing EPS calculation includes the latest quarter’s earnings releases, which would be the Q1 ’22 financial reports. Some math-oriented readers might not agree with that, but to be looking at calendar 2021 EPS as of today (which would be the true 4-quarter trailing metric), would seem fairly worthless as a data point.
With Jamie Dimon’s “hurricane” comment and Elon Musk’s “super-bad feeling”, it caused me to wonder whether CEOs are the better macro forecasters or Wall Street gets it right. I think it depends. No question CEOs know their own companies far better than equity analysts or Wall Street strategists since they can watch the changes in revenue, EPS, and internal metrics like unit sales in real-time far better than outsiders. Thinking back on 2008, Jamie Dimon was throwing up red flags in the 2007 conference calls on individual debt leverage. Housing and autos typically lead us out of every recession, as I learned in my first job as an analyst with a small brokerage shop in Chicago. Does that mean housing and autos will turn down first too? Given the size of the purchases relative to the average household budget, you would think housing and autos would be decent leading indicators, but fiscal stimulus after 2020 put a lot of cash into the average American’s household bank account. Does that mean this time is different? Ryan Detrick recently addressed this here.
There is a pretty wide gap amongst the better-known market commentators too: per the last blog post, David Kelly of J.P. Morgan, Ed Yardeni, and Tom Lee remain somewhat sanguine on the US equity market, but the US bond market and the rise in yields is putting pressure on valuations. Ed Yardeni is a high-quality S&P 500 earnings analyst – he predicted the $120 low in S&P 500 EPS during the 2020 Covid meltdown almost exactly – and from what I read Ed hasn’t yet thought S&P 500 EPS would really meltdown.
Something has to give with the S&P 500 forward earnings and the price action: this dynamic cannot continue forever. The P/E on the S&P 500 will only compress for so long before we have either sharply negative EPS revisions in the S&P 500 or a substantial rally in the benchmark.
Having an unusual end to this last week, Bespoke published a table in their Bespoke Report showing “forward returns” after such an occurrence:
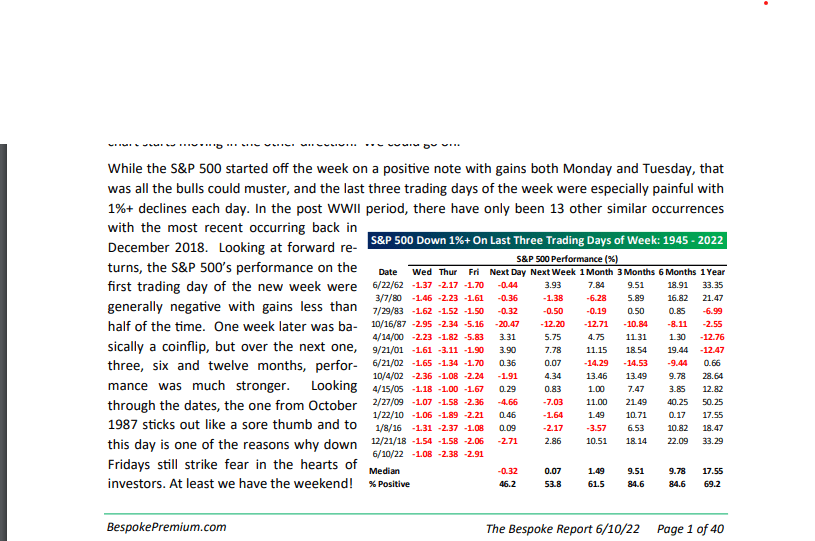
Look at the “median” historical returns near the bottom of the table: this data is bullish, BUT the interest rate issue makes this a very different time period.
Conclusion / summary: Given the hot CPI data last Friday morning, it’s difficult to come up with a scenario where Jay Powell can offer anything but tough rhetoric with the FOMC policy statement from this Wednesday, June 15th, 2022 meeting. That being said, it seems like this is built into prognosticators’ forecast for the rest of the year. Can the sentiment be any more bearish than it is right now for both higher interest rates and lower stock prices? The remarkable aspect to this is that – with the SPY being down 17% YTD as of Friday, June 10 – the S&P 500 is still well within the normal “correction” range.
If the 10-year Treasury yield trades above the May 9th, ’22, 3.16% – 3.17% high tick in yield, the next stop is the 3.24% – 3.25% highs from October ’18, which was the last tightening cycle prior to this one. The big difference is that in 2018, there wasn’t near the consumer inflation we’re seeing today.
From a sentiment perspective, I personally think gasoline and crude oil are a H-U-G-E issue, and it’s truly hard to find any energy bears or energy pessimists and the Wall Street sentiment around gas prices and crude seemed to get even more bullish this week. The energy sector is up 64% YTD, and yet it’s still just 5% of the S&P 500 by market cap.
Truly I don’t know what will happen this week, the rest of the month or through the summer, with the stock and bond markets, but many metrics like sentiment, and fear and bond yields have gotten very stretched. The only metric that’s hung in there is S&P 500 earnings, and it would behoove readers to assume that those could see lower revisions with the release of Q2 ’22 financial results starting mid-July ’22.
The Chinese internet stock ETF, KWEB, was down 27% YTD as of May 13th, ’22 but has improved to “just” down 13% YTD as of June 10 ’22. When the Chinese internet stocks are one of your safe haven trades (never owned here), you know it’s a tough market.
All eyes on Wednesday’s FOMC announcement and Jay Powell’s comments. So much talk after Friday’s CPI of a 75 bp hike on Wednesday. I think that would cause panic.
The 3,810 May 20th low for the S&P 500 is still intact.
None of this is a prediction or forecast. Past performance is no guarantee of future results. Evaluate your own risk and appetite for volatility.
Editor’s Note: The summary bullets for this article were chosen by Seeking Alpha editors.
Be the first to comment