


Daniel Balakov
Southern Company stock (NYSE:SO) is currently trading at 17% below the 12-month high closing price that it reached in mid-August of 2022. Even with this decline, SO’s total return over the past year is 4.1%, as compared to -5.7% for the S&P 500 (SPY) and 3.1% for the Utilities Select SPDR ETF (XLU), in which SO is the 3rd-largest holding.
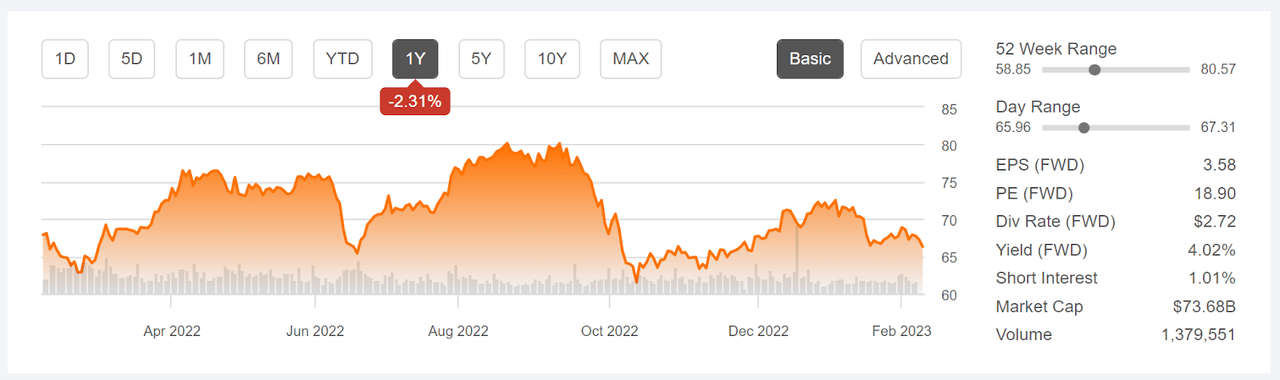
12-Month price history and basic statistics for SO (Seeking Alpha)
Utility stocks tend to appeal to income oriented investors, and SO is no exception. The forward dividend yield is 4.02%, with trailing 3-, 5-, and 10-year dividend growth rates of 3.2%, 3.3%, and 3.4% per year, respectively. It is notable that SO has increased the dividend for 21 consecutive years. With the forward yield and a reasonable expectation of dividend growth being maintained at around 3%, the Gordon Growth Model indicates that expected total return of 7% per year is reasonable. For context, SO’s annualized 10- and 15-year annualized total returns are 7.6% and 7.1% per year, respectively.
While SO’s historical performance may not seem especially impressive at first glance, things look different when we account for the stock’s low beta. Over the past 3 years (through December of 2022) SO has annualized alpha of 4.75% per year using a 3-factor Fama-French model and 5.8% per year using the CAPM model. For comparison, XLU has a 3-factor alpha of 2.26% and CAPM alpha of 2.77% per year. These alphas are not just a recent phenomenon. SO has 10-year 3-factor and CAPM alphas of 5.01% and 6.27% per year, respectively.
The sell-off in SO in Q4 was likely exacerbated by SO’s earnings miss for Q3, reported on October 27th. SO reports Q4 2022 results on February 16, 2023. The consensus estimate for EPS is $0.24 per share, low even compared to Q4 in recent years. ETrade calculates that the consensus estimate for full-year EPS for 2023 is $3.64 per share, as compared to $3.58 for 2022. The consensus estimate for EPS growth over the next 3 to 5 years is 5.4% per year.
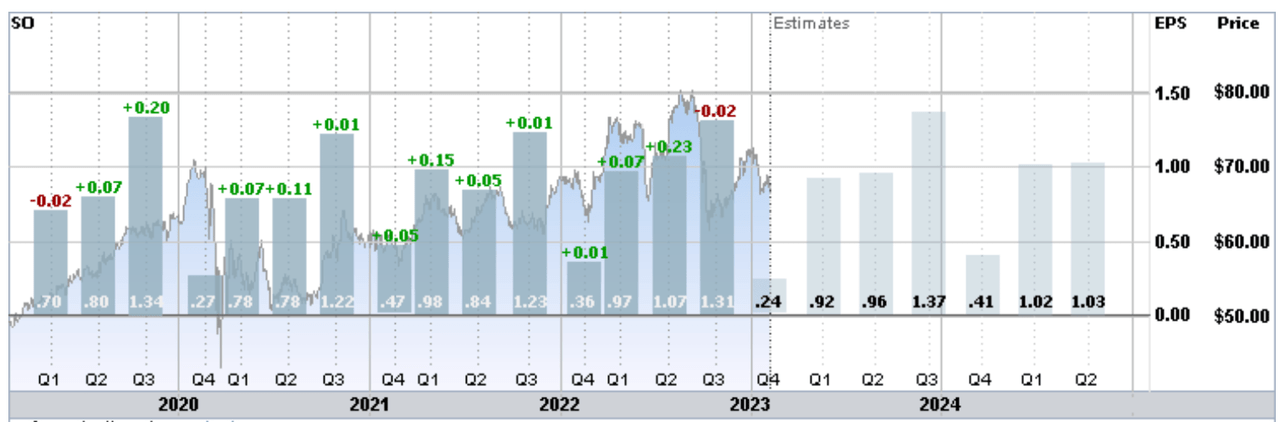
Trailing (4 years) and estimated future quarterly EPS for SO. Green (red) values are amounts by which EPS beat (missed) the consensus expected value (ETrade)
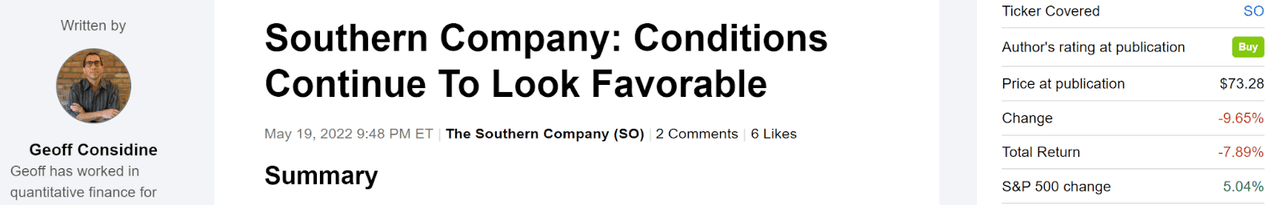
I last wrote about SO on May 19, 2022, a little over 8 months ago, and I reiterated a buy rating. At the time, the Wall Street consensus rating was a hold, with consensus 12-month price target that corresponded to expected total return of 6.7% (including dividends), not much below the 10- to 15-year annualized returns. The market-implied outlook, a probabilistic price forecast that represents the consensus view from the options market, was bullish for the 8-month period to January 20, 2022, with expected volatility of 26% (annualized).
Previous post on SO and subsequent performance vs. the S&P 500 (Seeking Alpha)
In this post, I discussed a covered call strategy with SO that looked attractive. SO was trading at $72.67 and the bid price (the price buyers are paying) for a call option with a strike of $75, expiring on January 19, 2023, was $4.30. Buying SO and selling this call option, provided option premium yield of 5.9% ($4.30 / $72.67) in addition to 1.87% in dividend yield for total income of 7.8% over the 8-month period to January 19, 2023. When the options expired on January 19th, SO was trading at about $66.50, so the call options expired worthless. The total return from buying the shares and selling the covered calls is -2% from May 19th until today.
For readers who are unfamiliar with the market-implied outlook, a brief explanation is needed. The price of an option on a stock reflects the market’s consensus estimate of the probability that the stock price will rise above (call option) or fall below (put option) a specific level (the option strike price) between now and when the option expires. By analyzing the prices of call and put options at a range of strike prices, all with the same expiration date, it is possible to calculate the probable price forecast that reconciles the options prices. This is the market-implied outlook. For a deeper discussion than is provided here and in the previous link, I recommend this outstanding monograph published by the CFA Institute.
As we approach the Q4 report, I have calculated updated market-implied outlooks for SO and I have compared these with the current Wall Street consensus outlook in revisiting my rating.
Wall Street Consensus Outlook for SO
Seeking Alpha calculates the Wall Street consensus outlook for SO by combining the views of 17 analysts who have published ratings and price targets over the past 90 days. The consensus rating is a hold, as it has been for almost all of the past year. The consensus 12-month price target is 7.95% above the current share price, for an expected total return of 11.97% over the next year.
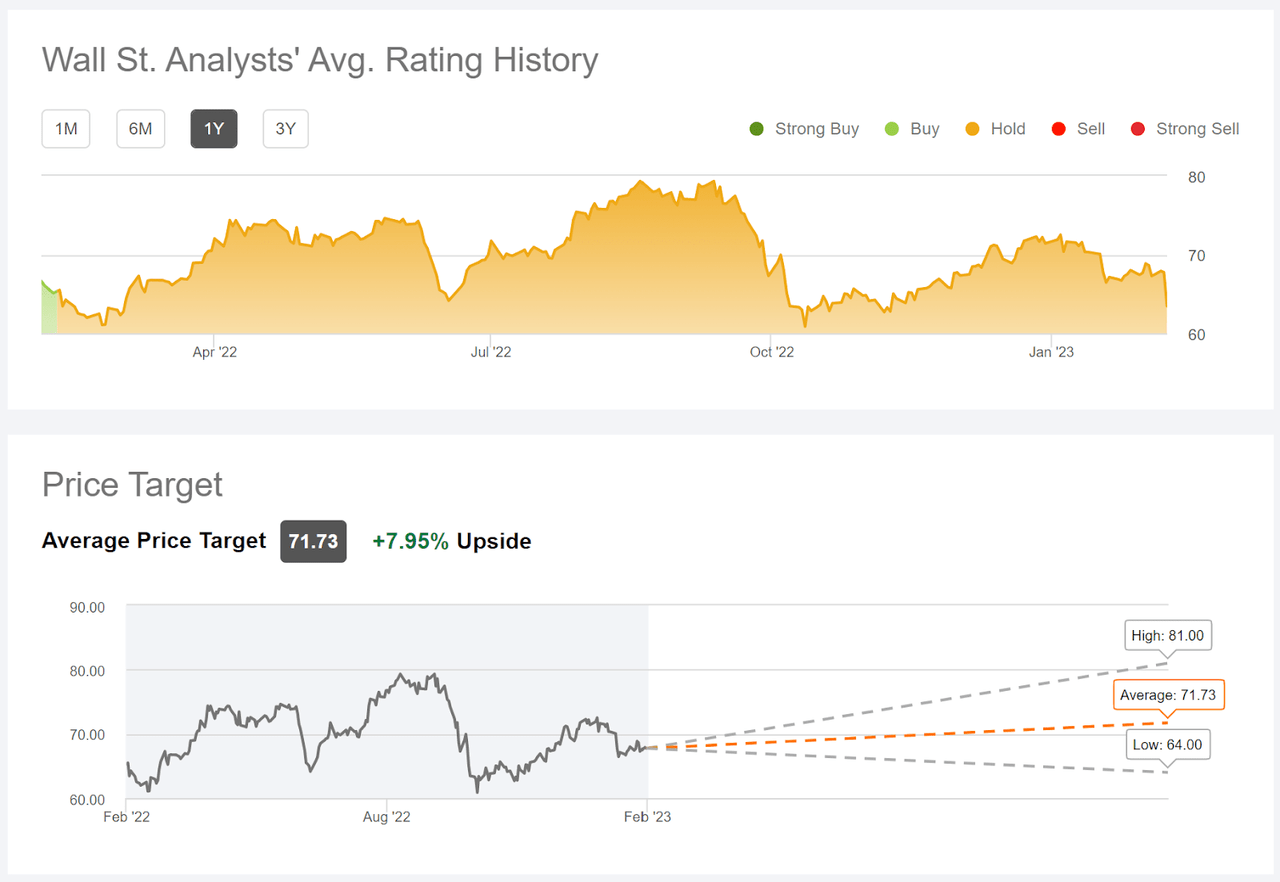
Wall Street analyst consensus rating and 12-month price target for SO (Seeking Alpha)
The median 12-month total return for SO over the past 30 years is 11.2% per year and the average 12-month total return is 12.7%, so the consensus price target is well within the range of historical returns.
Market-Implied Outlook for SO
I have calculated the market-implied outlook for SO for the 11.3-month period from now until January 19, 2024, using the prices of call and put options that expire on this date. I selected this specific expiration date to provide a view through the rest of 2023.
The standard presentation of the market-implied outlook is a probability distribution of price return, with probability on the vertical axis and return on the horizontal.
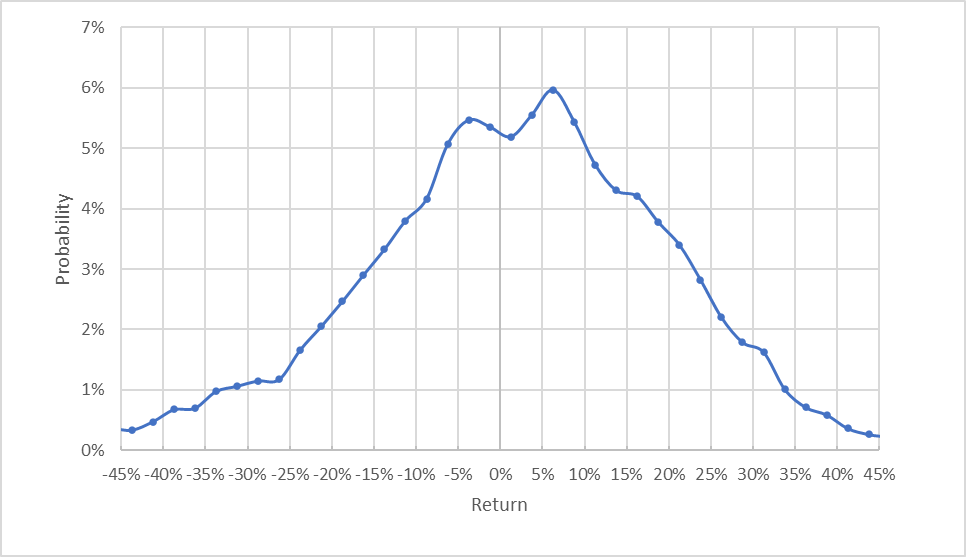
Market-implied price return probabilities for SO for the 11.3-month period from now until January 19, 2024 (Author’s calculations using options quotes from ETrade)
The market-implied outlook to mid-January of 2024 exhibits comparable probabilities of positive and negative returns of the same magnitude, although the probabilities are tilted to favor positive returns. The maximum probability corresponds to a price return of 6.25%. The expected volatility calculated from this distribution is 21% (annualized), lower than the 26% value from my May analysis. For comparison, ETrade calculates a 20% implied volatility for the options expiring on January 19, 2024.
To make it easier to compare the relative probabilities of positive and negative returns, I rotate the negative return side of the distribution about the vertical axis (see chart below).
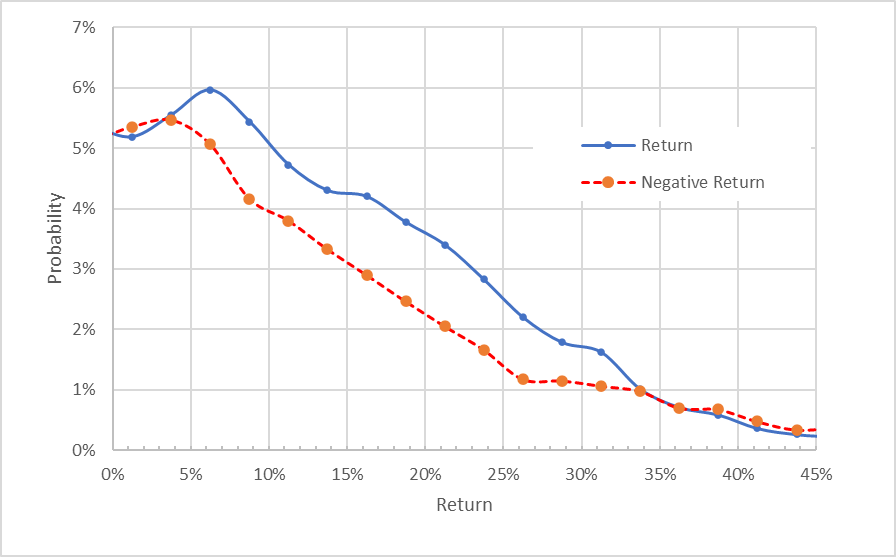
Market-implied price return probabilities for SO for the 11.3-month period from now until January 19, 2024. The negative return side of the distribution has been rotated about the vertical axis (Author’s calculations using options quotes from ETrade)
This view clearly shows that the probabilities of positive returns are consistently higher than those of negative returns of the same size, across a wide range of the most-probable outcomes (the solid blue line is above the dashed red line over the left ⅔ of the chart above). This is a bullish market-implied outlook.
Theory indicates that the market-implied outlook is expected to have a negative bias because investors, in aggregate, are risk-averse and thus tend to pay more than fair value for downside protection. There is no way to measure the magnitude of this bias, or whether it is even present, however. The expectation of a negative bias reinforces the bullish interpretation of this outlook.
Income investors and others who want low-risk equity positions may want to consider selling covered calls against SO. As I have been writing this post, I bought SO for $66.23 per share and sold call options with a strike price of $67.50 and a January 19, 2024 expiration date for $4.42. This net position has an option premium yield of 6.67% ($4.42 / $66.23) and an expected dividend yield of 3.08% (3 out of 4 annual dividend payments) for the 11.3-month period. This position retains only 1.9% of potential price appreciation, but provides a total income of 9.75% (option premium plus dividends). If SO rises by 7.95% (the Wall Street consensus price target), this covered call position will have a gain of 8.59% (1.9% price appreciation plus 6.67% option premium yield), in addition to the dividends. If SO declines between now and January 19, 2024, the option premium will help to offset the loss.
Summary
Southern Company provides what I refer to as portfolio ballast, providing a stabilizing influence. Over the past year, with both broad equity and bond indexes falling, an allocation to SO was especially helpful. Over the long term, low beta stocks provide higher returns than would be expected based on their market risk exposure. The Wall Street consensus rating for SO is a hold, as it has been for about 12 months, and the consensus 12-month price target maps to expected total return of almost 12%. As a rule of thumb for a buy rating, I look for an expected total return that is at least ½ the expected volatility (21% from the market-implied outlook and 20% from ETrade’s implied volatility calculation). Taking the Wall Street consensus price target at face value, SO meets this criterion. The market-implied outlook to mid-January of 2024 is bullish. I am maintaining a buy rating on SO.
Be the first to comment