

Rand ZAR Analysis:
- US Fed’s hawkish surprise deepens USD/ZAR pullback
- USD/ZAR technical set-ups and levels to watch
- SA introduces stricter lockdown regulations to limit rising third wave
Fed Committee Revises Expectations on Timing of Interest Rate Hikes
Yesterday, Jerome Powell communicated that there would be no change to the Fed funds rate and that the committee will decide on a meeting-by-meeting basis whether or not to taper its $120 billion per month asset purchase programme.
Powell expressed that labor market data looked strong, apart from those sectors hardest hit by the pandemic, which bodes well for one of the Federal Reserve’s objectives of maximum sustainable employment.
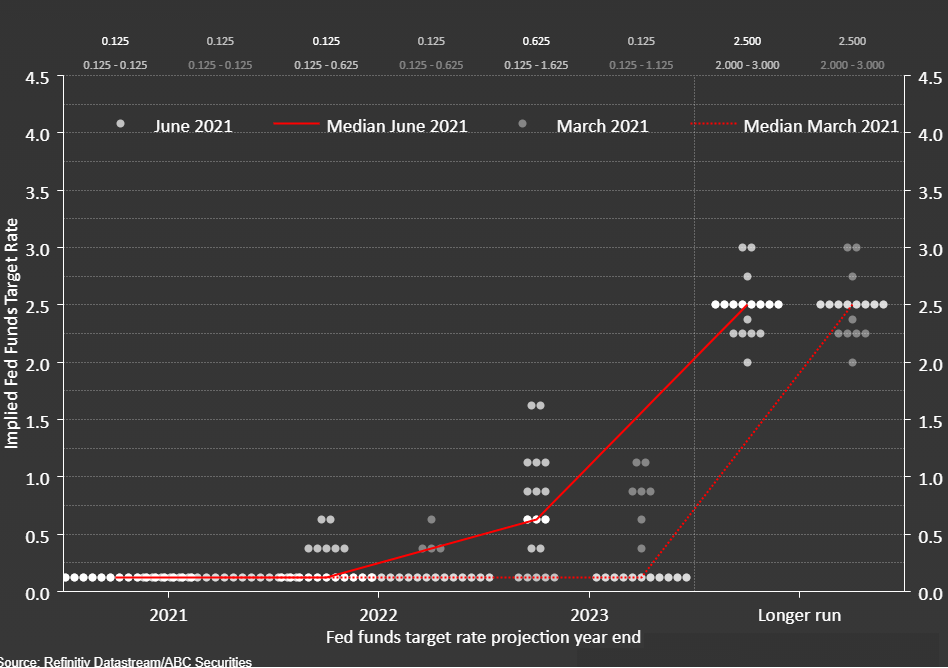
However, the most telling information coming out of the two-day meeting was the Fed dot plot. The dot plot, while not a commitment, presents expectations of when FOMC members foresee the need for potential future interest rate adjustments. The previous version showed only 6 members anticipating a rise in interest rates in 2023 compared to yesterday’s updated version showing that not only had the figure risen to 13, but also that the median FOMC member expected two rate hikes in 2023.
Image: Fed Dot Plot
Source: Refinitiv
USD/ZAR Key Technical Levels
The South African Rand has put in a strong performance against the dollar and other majors like the Euro and the Pound Sterling ever since marking the 2020 high. However, last week looks to have marked a new low for the pair as USD/ZAR continues to rise off the back of a much stronger dollar – the result of yesterday’s FOMC meeting.
A close in the weekly candle above the crucial psychological level of 14.00 may suggest a continuation of trading back within the broad trading range between 14.00 and 15.70, a range that was prominent towards the end of 2018 and most of 2019.
Weekly USD/ZAR Chart
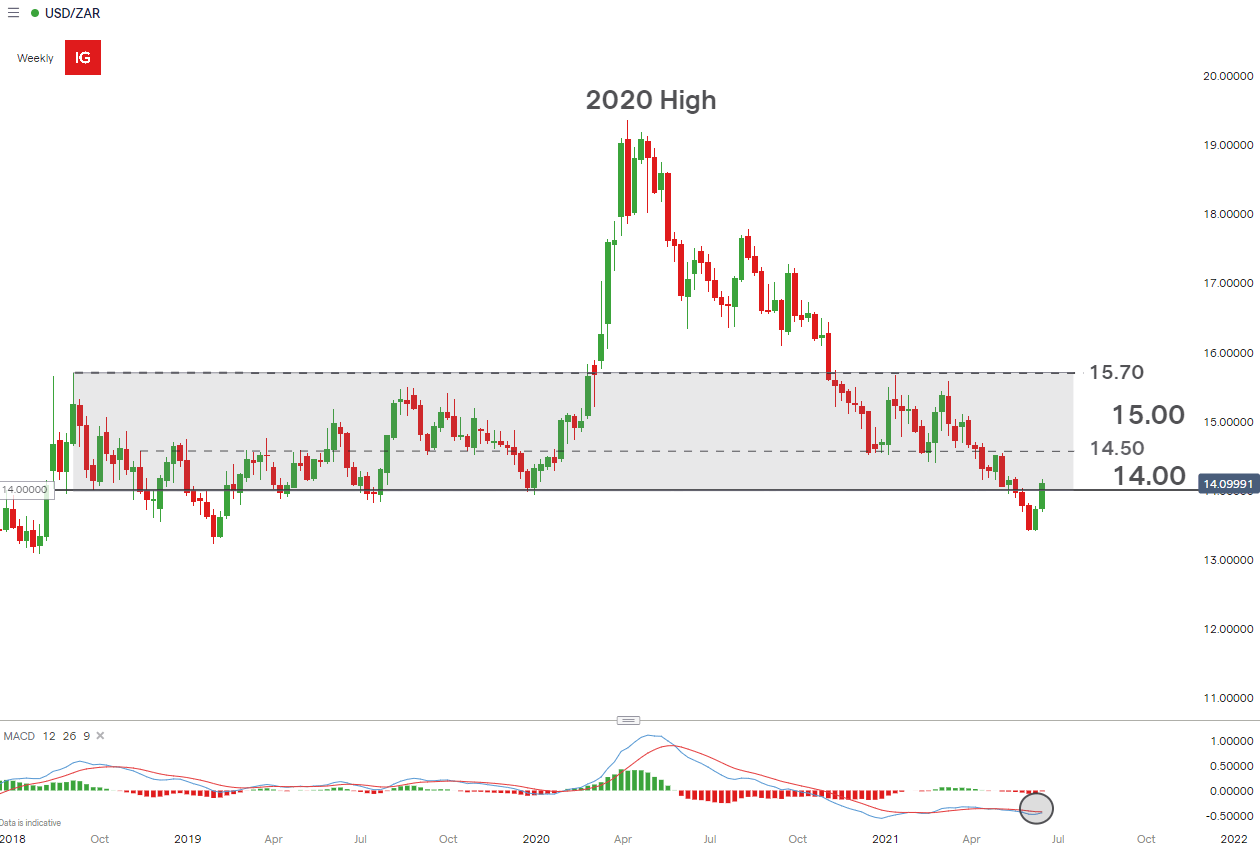
Chart prepared by Richard Snow, IG
Taking a look at the daily chart we see a clear advance above resistance at the 13.80 level, and a break above the previously mentioned 14.00 mark. While 14.14 is the next immediate level of resistance, a pullback towards 14.00 may be the starting point of a second attempt to overcome the 14.14 hurdle, If dollar strength is to continue. Other zones of resistance include the descending trendline followed by the 14.50 level.
14.00 remains the nearest level of support given its historical significance and a break down of this level would bring the 13.80 back into focus.
Daily USD/ZAR Chart
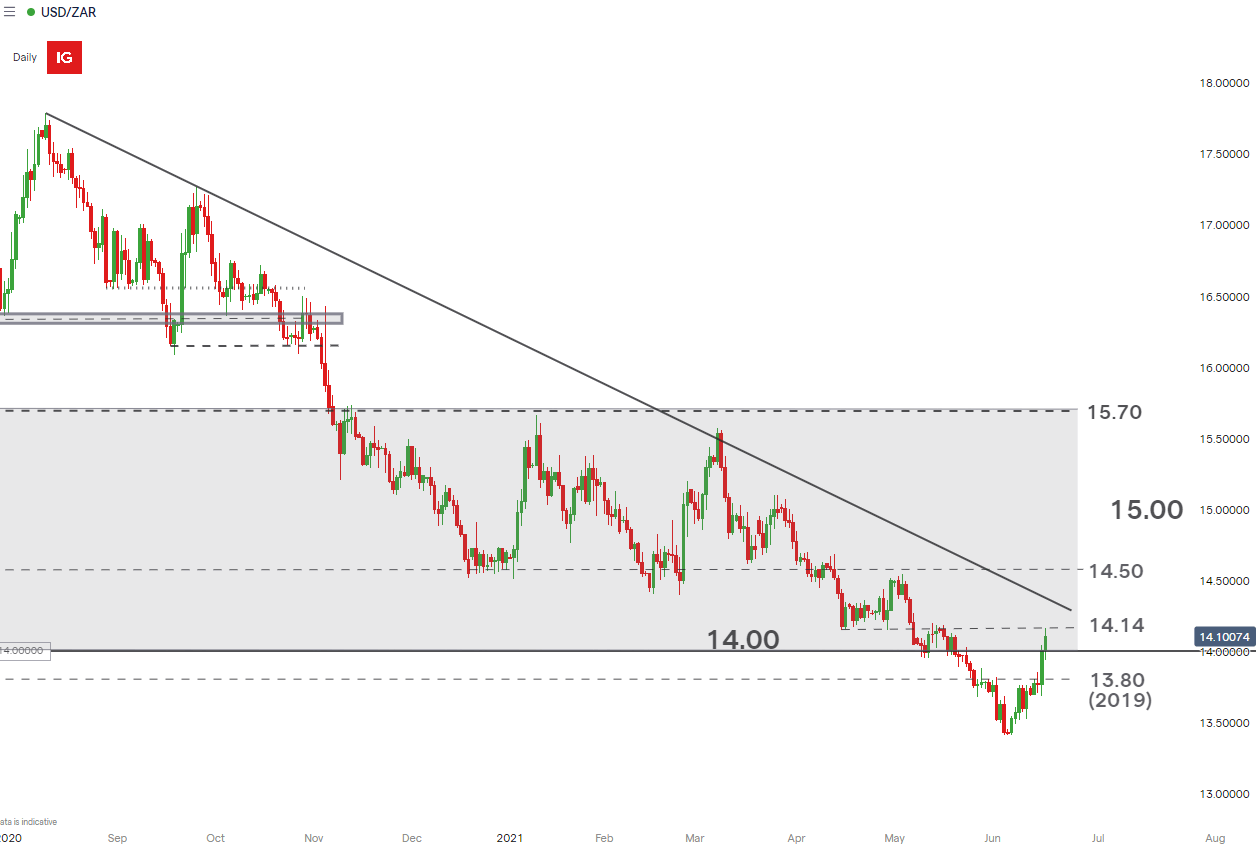
Chart prepared by Richard Snow, IG
Stricter Lockdown Measure to Contain Covid Third Wave
On Tuesday the 15th of June, President Cyril announced a more to lockdown level 3. One of the restrictions seeks to limit the number of people allowed indoors and in open space areas. Additionally, the curfew has been brought forward to 10pm with non-essential establishments such as bars and restaurants to close at 9pm, which is likely to affect trade in the sector.
— Written by Richard Snow for DailyFX.com
Contact and follow Richard on Twitter: @RichardSnowFX
Be the first to comment