

Thurtell
A Quick Take On Nextracker Inc.
Nextracker Inc. (NXT) has filed to raise an undisclosed amount in an IPO of its Class A common stock, according to an S-1 registration statement.
The firm provides solar tracking systems to commercial and utility-scale solar power installations.
NXT has grown revenue, operating profit and cash flow in its most recent reporting period.
I’ll provide an update when we learn more IPO details from management.
Nextracker Overview
Fremont, California-based Nextracker Inc. was founded in 2013 to develop and sell solar system tracking equipment and related software worldwide.
Management is headed by founder and CEO Dan Shugar, who has been with the firm since its inception in 2013 and was previously CEO of Solaria Corporation, a solar panel manufacturing company.
The company’s primary offerings include:
-
Single-axis solar tracking system
-
System software
-
Design and supply chain services
As of September 30, 2022, Nextracker has booked fair market value investment of $603 million from parent firm of Singapore-based Flex Ltd. and its investor syndicate includes private equity firm TPG.
Nextracker – Customer Acquisition
The company sells its single-axis tracking systems to commercial and utility operators seeking renewable energy sources for their electrification and decarbonization purposes.
Solar energy is the fastest-growing sector within the renewable energy industry, as the cost of solar energy production has dropped sharply in the last decade.
Selling, G&A expenses as a percentage of total revenue have trended lower as revenues have increased, as the figures below indicate:
|
Selling, G&A |
Expenses vs. Revenue |
|
Period |
Percentage |
|
Six Mos. Ended September 30, 2022 |
4.2% |
|
FYE March 31, 2022 |
4.6% |
|
FYE March 31, 2021 |
5.1% |
(Source – SEC)
The Selling, G&A efficiency multiple, defined as how many dollars of additional new revenue are generated by each dollar of Selling, G&A spend, rose to 5.2x in the most recent reporting period, as shown in the table below:
|
Selling, G&A |
Efficiency Rate |
|
Period |
Multiple |
|
Six Mos. Ended September 30, 2022 |
5.2 |
|
FYE March 31, 2022 |
3.9 |
(Source – SEC)
Nextracker’s Market & Competition
According to a 2020 market research report by Fortune Business Insights, the global market for solar trackers was an estimated $9.3 billion in 2019 and is expected to exceed $22 billion by 2027.
This represents a forecast CAGR of 12.6% from 2020 to 2027.
The main drivers for this expected growth are a continued effort by countries to reduce their carbon emissions through increasing renewable energy sources.
Also, recent history has seen a reduction in activity due to the COVID-19 pandemic’s effects on supply chains. However, below is a chart indicating the historical and projected growth rate of the solar tracker market in North America:
N. America Solar Tracker Market (Fortune Business Insights)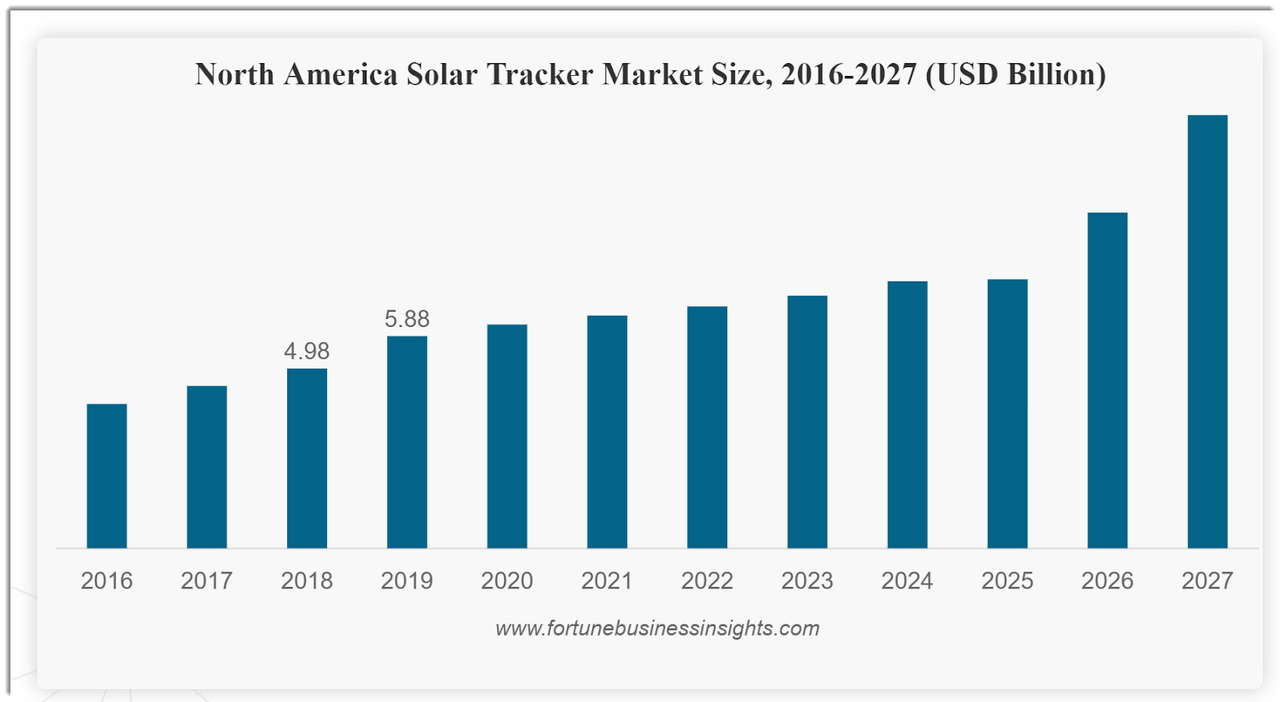
Major competitive or other industry participants include:
Nextracker Inc. Financial Performance
The company’s recent financial results can be summarized as follows:
-
Growing topline revenue
-
Variable gross profit and gross margin
-
Uneven operating profit
-
Fluctuating cash flow from operations
Below are relevant financial results derived from the firm’s registration statement:
|
Total Revenue |
||
|
Period |
Total Revenue |
% Variance vs. Prior |
|
Six Mos. Ended September 30, 2022 |
$ 870,372,000 |
28.0% |
|
FYE March 31, 2022 |
$ 1,457,592,000 |
21.9% |
|
FYE March 31, 2021 |
$ 1,195,617,000 |
|
|
Gross Profit (Loss) |
||
|
Period |
Gross Profit (Loss) |
% Variance vs. Prior |
|
Six Mos. Ended September 30, 2022 |
$ 114,402,000 |
53.9% |
|
FYE March 31, 2022 |
$ 147,031,000 |
-36.6% |
|
FYE March 31, 2021 |
$ 231,981,000 |
|
|
Gross Margin |
||
|
Period |
Gross Margin |
|
|
Six Mos. Ended September 30, 2022 |
13.14% |
|
|
FYE March 31, 2022 |
10.09% |
|
|
FYE March 31, 2021 |
19.40% |
|
|
Operating Profit (Loss) |
||
|
Period |
Operating Profit (Loss) |
Operating Margin |
|
Six Mos. Ended September 30, 2022 |
$ 69,241,000 |
8.0% |
|
FYE March 31, 2022 |
$ 65,907,000 |
4.5% |
|
FYE March 31, 2021 |
$ 158,531,000 |
13.3% |
|
Net Income (Loss) |
||
|
Period |
Net Income (Loss) |
Net Margin |
|
Six Mos. Ended September 30, 2022 |
$ 51,217,000 |
5.9% |
|
FYE March 31, 2022 |
$ 50,913,000 |
5.8% |
|
FYE March 31, 2021 |
$ 124,348,000 |
14.3% |
|
Cash Flow From Operations |
||
|
Period |
Cash Flow From Operations |
|
|
Six Mos. Ended September 30, 2022 |
$ 52,461,000 |
|
|
FYE March 31, 2022 |
$ (14,711,300) |
|
|
FYE March 31, 2021 |
$ 94,273,000 |
|
(Source – SEC)
As of September 30, 2022, Nextracker had $84.2 million in cash and $684.7 million in total liabilities.
Free cash flow during the twelve months ended September 30, 2022, was $65.1 million.
Nextracker’s IPO Details
Nextracker intends to raise an undisclosed amount in gross proceeds from an IPO of its Class A common stock.
Class A and Class B common stockholders will be entitled to one vote per share but Class B shareholders will not be entitled to economic rights.
The S&P 500 Index no longer admits firms with multiple classes of stock into its index.
No existing shareholders have indicated an interest in purchasing shares at the IPO price.
Management says it will use the net proceeds from the IPO as follows:
We will use all of the net proceeds from this offering to purchase [an as-yet undisclosed amount of] LLC Common Units from Yuma (or [an as-yet undisclosed amount of] LLC Common Units if the underwriters exercise in full their option to purchase additional shares of Class A common stock) at a price per unit equal to the initial public offering price per share of Class A common stock in this offering less the underwriting discount. We will not retain any of the net proceeds of this offering.
(Source – SEC)
Management’s presentation of the company roadshow is not available.
Regarding outstanding legal proceedings, management says there are no legal proceedings against the company that it believes would have a material adverse effect on its financial condition or operations.
The listed bookrunners of the IPO are J.P. Morgan, BofA Securities and several other investment banks.
Commentary About Nextracker’s IPO
NXT is seeking to tap U.S. public capital markets to purchase shareholder interests.
The company’s financials have produced increasing topline revenue, fluctuating gross profit and gross margin, variable operating profit and uneven cash flow from operations.
Free cash flow for the twelve months ended September 30, 2022, was $65.1 million.
Selling, G&A expenses as a percentage of total revenue have fallen as revenue has grown; its Selling, G&A efficiency multiple rose to 5.2x in the most recent six-month period.
The firm currently plans to pay a $175 million dividend prior to the IPO to existing investors but does not foresee paying dividends ‘for the foreseeable future’ on Class A stock.
NXT’s trailing twelve-month CapEx Ratio was 18.2, which indicates it has spent lightly on capital expenditures as a percentage of its operating cash flow.
The market opportunity for utility-scale solar equipment is large and expected to grow at a double-digit rate of growth in the coming years, so the firm has strong industry growth dynamics in its favor.
J.P. Morgan is the lead underwriter and IPOs led by the firm over the last 12-month period have generated an average return of 5.1% since their IPO. This is a mid-tier performance for all major underwriters during the period.
Risks to the company’s outlook as a public company include regulatory changes in the areas in which it operates, potentially reducing government subsidies, and supply chain bottlenecks.
The solar tracking industry is still fragmented, and direct competitor FTC Solar has performed poorly since its IPO in April 2021.
When we learn more about the IPO from management, I’ll provide a final opinion.
Expected IPO Pricing Date: To be announced.
Be the first to comment