


ipopba
Introduction
SoFi Technologies, Inc. (NASDAQ:SOFI), is a tech company that primarily focuses on digital financial products for consumers. Lately, much of the euphoria around the SOFI story has been centered around the prospects of the lending segment. This is perfectly understandable, given the potential uplift that student loan refinance volumes could see, once the moratorium period comes to an end by Jan 2023 (In Q1-20, student loan originations were around the $2.1bn mark, whereas in Q2-22 it had slumped to less than $0.4bn).
Besides, SOFI has also been extracting good value from its national bank charter and growing its low-cost deposit funding sources (it took them three years to gain $1bn of deposits, but just three months to gain another $1.6bn, once they got the charter), which in turn, gives it a solid foundation to grow its Net Interest Margins (NIM), in a rising rate environment.
In this article, I will seek to cover two other sub-plots which could prove to be instrumental factors.
What SoFi Stock Catalysts Should You Watch For?
Are Investors Underestimating The Impact of Technisys?
Currently, investors may not be devoting too much attention to Sofi’s tech platform offerings, as adjusted revenue from this division is currently less than a third of what the Lending segment brings to the table. Nonetheless, don’t forget that in addition to its core objective of being a one-stop digital consumer finance platform, SOFI also has parallel ambitions of ending up as the AWS (Amazon Webservices) of the broad fintech universe. To facilitate that, it took yet another step earlier this year by spending $1.1bn to acquire banking-software maker Technisys, whose operating terrain primarily lies in the Latin American region.
When SOFI first acquired Technisys, the management suggested that this business could potentially add $500-800m of cumulative revenue through 2025 (including revenue synergies with Galileo). However, I suspect one could be underestimating the appetite for a Galileo/Technisys behemoth in the marketplace, considering the dearth of competing alternatives that can offer an end-to-end enterprise payment tech package, that looks beyond just traditional payments (cheque/paper-based payments), and also inculcates the requisite infrastructure for digital payments or virtual cards. Earlier with just Galileo, Sofi did not quite have the requisite chops to go pitch their offering to non-B2B financial entities, in the US; the Technisys acquisition has ameliorated that deficiency. All in all, I don’t believe investors have factored in the potential of the tech platform to garner big contract wins, and I suspect this could be a dominant feature of SOFI’s public announcements going forward.
Do also consider that in Q2, where we had the first full quarter impact of Technisys, it was this business (46% growth) that primarily drove the tech platform’s overall revenue growth (85% growth). What’s also interesting about Technisys is that quite unlike Galileo which bills clients on a transaction basis, Technisys follows a Software as a Service model, which as we know can be very useful in growing overall margins.
Let’s also not play down the significant level of cost savings that Technisys could engender for SOFI over the next few years (management thinks it could be $75-$85m over the next three years followed by $60-$70m p.a. thereafter) as it brings things in-house, and moves all its previously different cores (individual cores for credit cards, checking and savings, lending, etc.) into just one multiproduct core.
Can The SOFI Stock Defend The sub-$4.8 Levels?
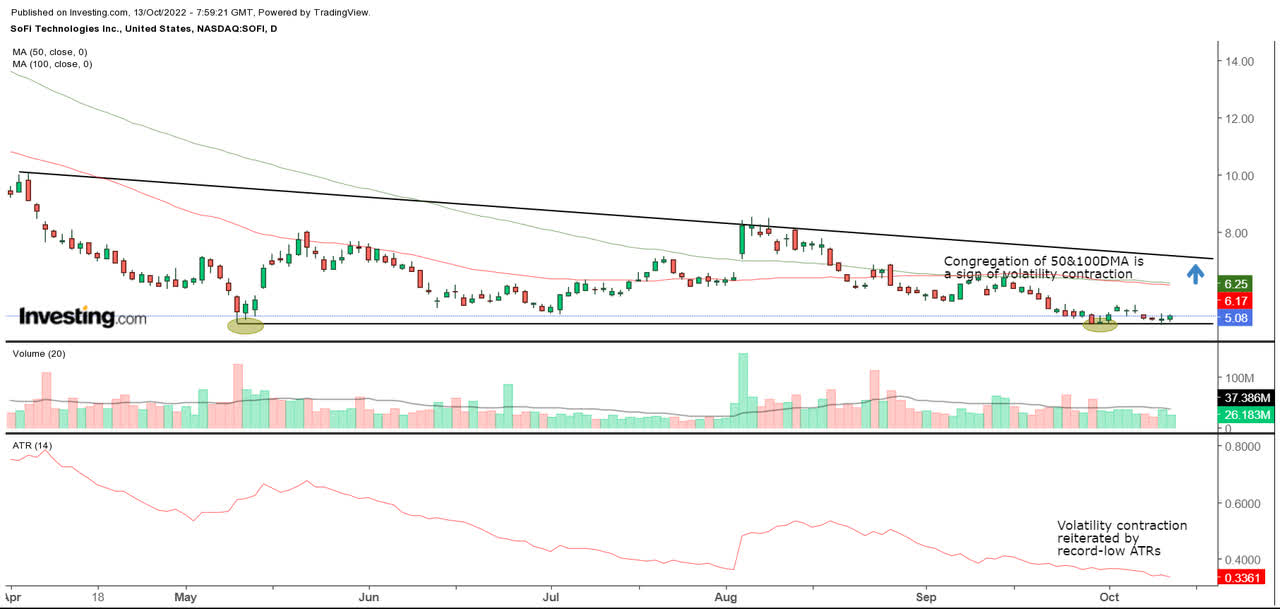
During the initial phase of its listing journey, Sofi’s stock was perceived to be quite a volatile play, but that narrative seems to have fizzled out in recent months; after a steep downtrend since November 2021, what we’re now witnessing is a period of volatility contraction, as exemplified by the congregation of two key moving averages- the 50DMA (red band), and the 200DMA (green band) which were previously quite wide apart.
Investing
Volatility contraction is further substantiated by the collapse of the 14-day ATR (average true range) indicator, which is currently at its lowest level of less than $0.35. Volatility contraction in stocks typically happens before large moves take place.
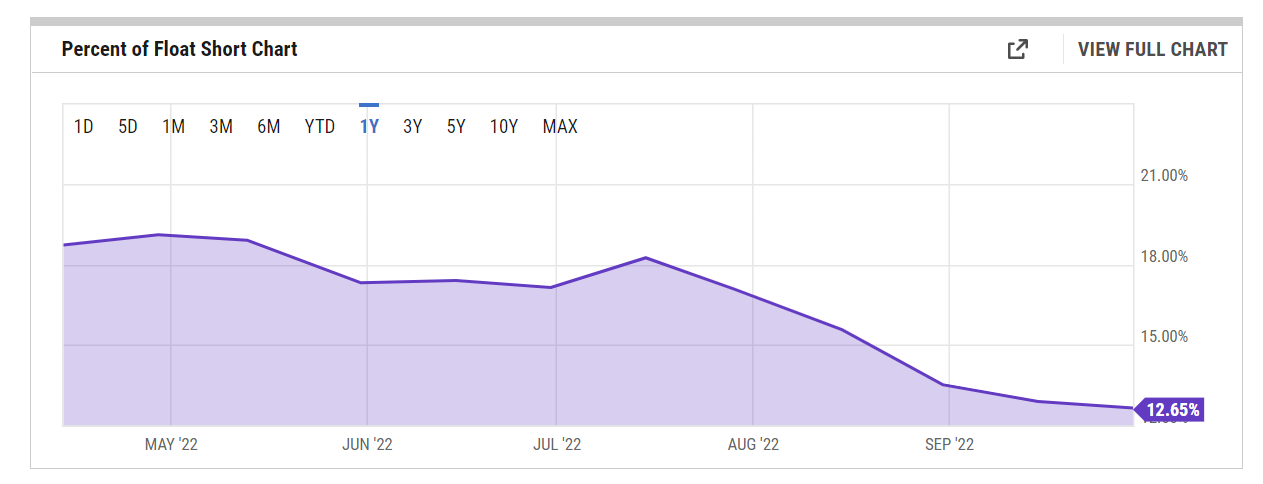
You would think the onus is on the bulls as it appears as though short-selling momentum has been easing off; note that from levels of well over 18% in mid-July, the percent of SOFI’s float that is short has been declining bi-monthly and is currently only at 12.6%.
YCharts
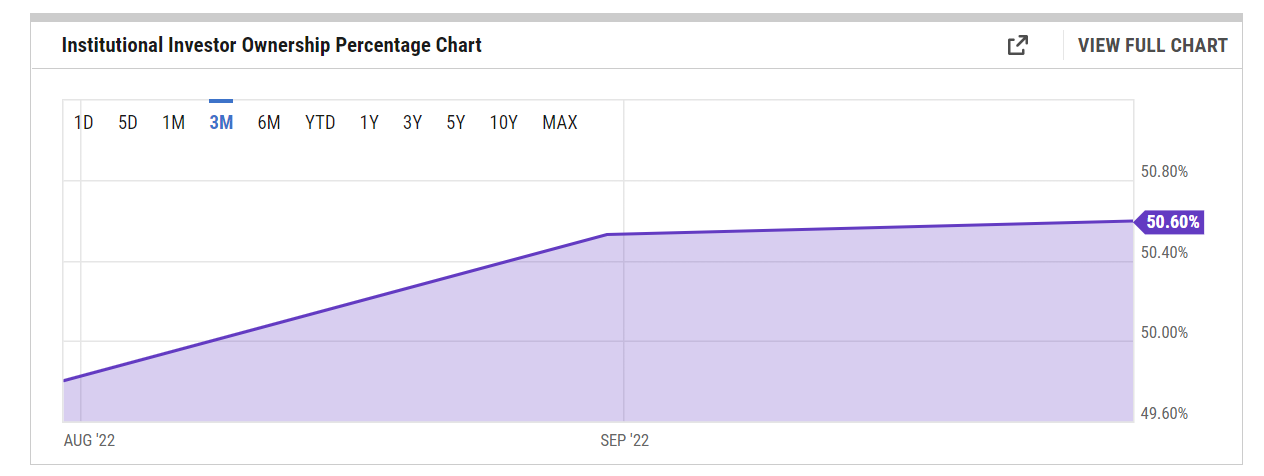
Besides volatility contraction, and a flattening out of the price could work as a phase of accumulation where large institutions start building positions. you’d be interested to note that after months of reducing their stake, the institutional cohort has been gradually boosting their position in SOFI stock over the past two months.
YCharts
SOFI is now trading precariously close to an intriguing support zone- the sub-$4.80 levels, and I’m curious to see how it fares at these levels. Previously, it had tested these levels twice; once in May, and once in September, and once again, we are not too far away from those levels.
Nonetheless, if the stock can continue to defend those levels for the third successive time, that would represent a triple bottom of sorts and could embolden another batch of bulls to come on board, and help the stock push above its important moving averages which are currently around the $6.17-$6.25 levels. This would set the stock up nicely to test the upper boundary of its falling wedge pattern which is above the $7 level.
Closing Thoughts- Is SOFI Stock A Buy, Sell, or Hold?
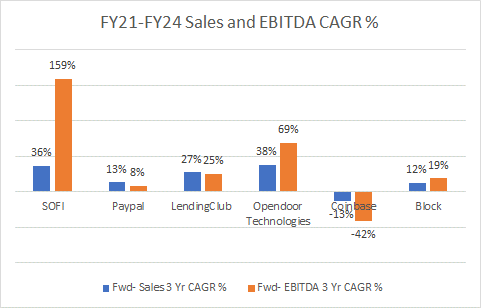
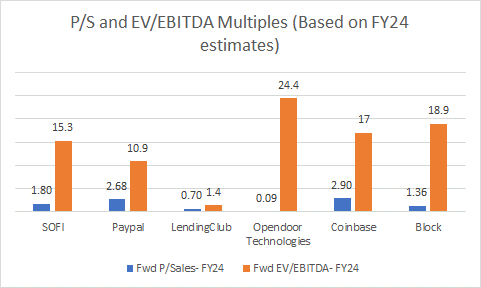
Sofi is one of those fintech stocks that offers a very promising growth runway over the next few years. In the image below, I’ve juxtaposed its expected sales and EBITDA CAGRs until 2024 (as per YCharts consensus estimates) versus some of the other peers in this space.
Whilst only Opendoor Technologies offers a better sales growth profile, on the EBITDA front, SOFI dwarfs them all, with 159% CAGR expected over the next three years. For a company like SOFI that is noted for reinvesting 70% of its revenue back into the business, such a strong expected EBITDA growth runway is very commendable.
YCharts
Thus, given the significant growth disparity highlighted in the image above, I don’t believe SOFI’s premium multiples (A forward P/S of 1.8x and forward EV/EBITDA of 15.3x) are too prohibitive.
YCharts
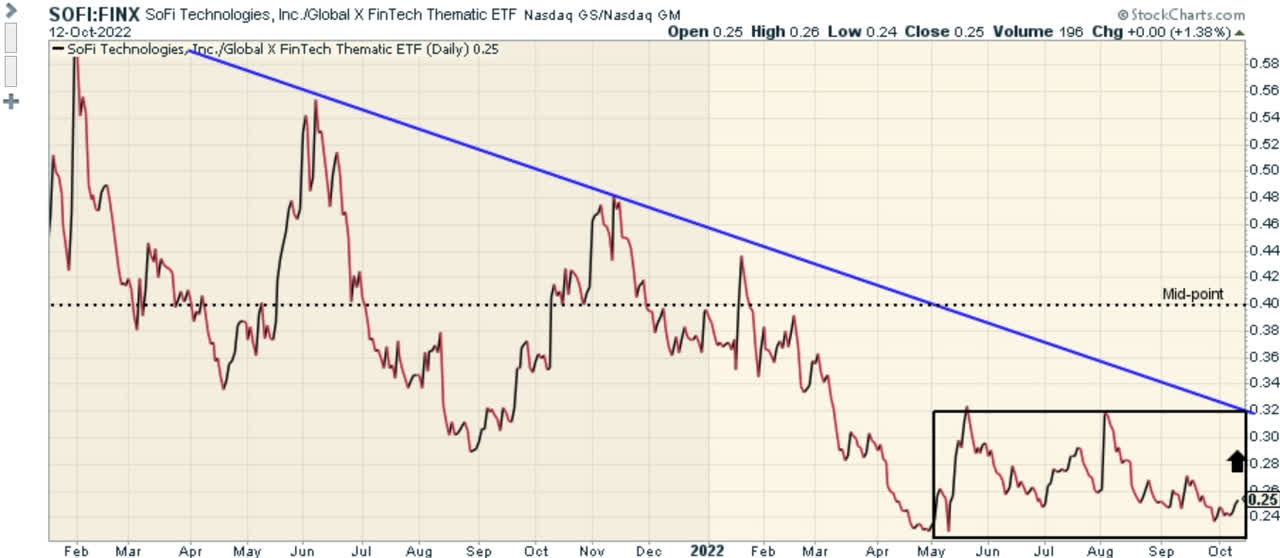
I’d also imagine that SOFI would be one of the principal names for those looking out for mean-reversion opportunities in the Fintech space.
If you look at the relative strength chart of SOFI versus its peers from the Fintech space, as represented by the Global X FinTech ETF (FINX), we can see that it is at rather lowly levels and is a long way off the mid-point of the range at 0.4x. Even if you think hitting that mid-point looks ambitious, and you want to be more conservative, note that at 0.25, it still hovers around the lower end of its short-term range which has been in play since May 2022; the upper end of this range also coincides with the downward slope at the 0.32 levels. Put another way, the SOFI stock offers good risk-reward at these levels relative to its peers from FINX.
Stockcharts
To conclude, the SOFI stock is a BUY.
Be the first to comment