

Petmal
By Marlies van Boven, PhD, and Alberto Allegrucci, PhD, Global Investment Research
Despite their historically high correlations and low tracking errors, Sustainable Investment (SI) index returns in most markets have strayed quite markedly from those of their respective benchmarks over the past tumultuous year.
A particularly strong case in point has been the UK. As we highlight in our latest Sustainable Investment Insights report, most UK SI strategies lagged the benchmark in 2022, with significant divergences across strategies, despite the UK strongly outperforming its developed-market peers for the period (with a gain of 4.9%).
Equity benchmarks and Sustainable Investment indices* (TR, LC %) – 2022
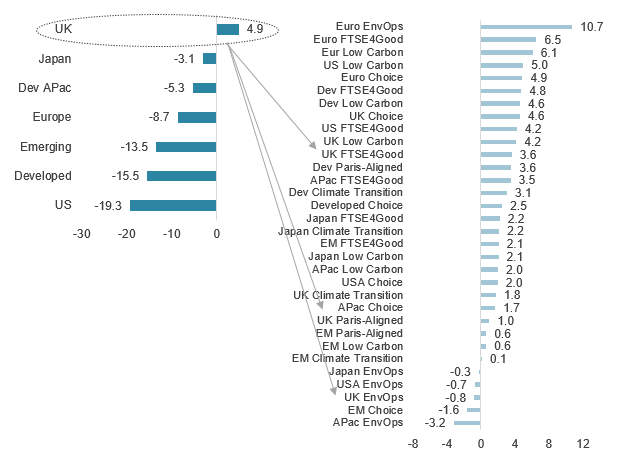
Source: FTSE Russell. * ESG Low Carbon Target, Choice = Global Choice, EnvOps = Environmental Opportunities. See link above to our latest report for a full list of the FTSE Russell Sustainable Investment indices. Data as of December 31, 2022. Past performance is no guarantee to future results. Please see the end for important disclosures.
Among the UK SI strategies, Environmental Opportunities was the biggest laggard for the period, trailing its benchmark by 16.9 percentage points. The Paris-Aligned, the Climate Transition and the ESG Low Carbon Target indices were also major underperformers, lagging by 15.5, 10.9 and 11.4 points, respectively. ESG-focused FTSE4Good and Global Choice UK returns were roughly in line with the UK market.
UK SI index relative returns vs the FTSE UK – 2022
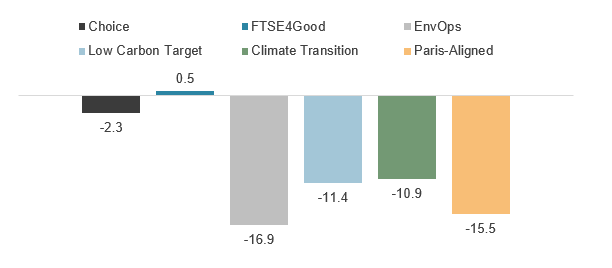
Source: FTSE Russell. Data as of December 31, 2022. Past performance is no guarantee of future results. Please see the end for important legal disclosures.
Why did UK SI return patterns diverge so greatly from those of their counterparts in other markets? Differing Energy exposures played a major role. Most SI strategies are underweight Energy stocks, either directly because their selection methodology explicitly excludes them (e.g., the EU benchmarks, such as the Climate Transition and Paris-Aligned) or indirectly (e.g., the green-tech-focused Environmental Opportunities).
Accordingly, the spectacular runup of Energy stocks in 2022 has been a significant drag on relative SI performances. This was particularly true in the UK, where the industry accounts for roughly 13.5% of the UK benchmark, almost three times its weight in the FTSE Europe ex UK and FTSE All-World ex UK, respectively.
Industry weights and contributions to YTD returns (TR, LC %) – 2022
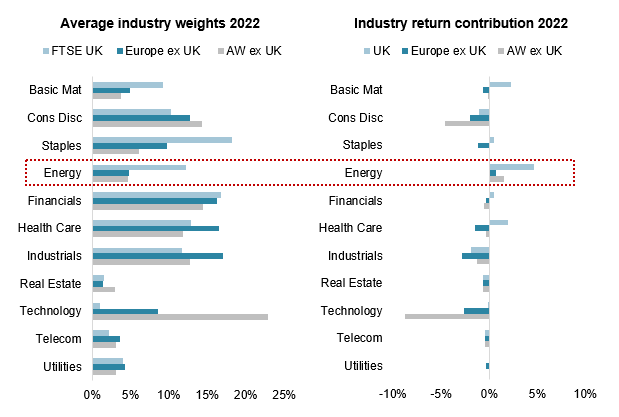
Source: FTSE Russell. Based on Industry Classification Benchmark (ICB) data as of December 31, 2022. Past performance is no guarantee of future results. Please see the end for important legal disclosures.
Oil stocks and prices have gone separate ways
As the graphic below illustrated, while crude oil prices have been falling since June, Energy stocks have seen renewed strength in recent months, supported mainly by these companies’ record-breaking quarterly profit reports. Oil, gas and coal stocks drove most of the industry’s recent gains, though alternative energy stocks have made headway since mid-year.
Global Energy sector returns (rebased, TR, LC) vs crude oil price (USD, RHS)
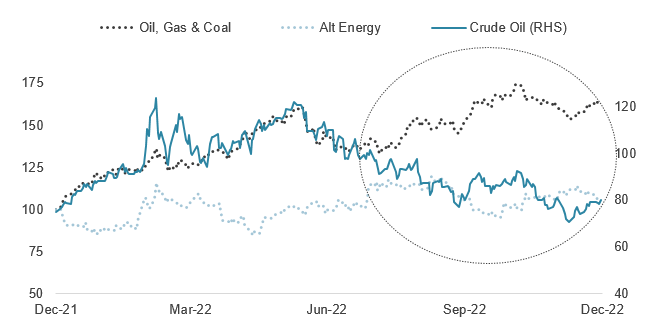
Source: FTSE Russell. Based on Industry Classification Benchmark (ICB) data through December 31, 2022. Past performance is no guarantee of future results. Please see the end for important legal disclosures.
The two charts below illustrate the impact of industry allocations on UK SI performances over 2022. As shown, the biggest strains on returns across strategies (except for UK Choice) have come from large underweights to outperforming Energy, despite its feeble gains during the last months of 2022. Overweights to underperforming Telecom stocks were another significant detractor for ESG Low Carbon, Climate Transition and the Paris-Aligned benchmarks, while Environment Opportunities’ overweight to the industry was modestly additive.
UK SI indices – Active industry weights and allocation effects – 2022 (TR, LC %)
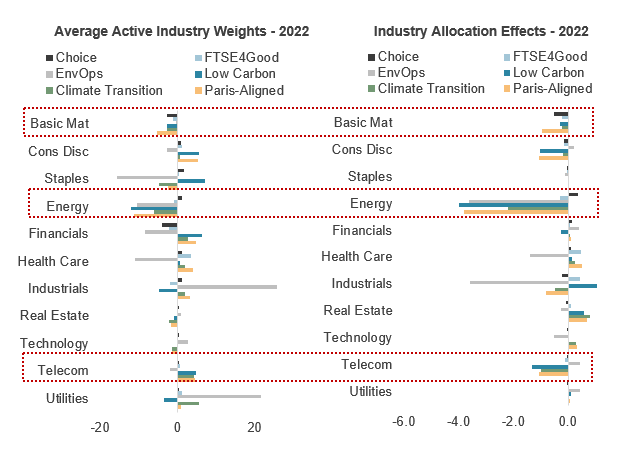
Source: FTSE Russell. Based on Industry Classification Benchmark (ICB) data as of December 31, 2022. Past performance is no guarantee of future results. Please see the end for important legal disclosures.
Oil prices to remain an overhang on SI returns in 2023
Given the continuing supply/demand constraints resulting from the ongoing Russia/Ukraine war, European Union price caps and the unclear impact of China’s Covid-19 policy on the economy, it is uncertain whether oil prices will revert to levels seen pre-pandemic. Although futures prices have declined, they are still above year-ago levels, even at the far end of the curve. Oil price moves do not necessarily imply same-direction movements in energy stock prices, but the latter is likely to continue to hold sway over SI index performance in the UK and globally in the year ahead.
Brent oil futures settlement price curve (USD)
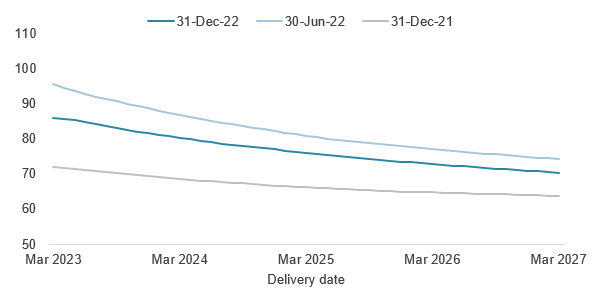
Source: FTSE Russell / Refinitiv. Data through December 31, 2022. Past performance is no guarantee of future results. Please see the end for important legal disclosures.
Valuations for both UK Energy and Telecom appear supportive, both relative to the benchmark and their long-term averages. Despite the 2022 rally, UK Energy remains the cheapest stock group based on 12-month-forward EPS estimates, while the sell-off in Telecom stocks has pushed the industry’s forward P/E well below its historical norm.
FTSE UK 12-month-forward P/E multiples
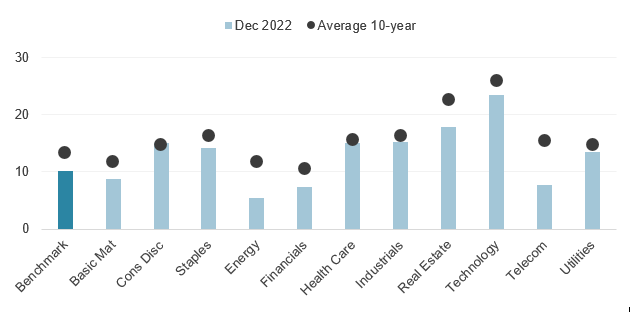
Source: FTSE Russell. Based on Industry Classification Benchmark (ICB) data as of December 31, 2022. Past performance is no guarantee of future results. Please see the end for important legal disclosures.
Notably, Energy currently carries a 12-month-forward dividend yield of around 4%, significantly below its 10-year average but in line with that of the benchmark, while Telecom is paying the highest forward dividend yield, which at 8.6% is significantly above its historical average of 5.6% and that of the benchmark.
FTSE UK 12-month-forward dividend yields (%)
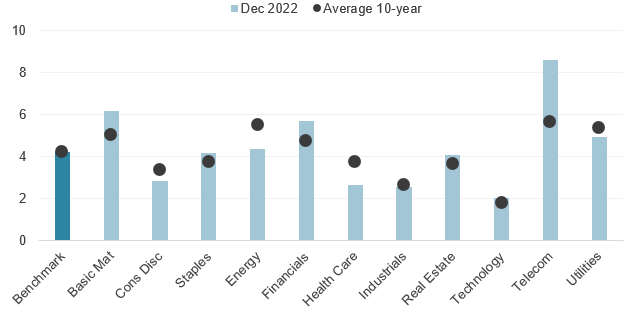
Source: FTSE Russell. Based on Industry Classification Benchmark (ICB) data as of December 31, 2022. Past performance is no guarantee of future results. Please see the end for important legal disclosures.
© 2023 London Stock Exchange Group plc and its applicable group undertakings (the “LSE Group”). The LSE Group includes (1) FTSE International Limited (“FTSE”), (2) Frank Russell Company (“Russell”), (3) FTSE Global Debt Capital Markets Inc. and FTSE Global Debt Capital Markets Limited (together, “FTSE Canada”), (4) FTSE Fixed Income Europe Limited (“FTSE FI Europe”), (5) FTSE Fixed Income LLC (“FTSE FI”), (6) The Yield Book Inc (“YB”) and (7) Beyond Ratings S.A.S. (“BR”). All rights reserved.
FTSE Russell® is a trading name of FTSE, Russell, FTSE Canada, FTSE FI, FTSE FI Europe, YB and BR. “FTSE®”, “Russell®”, “FTSE Russell®”, “FTSE4Good®”, “ICB®”, “The Yield Book®”, “Beyond Ratings®” and all other trademarks and service marks used herein (whether registered or unregistered) are trademarks and/or service marks owned or licensed by the applicable member of the LSE Group or their respective licensors and are owned, or used under licence, by FTSE, Russell, FTSE Canada, FTSE FI, FTSE FI Europe, YB or BR. FTSE International Limited is authorised and regulated by the Financial Conduct Authority as a benchmark administrator.
All information is provided for information purposes only. All information and data contained in this publication is obtained by the LSE Group, from sources believed by it to be accurate and reliable. Because of the possibility of human and mechanical error as well as other factors, however, such information and data is provided “as is” without warranty of any kind. No member of the LSE Group nor their respective directors, officers, employees, partners or licensors make any claim, prediction, warranty or representation whatsoever, expressly or impliedly, either as to the accuracy, timeliness, completeness, merchantability of any information or of results to be obtained from the use of FTSE Russell products, including but not limited to indexes, data and analytics, or the fitness or suitability of the FTSE Russell products for any particular purpose to which they might be put. Any representation of historical data accessible through FTSE Russell products is provided for information purposes only and is not a reliable indicator of future performance.
No responsibility or liability can be accepted by any member of the LSE Group nor their respective directors, officers, employees, partners or licensors for (A) any loss or damage in whole or in part caused by, resulting from, or relating to any error (negligent or otherwise) or other circumstance involved in procuring, collecting, compiling, interpreting, analysing, editing, transcribing, transmitting, communicating or delivering any such information or data or from use of this document or links to this document or (B) any direct, indirect, special, consequential or incidental damages whatsoever, even if any member of the LSE Group is advised in advance of the possibility of such damages, resulting from the use of, or inability to use, such information.
No member of the LSE Group nor their respective directors, officers, employees, partners or licensors provide investment advice and nothing in this document should be taken as constituting financial or investment advice. No member of the LSE Group nor their respective directors, officers, employees, partners or licensors make any representation regarding the advisability of investing in any asset or whether such investment creates any legal or compliance risks for the investor. A decision to invest in any such asset should not be made in reliance on any information herein. Indexes cannot be invested in directly. Inclusion of an asset in an index is not a recommendation to buy, sell or hold that asset nor confirmation that any particular investor may lawfully buy, sell or hold the asset or an index containing the asset. The general information contained in this publication should not be acted upon without obtaining specific legal, tax, and investment advice from a licensed professional.
Past performance is no guarantee of future results. Charts and graphs are provided for illustrative purposes only. Index returns shown may not represent the results of the actual trading of investable assets. Certain returns shown may reflect back-tested performance. All performance presented prior to the index inception date is back-tested performance. Back-tested performance is not actual performance, but is hypothetical. The back-test calculations are based on the same methodology that was in effect when the index was officially launched. However, back-tested data may reflect the application of the index methodology with the benefit of hindsight, and the historic calculations of an index may change from month to month based on revisions to the underlying economic data used in the calculation of the index.
This document may contain forward-looking assessments. These are based upon a number of assumptions concerning future conditions that ultimately may prove to be inaccurate. Such forward-looking assessments are subject to risks and uncertainties and may be affected by various factors that may cause actual results to differ materially. No member of the LSE Group nor their licensors assume any duty to and do not undertake to update forward-looking assessments.
No part of this information may be reproduced, stored in a retrieval system or transmitted in any form or by any means, electronic, mechanical, photocopying, recording or otherwise, without prior written permission of the applicable member of the LSE Group. Use and distribution of the LSE Group data requires a licence from FTSE, Russell, FTSE Canada, FTSE FI, FTSE FI Europe, YB, BR and/or their respective licensors.
Editor’s Note: The summary bullets for this article were chosen by Seeking Alpha editors.
Be the first to comment