

Andrii Dodonov
(This article was co-produced with Hoya Capital Real Estate)
Introduction
PIMCO is better known for their 21 Closed-End-Funds, mostly in the Fixed Income universe, but they also manage 18 Exchange-Trade-Funds, where Equities play a bigger role. PIMCO has three ETFs in the Municipal bond spaces, all actively managed, each focused on a different segment of the duration/maturity ladder. Those ETFs are:
- PIMCO Short Term Municipal Bond Active Exchange-Traded Fund (NYSEARCA:SMMU)
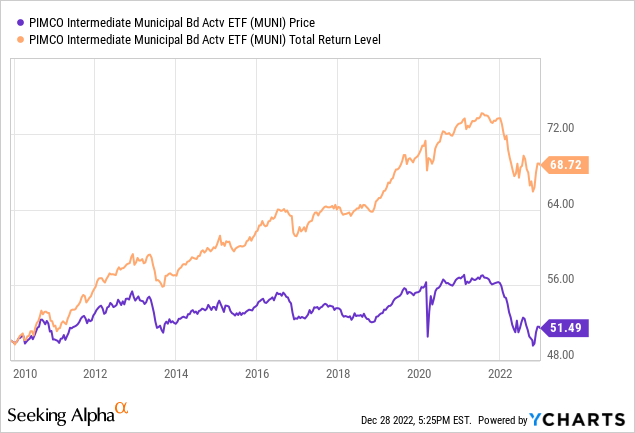
- PIMCO Intermediate Municipal Bond Active Exchange-Traded Fund (NYSEARCA:MUNI)
There is a third ETF, the PIMCO Municipal Income Opportunities Active Exchange-Traded Fund (MINO), but it is not reviewed as it started in late 2021. It has the longest duration and WAM, making it the best choice when interest rates start down but the worst one since it launched in 2021.
Municipal bond market update
The following statistics are all downloaded from SIFMA.org/resources. The first set shows who holds municipal bonds.
sifma.org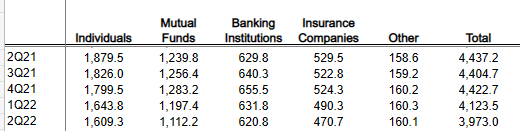
The next chart shows the amount outstanding, which has not grown much over the past decade.
sifma.org; Author generated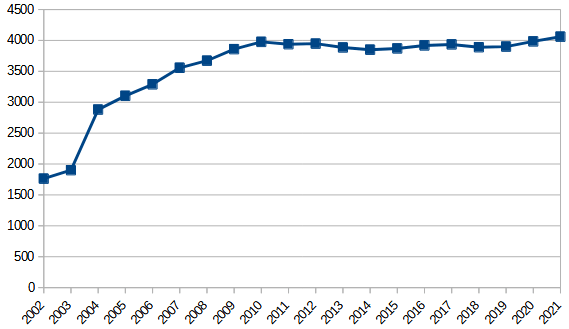
Slow growth in available bonds, if demand picks up, should provide price support. By various bond types, we see this for the past five quarters.
sifma.org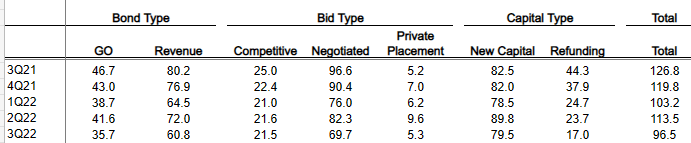
Municipal bond market viewpoints
Here I list what some major players see for this market.
- Municipal bond yields have risen significantly this year; in our view it’s time to consider adding to muni bond holdings.
- Although there is recession risk next year, state and local governments appear to be well positioned to manage economic challenges.
- Municipals, a high quality asset class, have moved from low yielding and overvalued early in the year to fairly valued, in our view.
- Technicals, typically a headwind in the autumn, may instead present opportunities for investors seeking to build yield in portfolios or to add to their municipal bond holdings.
Source: am.jpmorgan.com 10-31-22
We exhibit a long-duration stance with a preference for shortening to neutral if strength continues. We favor the intermediate part of the yield curve to maximize income, while limiting duration risk, and are targeting bonds with defensive structures. We maintain an up-in-quality bias with an overweight allocation to the revenue sectors and an underweight allocation to the tax-backed sectors. Duration Short Neutral Long Nov Oct Overweight:
• Essential-service revenue bonds.
• Select highest quality state and local issuers with broadest tax support.
• Flagship universities and diversified health systems.
• Select issuers in the high yield space.
Underweight:
• Speculative projects with weak sponsorship, unproven technology, or unsound feasibility studies.
• Senior living and long-term care facilities in saturated markets.
Source: blackrock.com 12-7-22
They also had the following yield chart.
bloomberg.com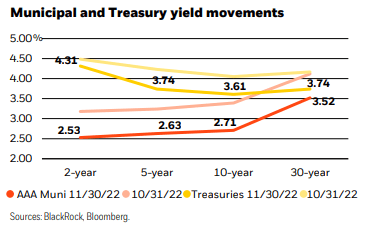
Raymond James did not make a forecast but did have the following chart that shows how the 2-yr and 10-yr AAA-rate municipal rates compare to what the Fed Funds Rate has done; notice the recent divergence.
raymondjames.com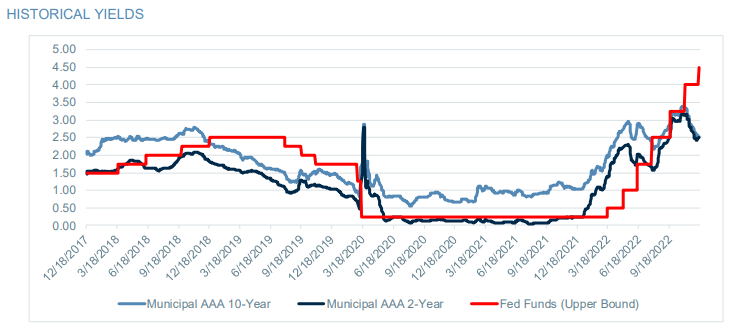
Schwab presented the following chart, which compares AAA Munis to USTs of the same maturity.
schwab.com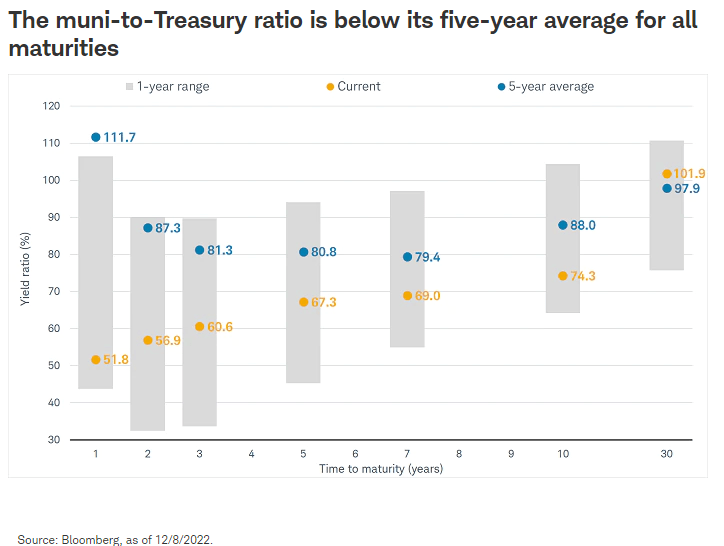
This is the commentary that proceeded the chart:
One metric we often use to analyze the relative attractiveness of the muni market is the muni-to-Treasury ratio. It compares the yield on a generic AAA-rated muni bond to that of a Treasury of equal maturity before adjusting for taxes. As illustrated in the chart below, that ratio is below its five-year average for most maturities on the curve. It’s especially below its longer-term average for short-term bonds. Tactically, this can be translated to mean that intermediate-term bonds offer more attractive relative yields than shorter-term bonds. This isn’t to say that we don’t suggest holding some short-term bonds, but we think investors should consider extending duration in 2023 to take advantage of the move up in longer-term yields.
Source: schwab.com
PIMCO Short Term Municipal Bond Active Exchange-Traded Fund review
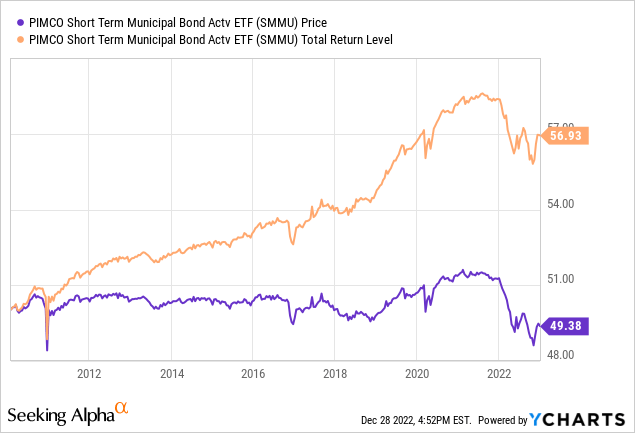
Seeking Alpha describes this ETF as:
SMMU invests in the municipal bonds issued by or on behalf of states and local governments and their agencies, authorities and other instrumentalities. The fund invests in short-term securities with an average portfolio duration not exceeding three years. It may only invest in U.S. dollar-denominated investment grade debt securities, rated Baa or higher. It seeks to benchmarks the performance of its portfolio against the Bloomberg 1 Year Municipal Bond Index. The ETF started in 2010.
Source: seekingalpha.com SMMU
SMMU has $535m in assets and has a yield just over 1%. Fees are 35bps. Even though SMMU doesn’t passively invest against its benchmark, understanding it gives insight into their investment strategy. PIMCO provides this overview:
The Bloomberg 1-Year Municipal Bond Index is the 1 Year (1-2) component of the Municipal Bond Index. The Index is a rules-based, market-value-weighted index engineered for the long term tax-exempt bond market. To be included in the Index, bonds must be rated investment-grade (Baa3/BBB- or higher) by at least two of the following ratings agencies: Moody’s, S&P and Fitch. They must have an outstanding par value of at least $7 million and be issued as part of a transaction of at least $75 million. The bonds must be fixed rate, and be at least one year from their maturity date. Remarketed issues, taxable municipal bonds, bonds with floating rates, and derivatives, are excluded from the benchmark.
Source: pimco.com SMMU bnmk
SMMU holdings review
I start with the state allocation, which is heavily weighted in two states: California and New York, both losing populations and looking at budget deficits for 2023.
pimco.com SMMU states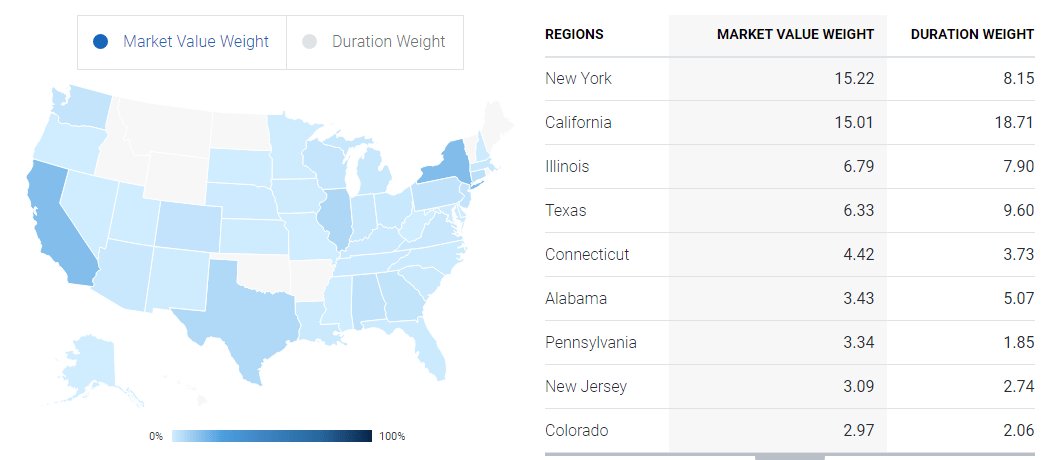
Next, I looked at the credit rating allocation. Policy requires all bonds be investment-grade.
pimco.com SMMU ratings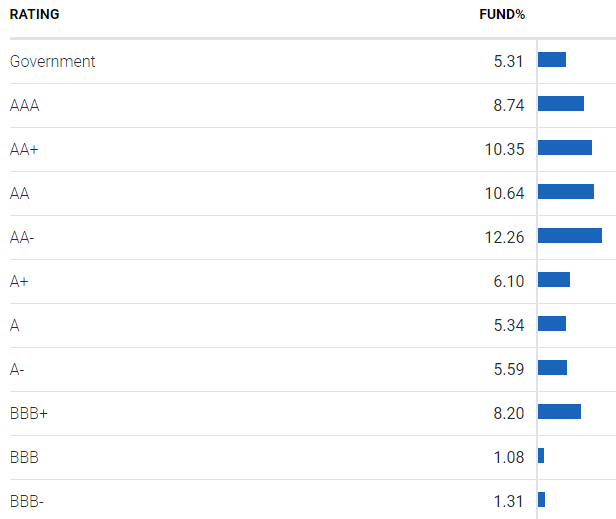
About 22% is not rated and 2% in ST paper; the rest I calculated to have a weighted rating of AA-. Being short-term, next we look at the maturity allocations.
pimco.com SMMU maturities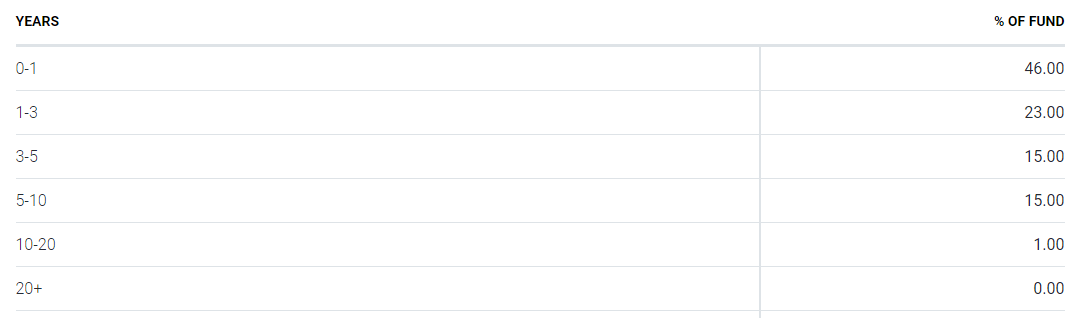
I was surprised to see 16% of the allocation to maturities over 5 years. With 46% of the portfolio maturing over the next year, that high turnover should bode well for possible payout increase in 2023. Like other bonds, municipals have sectors too.
pimco.com SMMU sectors
I mentioned weaknesses of the two biggest state allocations; that becomes less of an issue with only 21.35% of the portfolio in General Obligation bonds, some of which are local, not state issued. I had to look elsewhere for the top holdings as PIMCO did not provide that detail.
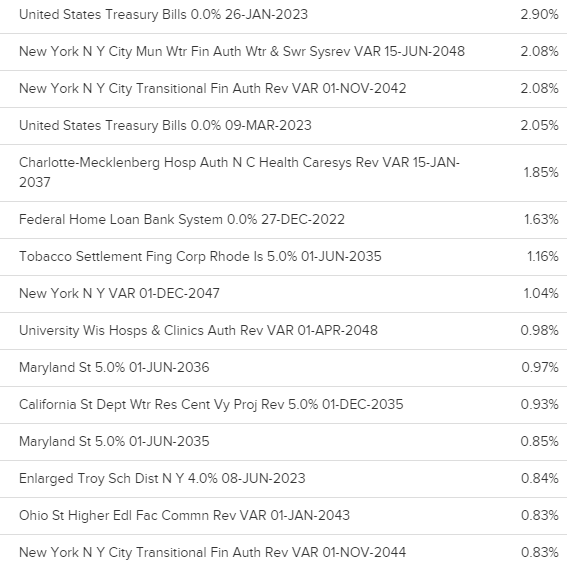
etfdb.com/etf/SMMU/#holdings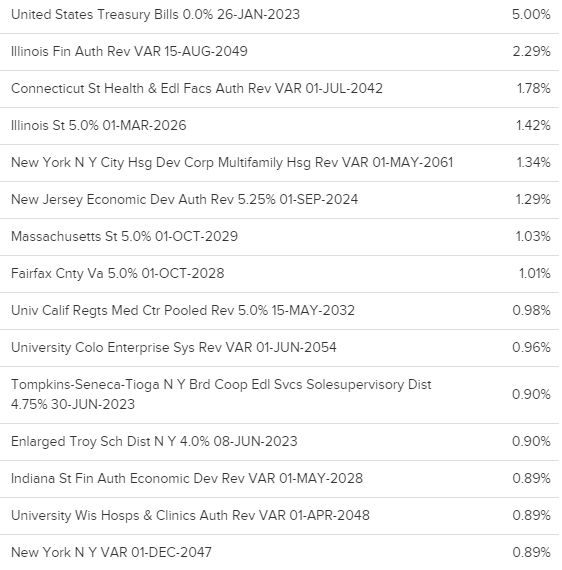
The top 15 (out of 303) are 21.5% of the portfolio. PIMCO lists the YTM at 3.5%.
SMMU distribution review
seekingalpha.com SMMU DVDs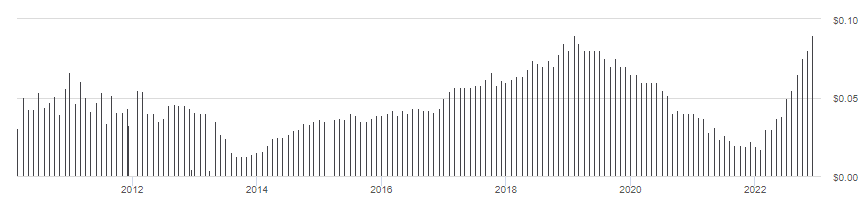
Payout consistency is not what investors have gotten from SMMU. The latest distribution is the highest ever, reflecting a positive of having a short duration when rates are rising. This pattern earns SMMU a “D-” grade from Seeking Alpha though.
seekingalpha.com SMMU scorecard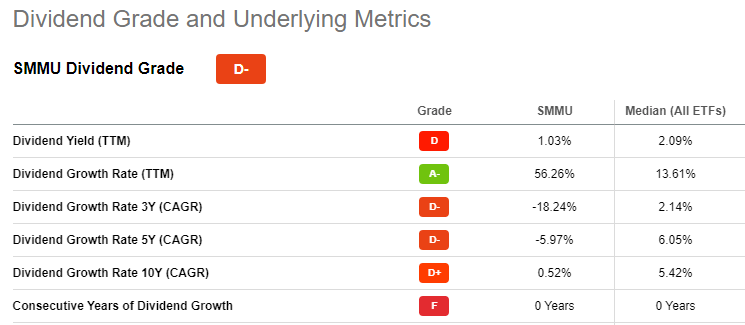
PIMCO Intermediate Municipal Bond Active Exchange-Traded Fund review
Seeking Alpha describes this ETF as:
MUNI invests in U.S. dollar-denominated intermediate-term municipal bonds that are issued by states or local government, their agencies, authorities, and other instrumentalities. It invests in securities with average portfolio duration within (negative) 2 years to positive 4 years. It may invest 25% or more of its total assets in Municipal Bonds that finance similar projects, such as those relating to education, health care, housing, transportation, and utilities, and 25% or more of its total assets in industrial development bonds. It seeks to benchmarks the performance of its portfolio against the Bloomberg 1-15 Year Municipal Bond Index. MUNI started in 2009.
Source: seekingalpha.com
MUNI has $808m in assets and provides investors with a 2% yield. Fees are also 35bps. Here is PIMCO’s overview of the benchmark used by MUNI:
Bloomberg 1-15 Year Municipal Bond Index consists of a broad selection of investment grade general obligation and revenue bonds of maturities ranging from one year to 17 years. It is an unmanaged index representative of the tax exempt bond market.
Source: pimco.com MUNI bnmk
MUNI holdings review
Here, New York and California have the highest weights again but not in equal proportions as with SMMU.
pimco.com MUNI states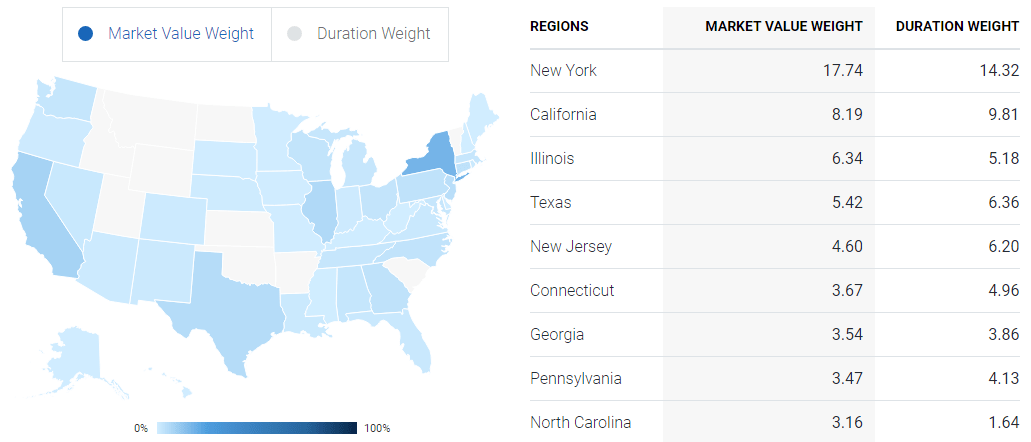
I calculated the weighted rating for MUNI to be a slightly stronger “AA-” than SMMU. About 19% in Non-Rated or ST paper.
pimco.com MUNI ratings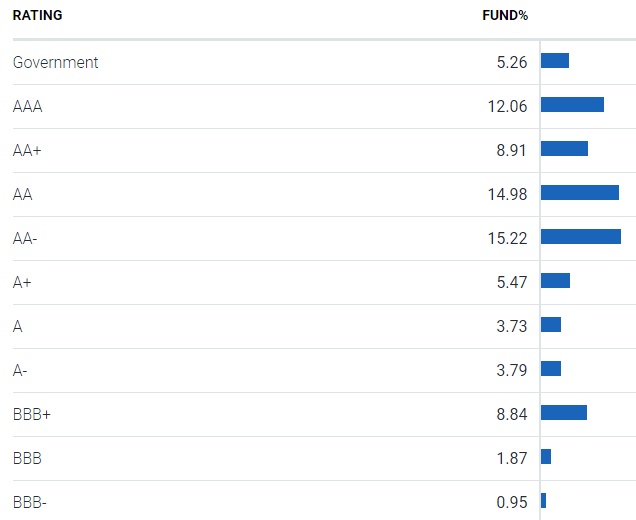
Being an Intermediate-focused ETF, the allocations generate a longer WAM by 3 years. Even so, 24% of the portfolio matures within the next year, allowing for reinvestment as rates hopefully peak.
pimco.com MUNI maturities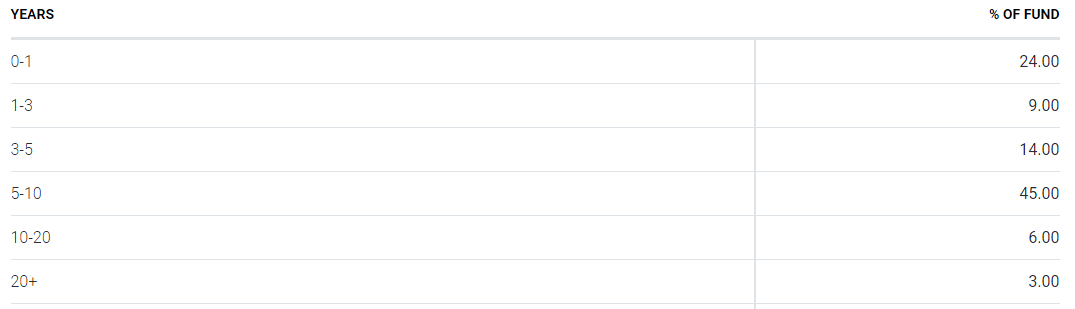
MUNI has more GO bonds than SMMU, making it more dependent on tax revenues staying strong.
pimco.com MUNI sectors etfdb.com/etf/MUNI/#holdings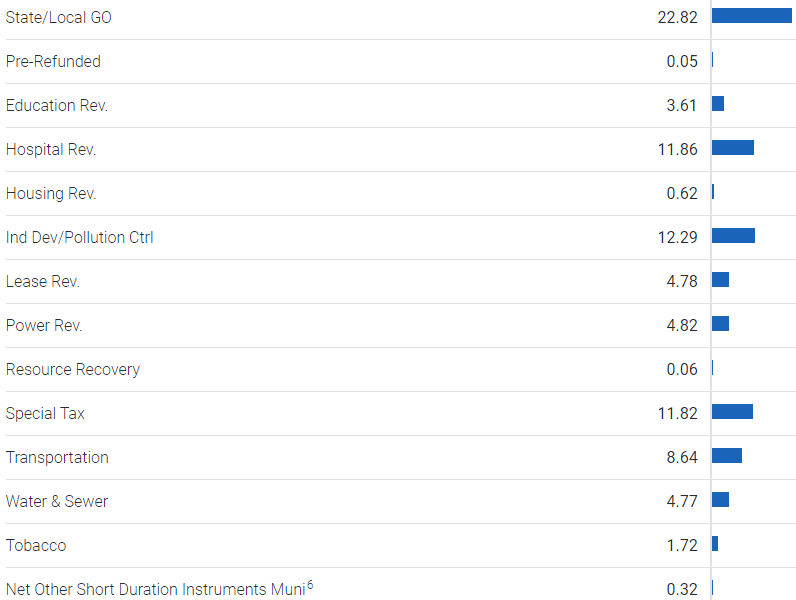
MUNI holds 340 bonds, with these Top 15 being 21% of the weight. MUNI has a higher YTM of 3.7%.
MUNI distribution review
seekingalpha.com MUNI DVDs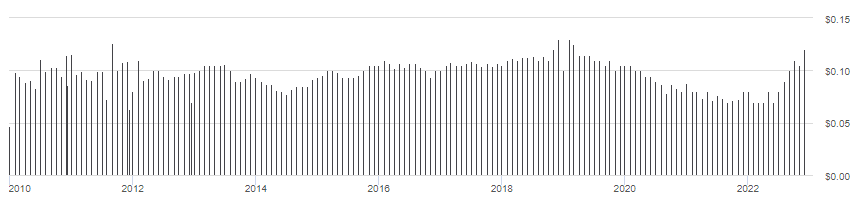
MUNI shows a similar, but less severe, payout pattern than SMMU. Recent payout increases are most likely related to the large percent of bonds that mature each year. Regardless, this still only graded as a “D+”.
seekingalpha.com MUNI scorecard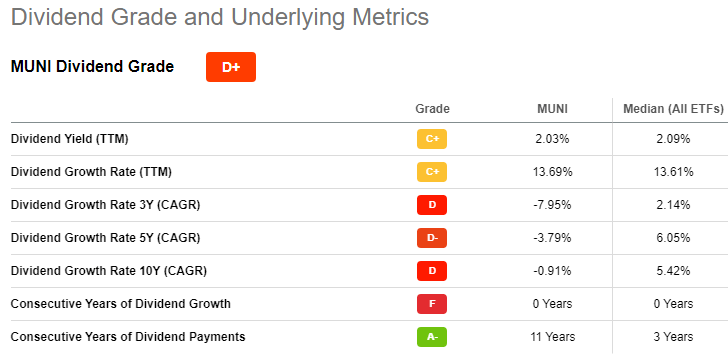
Comparing the ETFs
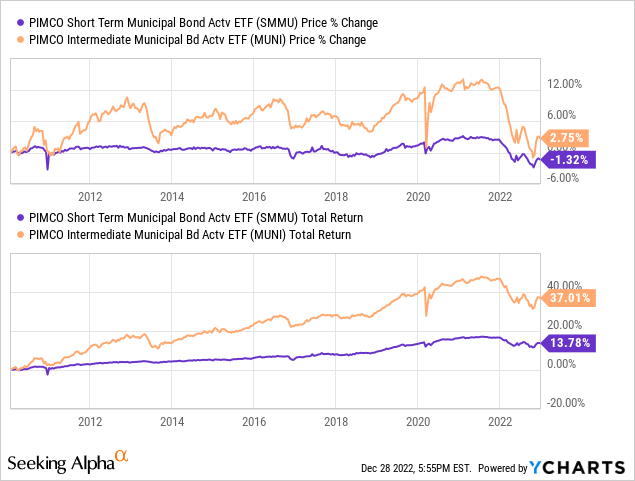
For investors who understand how duration affects bond funds, the above is no surprise. SMMU’s shorter duration produces a smoother ride but lower CAGR than MUNI. Using data limited by the vendor, we get these return and risk results.
PortfolioVisualizer.com
Neither return over the past decade would have made investors happy, regardless of the risk level involved but there is a clear difference. The next table compares attributes of the two ETFs.
| Factor | SMMU ETF | MUNI ETF |
| AUM | $535m | $808m |
| Yield | 1.0% | 2.0% |
| YTM | 3.5% | 3.7% |
| WA Coupon | 3.9% | 4.5% |
| WA Price | $100.38 | $103.50 |
| Bonds rates above BBB+ | 64.3% | 69.4% |
| Top 3 State exposure | 37% | 32% |
| Largest sector exposure | Gen Ob: 21.3% | Gen Ob: 22.8% |
| Beta | .74 | .92 |
| Turnover | 64% | 50% |
| Institutional Owners | 79% | 62% |
Comparing ETFs against other PIMCO Muni funds
PortfolioVisualizer.com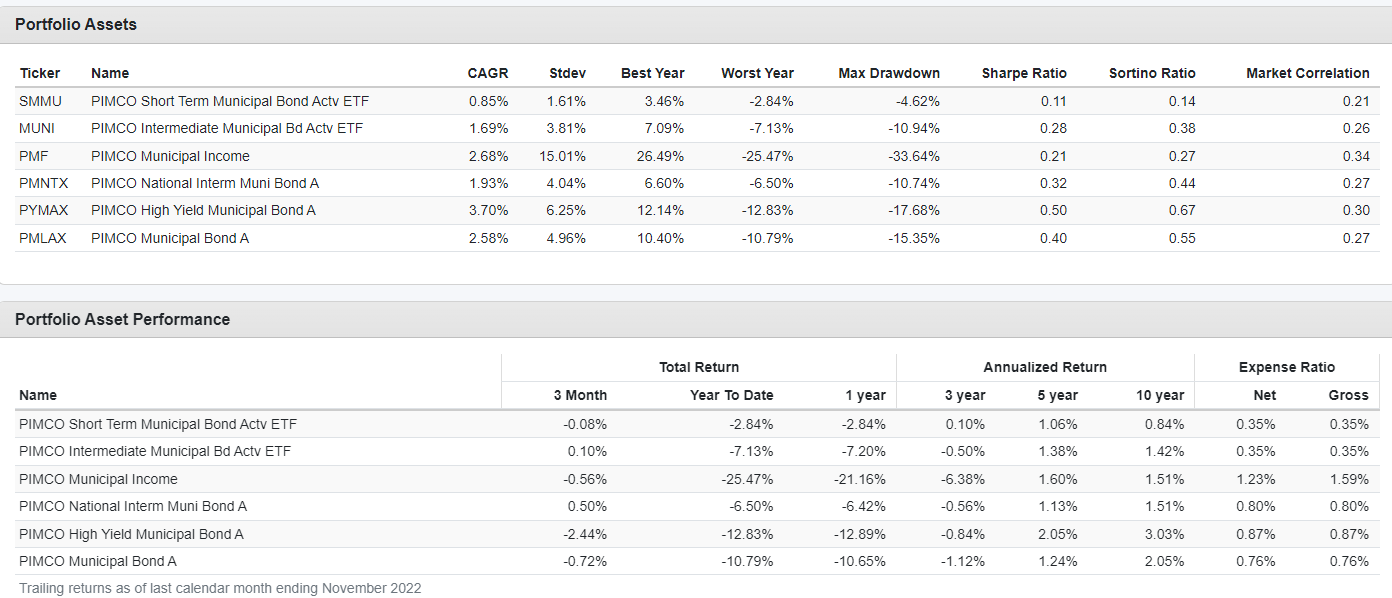
Over the past decade, both ETFs have trailed the PIMCO Municipal Income Fund (PMF) and all three of the PIMCO mutual funds. MUNI, even with the lowest StdDev, still trailed the three mutual funds on both risk ratios.
Portfolio strategy
This chart also comes from Schwab, indicating that MUNI might be the better choice at this time, which makes sense with its longer duration.
schwab.com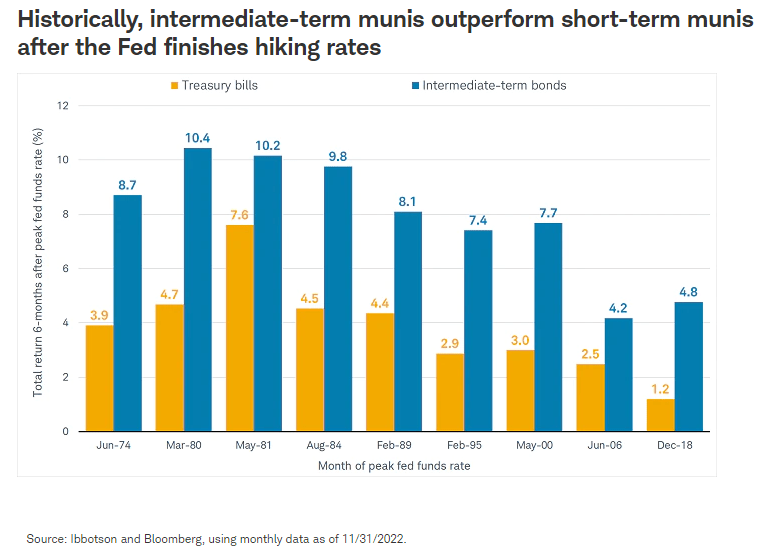
When investors become convinced rates are not rising more, then the MINO ETF would be best ETF.
The verdict is in
- Sell SMMU. While the since-inception return of 3.7% is okay, the past decade has been under 1%. Even after-taxes, CDs seem a better choice.
- Sell MUNI. Its since-inception return is only 2.3% and recent performance is even lower. CDs for the risk-adverse or the PIMCO High Yield Municipal Bond Fund (PYMAX) for others seem better choices.
Links to other recent Municipal bond articles
- NEA Vs. NUW: Clear Winner Between These Nuveen AMT-Free CEFs
- PMF: PIMCO Muni Bond CEF Giving Nuveen A Challenge
Be the first to comment