

syahrir maulana/iStock via Getty Images
This dividend ETF article series aims at evaluating products regarding the relative past performance of their strategies and quality metrics of their current portfolios. As holdings and their weights change over time, I may update reviews, usually no more than once a year.
SMDV strategy and portfolio
The ProShares Russell 2000 Dividend Growers ETF (SMDV) has been tracking the Russell 2000 Dividend Growth Index since 02/03/2015. It has 89 holdings, a distribution yield of 2.10% and a total expense ratio of 0.40%.
As described in the prospectus by ProShares, the fund invests in “companies that are currently members of the Russell 2000 Index, have increased dividend payments each year for at least 10 consecutive years and meet certain market capitalization and liquidity requirements”. Constituents are in equal weight with a maximum of 30% in any sector. The underlying index is reconstituted annually in June and rebalanced quarterly.
SMDV invests exclusively in U.S. based companies. SMDV is more expensive than the parent index Russell 2000 (IWM) regarding price/earnings and price/cash flow ratio. However, it is a bit cheaper in price/book and price/sales (see next table).
|
SMDV |
IWM |
|
|
Price/Earnings |
17.71 |
14.78 |
|
Price/Book |
1.83 |
2.15 |
|
Price/Sales |
1.29 |
1.35 |
|
Price/Cash Flow |
13.21 |
10.97 |
In fact, valuation ratios are questionable because of the heavy weight of financials, where these metrics are unreliable (about 30% of asset value). Two other major sectors are utilities and industrials, both between 18% and 19%. Other sectors weigh no more than 11% individually and 34% in aggregate. Compared to IWM, SMDV overweights not only financials, utilities and industrials, but also consumer staples and materials. It underweights all other sectors.
SMDV sectors (Chart: author; data: Fidelity)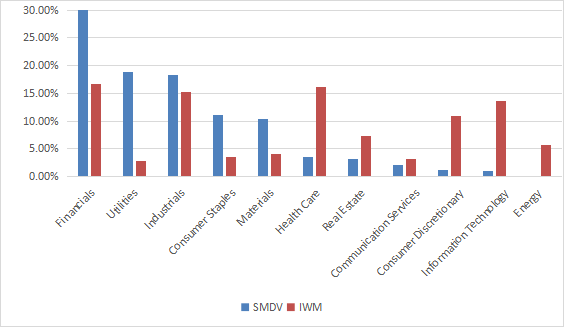
All constituents weights are equal after each rebalancing, but they may drift with price action. The current top 10 holdings are listed below with some fundamental ratios. They represent 13.8% of asset value. The largest position weighs 1.64%, so the risk related to individual stocks is low.
|
Ticker |
Name |
Weight |
EPS growth %TTM |
P/E TTM |
P/E fwd |
Yield% |
|
South Jersey Industries Inc |
1.64% |
0.10 |
21.28 |
20.93 |
3.54 |
|
|
Andersons Inc |
1.47% |
1288.70 |
14.25 |
15.42 |
1.64 |
|
|
SpartanNash Co |
1.42% |
-3.31 |
14.97 |
15.31 |
2.75 |
|
|
Northwest Natural Holding Co |
1.39% |
10.45 |
21.65 |
21.45 |
3.48 |
|
|
Trinity Industries Inc. |
1.35% |
136.85 |
63.63 |
28.02 |
2.90 |
|
|
BancFirst Corp |
1.32% |
67.77 |
15.41 |
19.34 |
1.86 |
|
|
Worthington Industries Inc. |
1.32% |
-21.81 |
7.15 |
8.85 |
1.93 |
|
|
Ensign Group Inc |
1.30% |
11.86 |
25.58 |
21.62 |
0.25 |
|
|
Universal Corp |
1.30% |
56.92 |
13.99 |
N/A |
5.54 |
|
|
Avista Corp |
1.29% |
10.59 |
21.52 |
22.21 |
3.90 |
Historical performance
Since inception in February 2015, SMDV and IWM have almost identical annualized returns. However, SMDV has much better risk metrics (drawdown and volatility), resulting in a higher risk-adjusted performance (Sharpe ratio).
|
Total Return |
Annual.Return |
Drawdown |
Sharpe ratio |
Volatility |
|
|
SMDV |
84.83% |
9.07% |
-34.12% |
0.62 |
14.50% |
|
IWM |
83.58% |
8.96% |
-41.13% |
0.49 |
19.68% |
Data calculated with Portfolio123
The next chart plots the equity value of $100 invested in SMDV and IWM since SMDV inception.
SMDV vs. IWM (Chart: author; Data calculated with Portfolio123)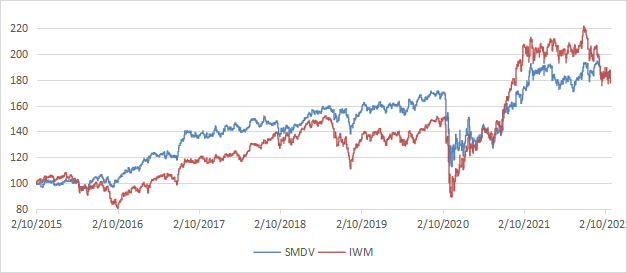
SMDV has alternatively beaten and lagged the small-cap benchmark. They are almost on-par in total return as of writing. The chart visually confirms that SMDV is less volatile.
In previous articles, I have shown how three factors may help cut the risk in a dividend portfolio: Return on Assets, Piotroski F-score, and Altman Z-score.
The next table compares SMDV since inception with a subset of the S&P 500: stocks with above-average dividend yield and ROA, good Altman Z-score and Piotroski F-score, and a sustainable payout ratio. It is rebalanced annually to make it comparable with a passive index.
|
Total Return |
Annual.Return |
Drawdown |
Sharpe ratio |
Volatility |
|
|
SMDV |
84.83% |
9.07% |
-34.12% |
0.62 |
14.50% |
|
Dividend quality subset |
110.23% |
11.07% |
-36.33% |
0.7 |
15.48% |
Past performance is not a guarantee of future returns. Data Source: Portfolio123
The dividend quality subset beats SMDV by 2 percentage points in annualized total return. However, the fund’s performance is real and the subset is hypothetical. My core portfolio holds 14 stocks selected in this subset (more info at the end of this post).
Scanning SMDV with quality metrics
SMDV holds 88 stocks. I have scanned them with my quality metrics, considering that risky stocks are companies with at least 2 red flags among: bad Piotroski score, negative ROA, unsustainable payout ratio, bad or dubious Altman Z-score, excluding financials and real estate where these metrics are less relevant. With these assumptions, 12 holdings are risky and they weigh about 13.6% of asset value. It is not very good, but still acceptable.
Based on my calculation, SMDV beats the Russell 2000 in Altman Z-score, Piotroski F-score and ROA. However, the S&P 500 (SPY) does significantly better. These metrics point to a portfolio quality slightly superior to the small-cap benchmark, and inferior to the large cap benchmark.
|
Aggregates |
Altman Z-score |
Piotroski F-score |
ROA% TTM |
|
SMDV |
3.10 |
5.25 |
4.12 |
|
IWM |
2.44 |
4.89 |
0.56 |
|
SPY |
3.49 |
6.53 |
7.82 |
Takeaway
SMDV is an equal-weight small cap dividend growth ETF. Its heavy weight in financials may skew its aggregate fundamental ratios. Quality measured by my quality metrics (excluding financials) is superior to the parent index Russell 2000, but inferior to a large cap benchmark. Risky stocks (also excluding financials) represent about 13% of asset value. SMDV is on par with the Russell 2000 in return since inception, but beats it in risk-adjusted performance thanks to a lower volatility. SMDV has a 2-star rating at Morningstar, which I find a bit underrated regarding its low-risk profile among other small cap ETFs. For transparency, a dividend-oriented part of my equity investments is split between a passive ETF allocation (SMDV is not part of it) and my actively managed Stability portfolio (14 stocks), disclosed and updated in Quantitative Risk & Value.
Be the first to comment