

VitaliyPozdeyev/iStock via Getty Images
SMART Global Holdings (NASDAQ:SGH) capped off FY2022 with the release of the final report for the fiscal year on Friday, October 14. Bulls should be pleased to hear that FY2022 achieved major gains in a number of areas, including the top and the bottom line. However, there are some less than desirable trends going on, on top of a stock that has sold off, which severely weakens the bull case for SGH. Why will be covered next.
SGH finished with a tepid end to what was a productive year overall
SGH can look back at FY2022 as a productive year with solid gains. FY2022 revenue increased by 21% YoY to $1,819.4M. If only services are included, then growth was much faster at 59% YoY. GAAP EPS increased by 198% YoY to $1.22 and non-GAAP EPS increased by 39% YoY to $3.62. Adjusted EBITDA was $262.6M in FY2022, up from $187.8M in FY2021. Revenue, gross margins, adjusted EBITDA and non-GAAP EPS all reached record highs. FY2022 was a productive year from that standpoint. The table below shows the numbers for FY2022.
|
(GAAP) |
FY2022 |
FY2021 |
YoY |
|
Net sales |
$1,819.4M |
$1,501.1M |
21.20% |
|
Gross margin |
24.9% |
20.5% |
440bps |
|
Operating income |
$114.5M |
$55.2M |
107.43% |
|
Net income (attributable to SGH) |
$66.6M |
$21.3M |
212.68% |
|
EPS |
$1.22 |
$0.41 |
197.56% |
|
(Non-GAAP) |
|||
|
Net sales |
$1,819.4M |
$1,501.1M |
21.20% |
|
Gross margin |
25.9% |
22.2% |
370bps |
|
Operating income |
$227.6M |
$160.8M |
41.54% |
|
Net income (attributable to SGH) |
$190.2M |
$132.2M |
43.87% |
|
EPS |
$3.62 |
$2.61 |
38.70% |
Source: SGH Form 10-K
However, while the full-year numbers look good, a closer look reveals some worrying trends. For starters, the numbers got worse over time. Revenue and non-GAAP EPS peaked at $470M and $1.08 in Q1, but then declined with each passing quarter. Q4 revenue declined by 5% QoQ and 6% YoY to $437.7M. IPS contributed $145M, LED $83M and Memory Solutions the remaining $210M.
IPS outperformed with an increase of 52% QoQ and 48% YoY, greatly offsetting declines in the Memory Solutions and LED unit. The former faced headwinds with weak demand in Brazil and the latter faced setbacks with COVID-19 lockdowns in China. The LED unit comes with higher margins and the decline there led to lower gross margins, which have steadily declined in recent quarters.
Non-GAAP EPS declined by 8% QoQ and 26% YoY to $0.80. Adjusted EBITDA was $55.9M in Q4 FY2022, down from $64M in Q3 FY2022 and $75.9M in Q4 FY2021. GAAP EPS did increase by 3% YoY to $0.40, unlike the decline in net income, but this was accomplished with the aid of stock buybacks. SGH used $39.8M to buy back shares in Q4, accounting for most of the $50M spent on stock buybacks in FY2022. As a consequence, the GAAP weighted-average of shares outstanding fell to 50.5M in Q4 FY2022, down from 55M in Q3 FY2022 and 52.8M in Q4 FY2021.
SGH finished Q4 and FY2022 with cash and cash equivalents of about $363M, more than offset by $675M in total debt. However, the balance sheet is set to change with SGH’s acquisition of Stratus, which was completed after the end of FY2022. SGH has borrowed $300M to pay $225M in cash for Stratus. Services have been a bright spot for SGH as shown earlier and the Stratus acquisition is expected to give services growth an additional boost. The table below shows the numbers for Q4 FY2022.
|
(GAAP) |
Q4 FY2022 |
Q3 FY2022 |
Q4 FY2021 |
QoQ |
YoY |
|
Net sales |
$437.697M |
$462.540M |
$467.708M |
(5.37%) |
(6.42%) |
|
Gross margin |
23.7% |
24.7% |
25.2% |
(100bps) |
(150bps) |
|
Operating income |
$27.601M |
$35.309M |
$31.739M |
(21.83%) |
(13.04%) |
|
Net income (attributable to SGH) |
$19.959M |
$24.113M |
$20.650M |
(17.23%) |
(3.35%) |
|
EPS |
$0.40 |
$0.44 |
$0.39 |
(9.09%) |
2.56% |
|
(Non-GAAP) |
|||||
|
Net sales |
$437.697M |
$462.540M |
$467.708M |
(5.37%) |
(6.42%) |
|
Gross margin |
24.6% |
25.7% |
26.4% |
(110bps) |
(180bps) |
|
Operating income |
$46.774M |
$54.272M |
$66.589M |
(13.82%) |
(29.76%) |
|
Net income (attributable to SGH) |
$40.435M |
$45.909M |
$55.138M |
(11.93%) |
(26.67%) |
|
EPS |
$0.80 |
$0.87 |
$1.08 |
(8.05%) |
(25.93%) |
Source: SGH Form 8-K
Earnings have been going down and the outlook sees a further decline in earnings. Guidance calls for Q1 FY2023 revenue of $425-475M, a decline of 4% YoY at the midpoint. The forecast expects GAAP EPS of $0.14, plus or minus $0.15, a decline of 62%, and non-GAAP EPS of $0.60, plus or minus $0.15, a decline of 44% YoY.
Note that Q1 revenue includes $35-40M in contributions from Stratus. If not for this, the YoY decline in revenue would have been even bigger. Furthermore, the acquisition will increase operating expenses, which will negatively affect the bottom line. Non-GAAP operating expenses are projected to jump to $72-78M, up from $61M in the preceding quarter.
|
(GAAP) |
Q1 FY2023 (guidance) |
Q1 FY2022 |
YoY (midpoint) |
|
Net sales |
$425-475M |
$469.9M |
(4.23%) |
|
Gross margin |
24.5-26.5% |
26.0% |
(50bps) |
|
EPS |
($0.01)-0.29 |
$0.37 |
(62.16%) |
|
(Non-GAAP) |
|||
|
Net sales |
$425-475M |
$469.9M |
(4.23%) |
|
Gross margin |
25.5-27.5% |
27.0% |
(50bps) |
|
EPS |
$0.45-0.75 |
$1.08 |
(44.44%) |
SGH is leaving open the possibility of further acquisitions after Stratus. From the Q4 earnings call:
“Our overall capital allocation strategy is as follows: first and foremost, we will continue to invest in our business as we see significant opportunities for further organic growth in each of our three business segments, while maintaining a strong balance sheet and prudent leverage; second, we will continue to review and seek acquisition opportunities such as Stratus for further scale and diversification in a disciplined manner; third, capital return via share repurchases provides us flexibility to return capital in an opportunistic and price sensitive manner. For 2023, an additional focus area will be to use excess cash flow to retire debt.”
A transcript of the Q4 FY2022 earnings call can be found here.
The stock continues its decline even though it looks inexpensive in some ways
The market has mostly shrugged off the latest report. The stock did not collapse after the Q4 report like it did after the Q3 report, but the stock has nevertheless lost ground in the days following the Q4 report, which is not that different from what it has done all year. The stock has lost 64% of its value YTD, vastly underperforming the overall tech sector with, for instance, the Invesco QQQ Trust (QQQ) losing 34% YTD.
In fact, the stock can be said to be in a downtrend in 2022 as shown in the chart below. The stock is moving lower within what looks like a channel. The stock has respected the boundaries of this channel all year. Notice how, for instance, the stock has skimmed along the resistance imposed by the upper boundary of the channel. The stock has been unable to break through, despite many chances to do so. Resistance has not yielded, forcing the stock lower.
As long as this remains the case, the stock is heading lower with the channel pointing down. Granted, trends do not last forever and the stock should eventually break out of the channel. But if someone were to ask where the stock is heading next, the most likely answer would be down with the way things stand at the moment.
Source: finviz.com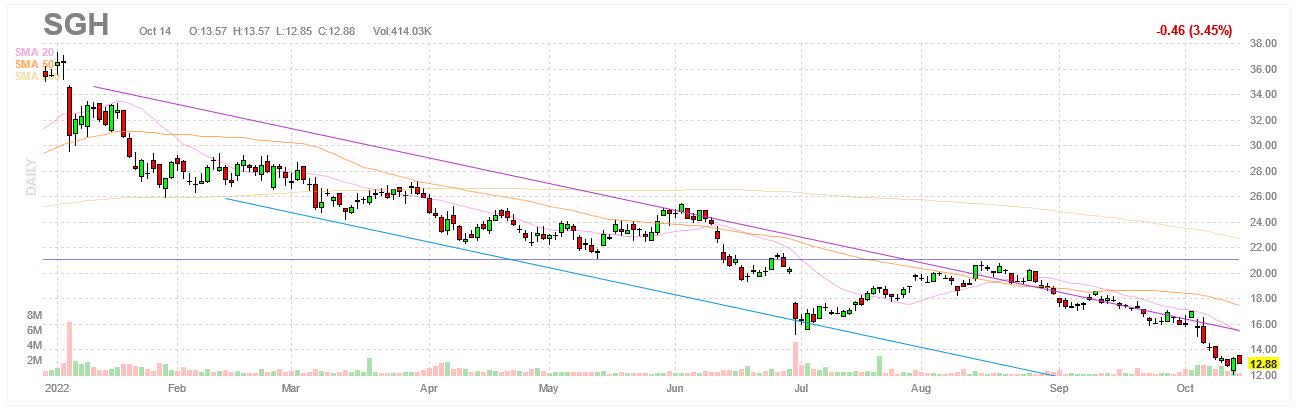
On the other hand, the big decline has helped lower valuations for SGH. The table below shows some of the multiples SGH trades at. For instance, the stock is valued at 1.7 times book value. SGH has a P/E ratio of 10.6 with a market cap of $667M. However, it’s worth noting how forward multiples are significantly higher than trailing ones, a reflection of declining earnings. On a forward basis, SGH trades at 15.2 times earnings. The balance sheet could also use some improvement. SGH has more debt than cash, which is why its enterprise value is much higher than its market cap.
|
SGH |
|
|
Market cap |
$666.89M |
|
Enterprise value |
$985.93B |
|
Revenue (“ttm”) |
$1,819.4M |
|
EBITDA |
$220.7M |
|
Trailing P/E |
10.56 |
|
Forward P/E |
15.20 |
|
PEG |
0.05 |
|
P/S |
0.35 |
|
P/B |
1.71 |
|
EV/sales |
0.54 |
|
Trailing EV/EBITDA |
4.47 |
|
Forward EV/EBITDA |
4.86 |
Source: SeekingAlpha
Investor takeaways
Some may argue SGH is worth buying after the stock has fallen by nearly two-thirds this year and with multiples where they are. The stock is close to oversold and a modest bounce would not be surprising at this point. Some parts of the business are still doing very well, particularly services. The recent acquisition of Stratus will only strengthen the services segment at SGH.
However, earnings are headed the wrong way. SGH had a productive year in FY2022, but FY2023 is shaping up to be less so. Consensus estimates, for instance, predict non-GAAP EPS of $2.05-2.54 in FY2023, much less than the $3.62 in the recently concluded FY2022. SGH is facing a number of headwinds that are affecting sales, whether it is weakening demand/economy, COVID-19 restrictions or supply chain disruptions. Most of these headwinds are likely to remain for the foreseeable future.
Trends do not last forever, but at the moment, the stock remains in a clear downtrend. The stock has yet to show any signs the trend is about to change, let alone any momentum for a sustained rally upwards. The stock will first need to regain its footing, perhaps with some sideways action. Otherwise, SGH may just be a case of trying to catch a falling knife. Potential longs are unlikely to step in under these conditions.
I remain neutral on SGH as reiterated before in a previous article. It’s true the stock has fallen a great deal, but there is room for it to go lower. Earnings have trended lower and there are no signs that will end anytime soon. There is no concrete evidence SGH has hit bottom. None of the headwinds that have given SGH problems all year have gone away. The charts suggest lower prices are in store with the trend being as it is. As long as this remains the case, standing on the sidelines is best.
Be the first to comment