

EUR/GBP Analysis:
- ECBs ultra-dovish stance and sluggish economic recovery in contrast to the UK and BoE
- EUR/GBP marking fresh yearly low, key level of support remains vulnerable
- Sentiment remains heavily net-long despite recent adjustments (77.8%)
Sluggish Economic Recovery
Both the UK and the Eurozone have witnessed a slower recovery than they had hoped for especially in the current accommodative environment. Both regions have experienced lackluster GDP figures but have seen un uptick in inflation figures and forecasts.
While both central banks remain conservative, the European Central Bank’s recent change to inflation targeting allowing inflation to run above 2%, coupled with largely dovish forward guidance, places them further down the list of major central banks expected to taper asset purchases or raise interest rates.
Find out how inflation and interest rates have an effect on the forex market by reading our article on CPI and the Forex Markets.
EUR:GBP Key Technical Levels
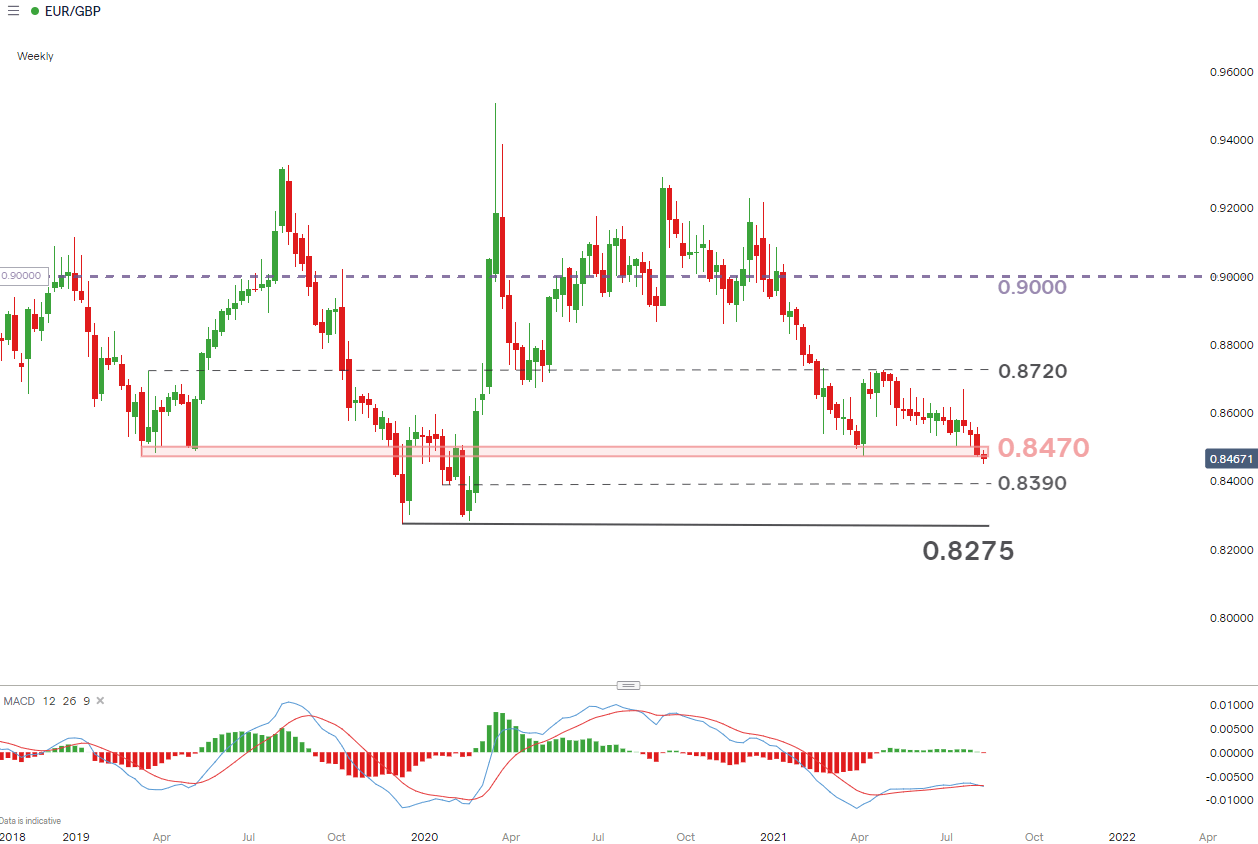
The weekly chart presents us with the key levels and major inflection points of the EUR/GBP pair (0.8729, 0.8470 and 0.8275). Since the start of the year we have witnessed Euro weakness against the Pound which now looks to trade and close below the 0.8470 level -which was identified as a previous inflection point.
A weekly close and hold below this level would result in the lowest level witnessed this year, surpassing the April low and could signal further selling – fueling the bearish bias of the pair.
EUR/GBP Weekly Chart
Chart prepared by Richard Snow, IG
The daily chart helps to highlight the more recent descending channel which witnessed a failed breakout towards the end of July this year. The MACD indicator confirms the bearish technical landscape with the MACD line above the MACD line while both lines carry readings below zero.
The average true range (ATR) reveals a trend of steadily declining volatility which tends to favor trend continuation. Should the bearish momentum continue, the initial stumbling block will be the 0.8470 level followed by yesterday’s low around 0.8450, thereafter, leaving the door open to a move towards 0.8390
As mentioned earlier, the 0.8470 level has witnessed multiple reversals in the past and yesterday’s extended lower wick on the daily chart may signal a rejection of lower prices at this level. Should EUR/GBP bounce off this zone, the nearest levels of resistance become the 0.8540 which coincides with the upper bound of the descending channel, followed by 0.8645 some way above.
EUR/GBP Daily Chart

Chart prepared by Richard Snow, IG
Recent Adjustments Reduce Heavily Net-Long Positioning
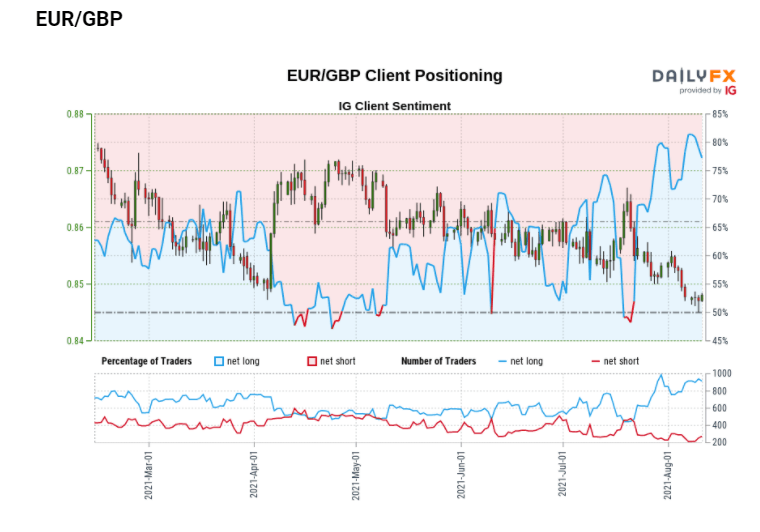
- Massive divergence between positioning and trend:77.85% of traders are net long while the pair has continued in line with the long-term and short-term downtrends. This underscores why IG client sentiment is considered a contrarian indicator.
- Mixed Trading Bias: Positioning is less net-long than yesterday but more net-long compared to last week providing a mixed trading bias. However, the overwhelming number of longs to shorts suggests there is very little evidence of any significant change to the current trend.
— Written by Richard Snow for DailyFX.com
Contact and follow Richard on Twitter: @RichardSnowFX
Be the first to comment