

Skyhobo
Company overview
Six Flags (NYSE:SIX) is a high-quality, deeply entrenched amusement park operator, with the opportunity to generate meaningful amounts of levered free cash flow relative to their market capitalization over the coming years. A strategy of “premiumization” and heavy investments into the guest experience have weighed on Six Flags’ business performance. However, these short-term challenges mask the attractiveness of the SIX’s core business model, which earns 49 percent incremental margins, and those challenges are quickly being addressed by a new management team focused on cost discipline and leverage reduction.
I believe there is a clear path for Six Flags to generate $4.20 per share of annual levered free cash flow, which at a 15.0x multiple would support a share price of $63.
Why the long slide?
Over the past two years, performance at SIX has been abysmal, with shares declining 32 percent. From its 52-week high, Six Flags’ stock price has plummeted more than 50 percent. What’s driven this negative performance? It boils down to one move: SIX’s pivot toward premiumization and prioritizing the maximization of per capita guest spend over attendance levels.
“Premiumization”
Viewed as a value brand by consumers, Six Flags’ decision to increase blended admission costs by 26 percent over the past 9 months was unpopular, and attendance has fallen by 25 percent over the same period. With earnings highly correlated to attendance and per capita spend, revenue and adjusted EBITDA have declined by 9 percent YTD, and net income by 28 percent.
However, much of that 25 percent decline in attendance was from people who bought heavily discounted tickets, or received free ones, and detracted from the overall experience by crowding the park. Additionally, Six Flags remains cost-competitive, with their blended average ticket costing just under $35. Perfectly in-line with their competitors.
Ticket price distribution of amusement parks (The Park Database)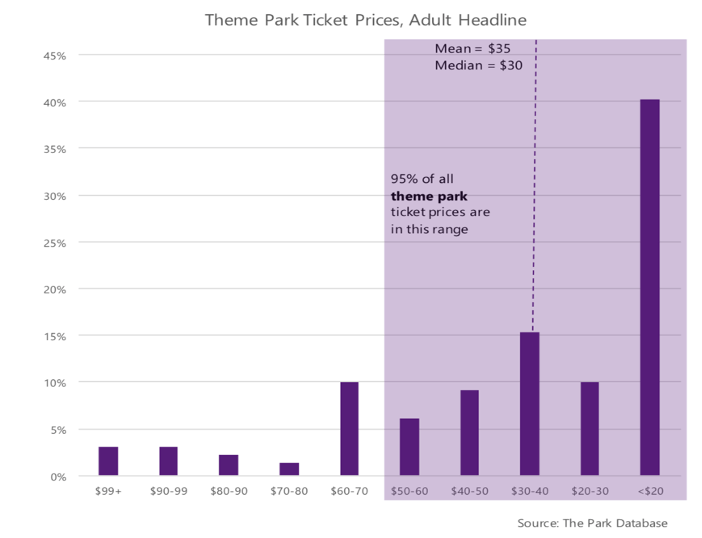
The move of Selim Bassoul, Six Flags’ CEO, to “premiumize” was a necessary evil, as it is impossible for Six Flags to continue growing attendance by a couple percentage points each year, as prior management had done, without harming the guest experience. There were only two options for SIX: (a) the company slowly increases prices, resulting in a long slide in attendance or (b) Six Flags hits the hard reset button and raises prices in a major way, causing a large, one-year decline in attendance. Mr. Bassoul chose the latter, and I believe it was the better option, as it allows investors to look into the future and get past the overhang caused by a potential long slide in attendance.
Mr. Bassoul has also been proactive in cutting down on corporate bureaucracy in response to this short-term pain. He has executed on a reduction in full-time headcount of 25 percent, an optimization of seasonal labor by adjusting staffing models, and improved park hours to maximize profitability. While many of these increased efficiencies have not managed to show themselves on the income statement as hourly wages have risen sharply. When inflation abates, Mr. Bassoul’s actions will become increasingly evident and appreciated.
Increasing capex spend
Consumers are smart, and they recognize that an amusement park like Six Flags increasing ticket costs doesn’t mean they’ll necessarily be getting more bang for their buck. Recognizing this, management has pledged major investments in their parks, and have promised to increase the amount of annual capex above their historical level of $130 million. Gary Mick, the CFO of Six Flags, said as much on the Q3 earnings call:
We’ve mentioned [on] previous calls approximately $130 million of capex spend on a go-forward basis. We intend to increase that for ’23 and ’24, pending some announcements that we plan to make in the spring.
Most of that capex spend is going towards bettering the guest experience in the form of more shaded options around parks, creating green space, having designated areas for younger children, and increasing the number of high-quality dining options.
Sell-side analysts, driven by short-term price targets and catalysts, don’t like ambiguity on big cash flow line items like capex, especially if it goes into projects which don’t directly result in more revenue, and the growing number of analyst downgrades since the beginning of the year has been driven, at least in part, by concerns over this elevated capital spending. I, however, view these investments as essential if Six Flags wishes to become a more premium brand.
High-level business model overview
I’ve detailed a lot of the challenges facing Six Flags; however, I remain bullish as the fundamentals behind SIX’s business model are incredibly attractive and deserve a closer look, both on a park and company-wide level.
Park-level economics
Six Flags’ current portfolio of theme parks has an average cost basis of $95 million each (calculated as PP&E + accumulated depreciation). To build a park today, Six Flags estimates the cost at $500 million to $700 million. However, once built, the amount of maintenance capex relative to the initial build cost is low. For example, on the 27 parks Six Flags owns, annual capex averages just $4.8 million per park, compared to average revenue per park of $51.8 million.
Furthermore, the cost base behind the parks remains relatively fixed, even as the amusement park equivalent of same-store-sales (i.e., percentage change in amount spent per guest, plus percentage change in number of guests) increases. For example, there is no marginal cost associated with charging $50 for a season pass versus $40, so any annual price increases flow through straight to EBIT. The only major floating expense associated with running a park is labor.
To break down the per park labor expense I assume that Six Flags:
- Employ 310 employees per park at any one time (approximately equal to the national average)
- Pays their employees $12.50 an hour (which they do, on average, according to Payscale)
- Are open for 8 hours a day, 335 days a year
With these assumptions, the annual labor expense at a single Six Flags location is $14 million, or ~30 percent of park-level revenue. With company-wide operating expenses hovering around 52 percent of revenue, this seems like a reasonable assumption, because investments in the park could add another 8 percent, and concessions could reasonably explain the remaining 14 percent, or $7.3 million per park.
Putting all this together, park-level EBITDA minus capex averages $25.7 million.
Six Flags’ est. park-level earnings (Author’s own work)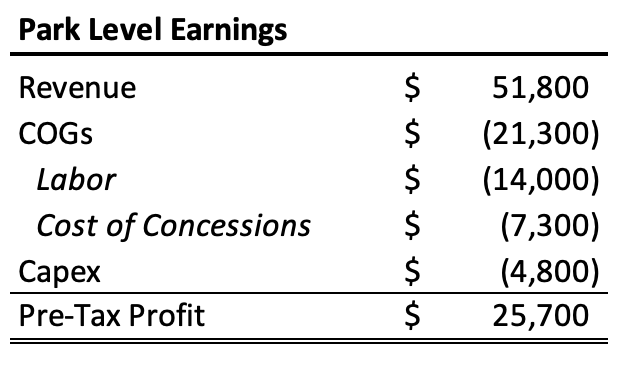
The takeaway is that park-level EBITDA minus capex is in the ballpark of $25.7 million, for a 50 percent margin. Corporate expenses are 25 percent of revenue, which gets you to the 20-25 percent EBIT margins you see on the company’s income statement.
Company-wide margins
An attractive aspect of Six Flags’ business model are the high incremental margins associated with a fixed cost base, recognized on a company-wide level, that doesn’t scale with revenue. SIX’s CEO highlighted this aspect of the business model on the Q3 call:
As we grow attendance, we expect to grow revenues ahead of costs.
This unassuming sentence vastly understates the true earnings capabilities of Six Flags.
Breaking down the cost base
SIX has two cost bases: fixed and variable. I’ll start by analyzing the former.
Fixed cost base
The fixed cost base can be broken down into three subcategories of expenses:
- SG&A: this is the bureaucracy that Mr. Boussel has been trimming over his tenure and to a great deal of success. I estimate this base to cost the company $184 million per year after Mr. Boussel’s cost cutting is fully realized, implying a 13 percent reduction in overhead.
- Interest expense: Interest is a fixed, $138 million annual expense based on last quarter’s payments. Management has expressed their desire to reduce debt to 3.0x – 4.0x EBITDA, versus 5.7x today. However, given the rise in interest rates, it’s reasonable to assume the expense remains flat, even if the overall level of debt declines.
- Capital expenditures / D&A: Management has indicated that baseline projections for capital expenditures are $130 million per year. However, keep in mind that it varies depending on the investment cycle. For the sake of projecting a fixed cost base, I’ll assume it’s $130 million.
Adding these numbers together, I estimate Six Flags’ annual fixed cost base is $452 million. All revenue above this number is subject to the variable cost base.
Variable cost base
Six Flags’ variable cost base consists of two categories:
- Operating Expenses – While a portion of this line item is fixed, it has historically tracked at 43 percent of revenue, declining only slightly if revenue growth is meaningfully higher than average.
- Cost of Product Sold – SIX’s cost of goods sold tends to float around 8 percent of company revenue, no matter the earnings level. Concessions, the main cost covered under this line item, have stable margins, no matter the amount sold.
Collectively, these two categories add up to 51 percent of revenue, implying that Six Flags’ incremental margin above every $452 million in revenue is 49 percent.
To confirm this, I plug in my numbers from above and reach an earnings before taxes (EBT) number of $232 million on the current cost base. Adjusting for extraordinary line items on the income statement and the go-forward interest expense, it’s a near perfect match: $227 million on the income statement, versus $232 million in my model.
Author’s own work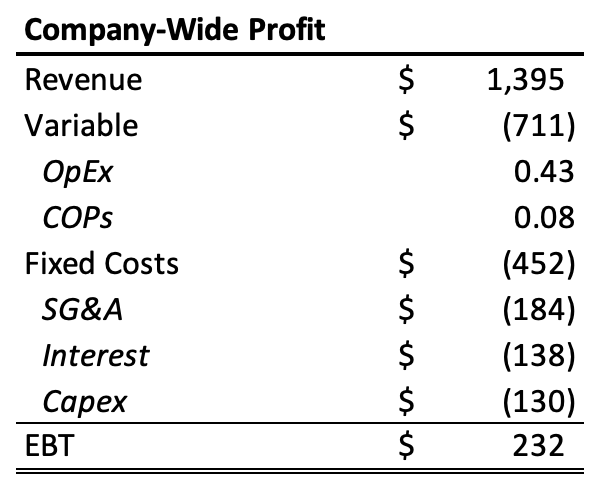
SIX in three years
To determine the value of Six Flags in three years and reach that $4.20 per share of annual levered free cash flow number I introduced in the thesis, here are the estimates I use:
- 26 million guests visit Six Flags in 2025, consistent with management’s targets
- Guest spend per capita averages $73 (that’s $45 per ticket and $28 of in-park spending)
- Revenue is $1.898 billion ($73 * 26 million)
- Fixed cost base increases marginally to $454 million
- Variable cost base is 51 percent of revenue
- Tax rate is 25 percent
- There are 85 million shares outstanding
Putting together these numbers yields a levered free cash flow number of $357 million. Dividing that by the number of shares outstanding yields a LFCF per share number of $4.20.
SIX’s bull case cash flow generation (Author’s own work)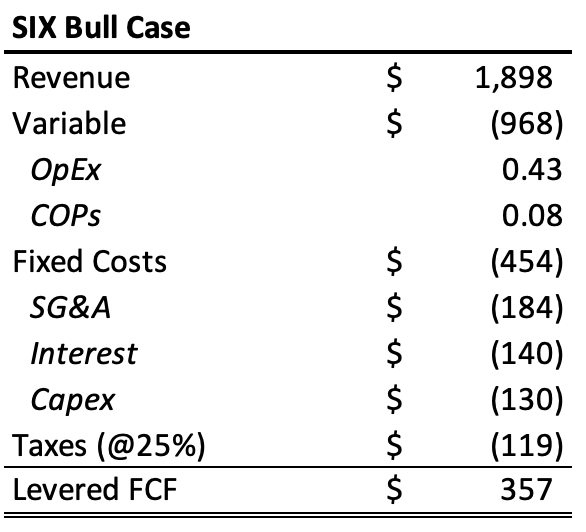
As I write this article, SIX’s share price is $23. If the stock were to go nowhere for the next three years, the stock would be trading at an 18 percent levered free cash flow yield. That would be an extraordinarily high yield. If you think a 9 percent LFCF yield is reasonable, the stock is potentially a double in three years. If you think a 5 percent yield is reasonable, the stock is nearly a four-bagger in three years.
As for me, I think a 15.0x multiple, or 6.7 percent LFCF yield is appropriate and in line with where the stock has historically traded. That would imply a stock price in three years of $63 per share, or 174 percent above where it is today.
Assessing the bear case
The major bear case for Six Flags is that attendance does not reach management’s 25 million – 27 million guest target. Right now, attendance looks on pace to hit 20 million total visitors for all of 2022. If we assume attendance doesn’t recover at all above those levels and guest spend per capita grows to just $65, Six Flags’ LFCF would decline to $149 million and levered free cash flow per share would be $1.75. Assuming a 12.0x multiple on Six Flags in this scenario, the stock would trade at $21, or approximately 9 percent below the current share price.
SIX’s bear case cash flow generation (Author’s own work)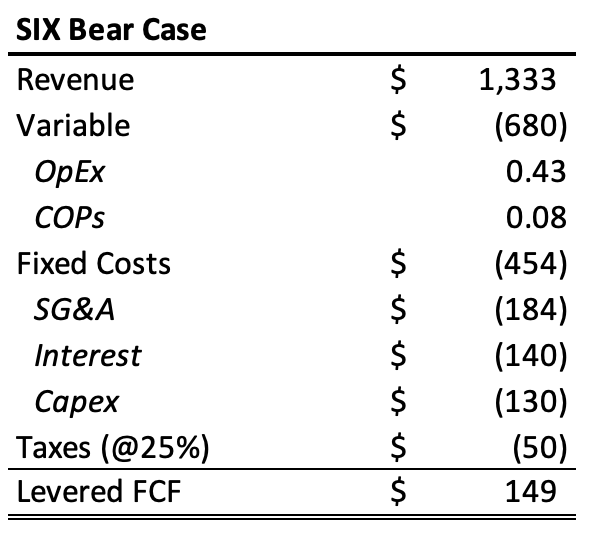
I don’t view this scenario as likely, as attendance is already at an extreme low and I see no reason why management’s 25-27 million target will not be met.
Investors should also consider Six Flags’ substantial amount of debt. Leveraged at 5.7x EBITDA, a level current management is proactively trying to get down, there exists a high degree of risk associated with investing in SIX. However, most of SIX’s debt doesn’t mature until at least 2024, and the company has not indicated that they will have issues refinancing it. Rising interest rates should also not be an issue in the near-term, as only the Second Amended and Restated Term Loan B, which has $479 million borrowed under it, is not fixed or otherwise hedged.
Timing of SIX’s LT debt (Six Flags’ 10-Q)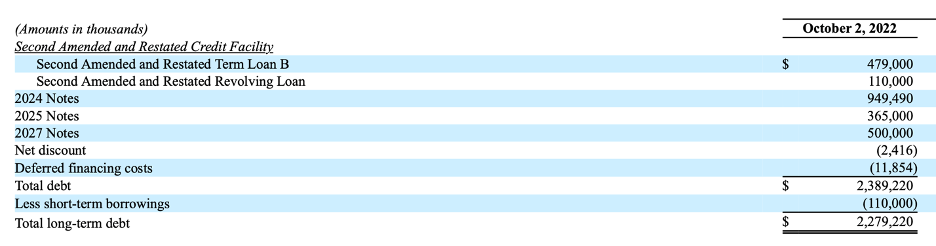
Activist interest and a potential real estate transaction
An interesting facet of the Six Flags story that’s not included in my main thesis is the potential for a REIT spinout of SIX’s real estate holdings. Activist investor Land & Buildings released a presentation detailing why they believe Six Flags’ real estate portfolio could be worth an additional $11/share in an OpCo/PropCo transaction.
The basic math behind the transaction is that if Six Flags were to spin-out the real estate they own (i.e., their theme parks and the land under them) in a REIT and lease the properties back to the OpCo (operating company), paying $205 million per year as part of the deal, the newly-formed REIT would be worth $2.8 billion at a 7.25 percent cap rate (or 13.8x EBITDA).
By Land & Buildings’ calculation the PropCo and OpCo would have a combined enterprise value of $5 billion and an equity value of $2.6 billion, versus SIX’s current $1.9 billion market cap.
PropCo/OpCo valuation (Land & Buildings)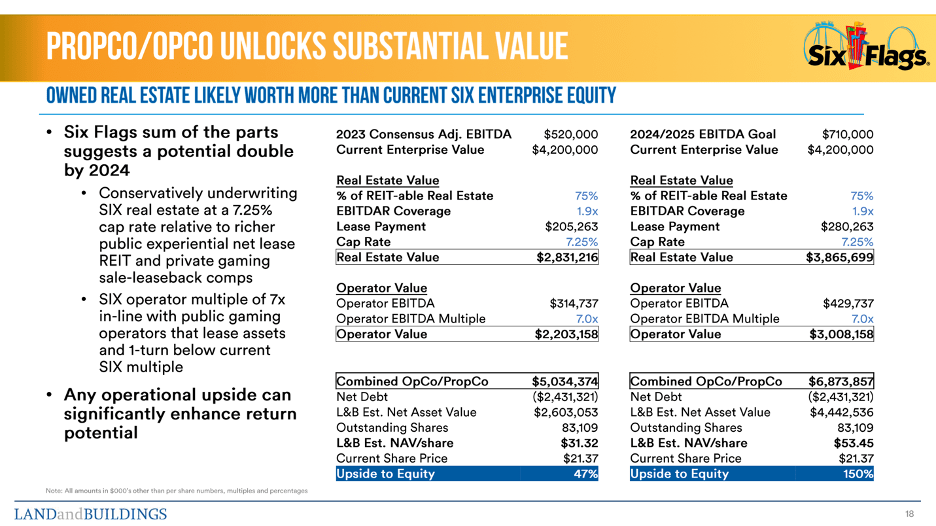
As an investor interested in Six Flags for the underlying cash flow generation, whether the OpCo/PropCo transaction occurs is irrelevant to my investment in Six Flags; if it does occur, I believe it would be accretive thanks to the tax benefits associated with REITs.
Conclusion
Six Flags is a high-quality business with attractive park-level economics and high incremental margins. Mr. Market underestimates the company’s ability to draw guests in the face of higher prices and subsequently undervalues the business’ future cash flows. Even in the bear case, where attendance doesn’t grow at all and fails to meet management’s expectations, little investor capital will likely be lost. I believe SIX is one of the more attractive risk-reward opportunities in the market today and offers an opportunity for investors to compound their capital at enviable rates of return.
Be the first to comment