

Galina Vetertsovskaya/iStock via Getty Images
Introduction
As it has been almost two years since my first article on Silgan Holdings (NYSE:SLGN) was published, it’s time to have another look at this rigid packaging, closure and dispenser producing company. In the past two years, the stock has clearly outperformed the S&P500.
Seeking Alpha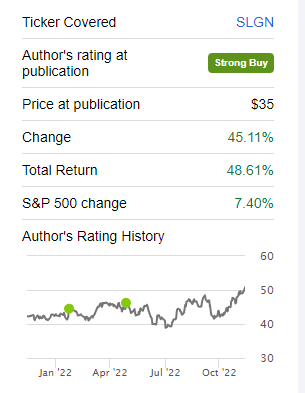
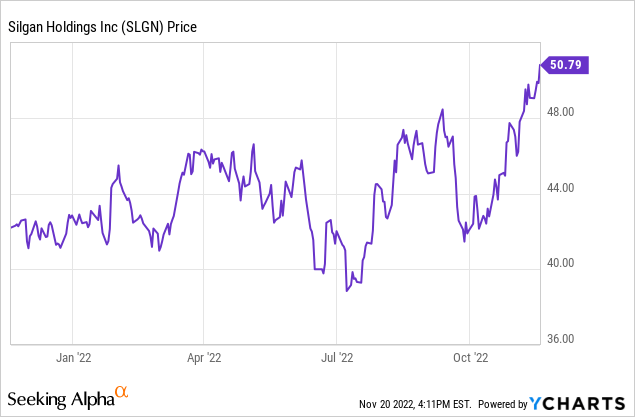
The share price is currently trading over $50 which is its all-time high. Deservedly so as the company continues its strong performance as its third quarter of this year was the best quarter in the company’s history. As this article is meant as an update to previous coverage, I’d recommend to re-read some of my older articles on SLGN to get a better understanding of what Silgan does.
A very robust set of results
The third quarter was indeed exceptionally strong for Silgan. Its revenue increased by almost 20% compared to the third quarter of last year. While a revenue increase isn’t really a big surprise in this era of high inflation, I think it’s exceptionally encouraging to see the gross profit increase at a faster pace than the revenue increase. As you can see below, the gross profit increased from just over $248M to just under $308M. That’s a 24% jump.
Silgan Investor Relations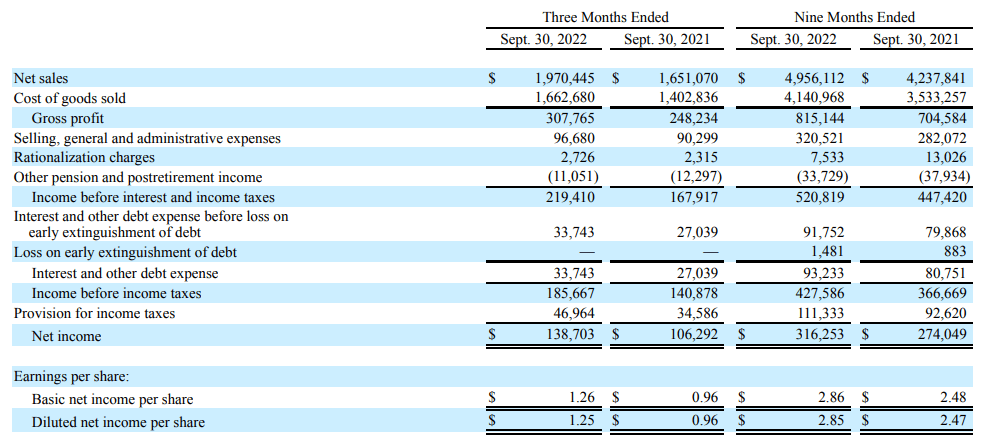
As Silgan did a good job in keeping its other operating expenses in line with the past few quarters (the SG&A expenses increased by just 7% compared to the third quarter of last year), the EBIT jumped from $168M to $219M which is a 30% increase.
The pre-tax income came in at just under $186M while the net income for the quarter was $138.7M which translates into an EPS of $1.26. That’s very strong, especially knowing the H1 EPS was just $1.60 so the third quarter didn’t disappoint this year.
Unfortunately this does not translate into a strong reported free cash flow result. As you can see below, Silgan’s first nine months of the year are traditionally pretty working capital heavy. The receivables and inventories increased by in excess of half a billion while the company also paid $166M in payables. This resulted in a reported operating cash flow of minus $117.5M, but after adjusting this for changes in the working capital, the underlying operating cash flow was $536M. A nice increase compared to the $459M generated in the first nine months of last year.
Silgan Investor Relations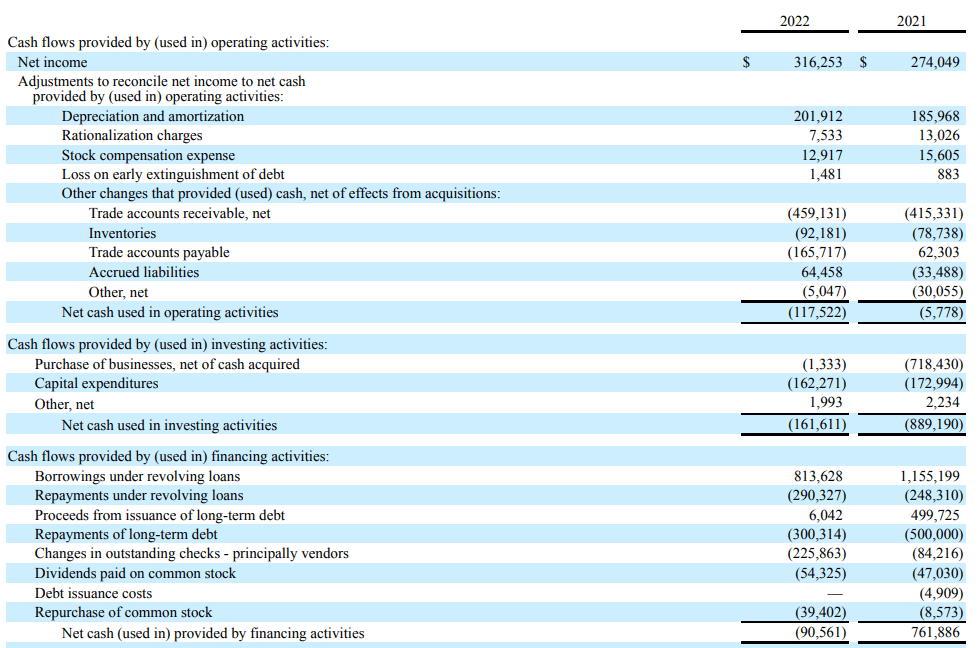
The total capex during the first nine months of the year was just over $162M, resulting in a free cash flow of $372M compared to $286M in the same period last year. The free cash flow per share came in at $3.38.
Unfortunately Silgan did not provide a specific Q3 cash flow result, but after comparing the 9M 2022 results with the H1 results which showed an adjusted operating cash flow of $335M and a $118M capex, the Q3 results were pretty strong. The adjusted operating cash flow was just over $200M and considering the Q3 capex was just $44M, the adjusted free cash flow in the third quarter was approximately $157M. Divided over the 110M shares that are currently outstanding, the free cash flow result in the third quarter equalled approximately $1.43 per share.
The full-year guidance now appears to be very achievable
Silgan Holdings has tightened its earnings guidance and the company now expects to report earnings of $3.9-4.00 per share while guiding for a $350M free cash flow result. Keep in mind Silgan’s free cash flow guidance traditionally includes changes in the working capital position. This means that – considering the reported free cash flow was a negative $280M in the first nine months of the year – Silgan is guiding for a reported free cash flow result of $630M in the final quarter of the year.
That also is the main reason why I’m not too worried about the build-up in working capital elements. The fourth quarter traditionally is the quarter Silgan is able to monetize a substantial portion of those elements.
Silgan Investor Relations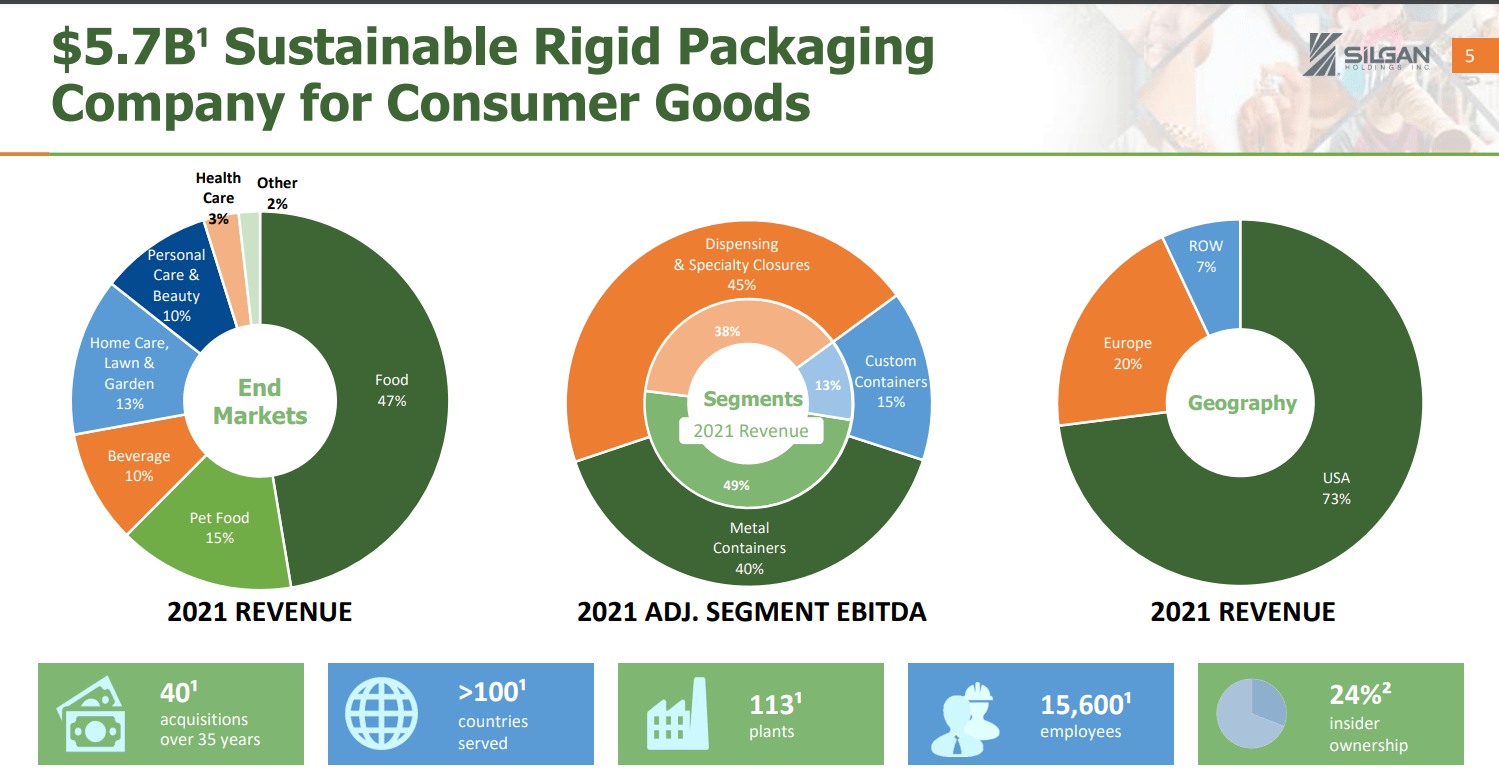
The underlying free cash flow result (excluding changes in the working capital position) will obviously be much lower. Silgan is guiding for an EPS of $0.76-0.86 in the final quarter of the year and considering the capex usually is slightly lower than the depreciation expenses, I would argue the FCFPS will likely come in at around $0.85-0.95 per share. This would push the full-year free cash flow result to around $4.25 per share.
Silgan Investor Relations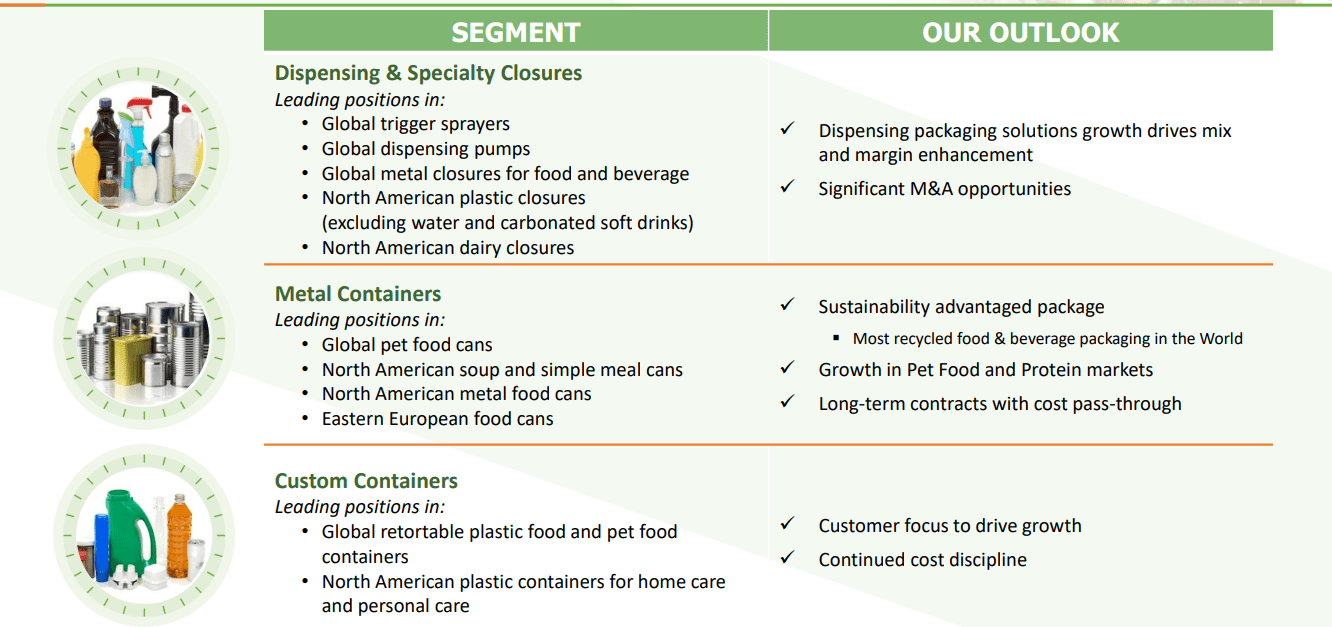
Investment thesis
Despite the recent run-up in its share price, Silgan isn’t expensive yet. Based on the full-year expectations, the stock is still trading at a free cash flow yield of approximately 8.5% which is very reasonable considering Silgan should be in a good position to hit the ground running in 2023.
While the current quarterly dividend of $0.14 represents a yield of less than 1.2%, income-focused investors could perhaps have a look at the bonds issued by Silgan Holdings as the 3.5 year bonds and the 5.5 year bonds have a yield to maturity of respectively 6% and 5.95% (based on the midpoint between bid and ask as of the closing bell on Friday).
Be the first to comment