mathieukor/E+ via Getty Images
Price Action Thesis
Sibanye Stillwater (NYSE:SBSW) is a well-known platinum and palladium mining company among retail investors. SBSW has significantly outperformed the S&P 500 ETF (SPY) over the past five years, despite its recent tumbles. Its 5Y performance of 140.67% (CAGR: 19.18%) easily surpassed the SPY’s 8.55% 5Y CAGR.
However, our price action analysis suggested such good times may be over since its double-top bull trap in March 2022. However, it’s likely at a near-term bottom with a validated bear-trap re-test signal. But we believe it’s appropriate only as a Speculative Buy entry, but not one for the long-term, as it’s now mired in bearish momentum.
Our reverse cash flow valuation analysis also indicates that Sibanye Stillwater could disappoint at the current levels if investors choose to hold for the longer term.
Accordingly, we rate SBSW as a Speculative Buy with a near-term price target of $12.50, which implies a potential upside of 14.8%. However, investors should avoid adding above $11 and wait for a retracement to add.
The SBSW Party Ended With The Twin Double-Tops
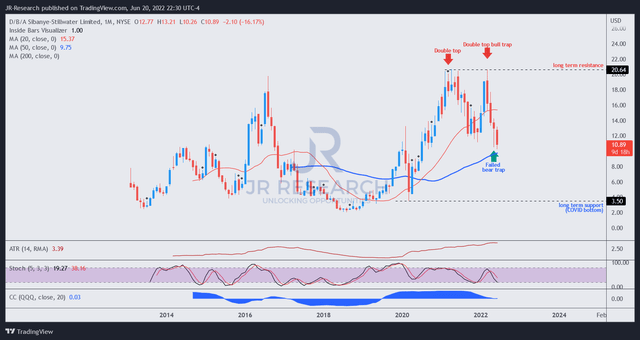
SBSW price chart (monthly) (TradingView)
Price action investors pay particular attention to the threat of double-top bull traps, as they often portend early warning signs of significant tops. Notably, SBSW formed a couple of double-tops over the past year, indicating the market drew in buyers rapidly.
As a result, the steep 47.2% decline after its second double-top in March 2022 should not be surprising.
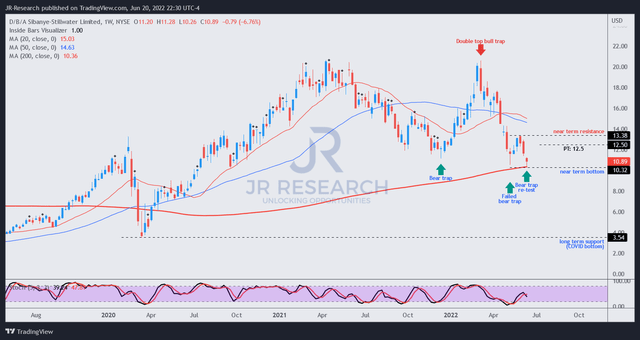
SBSW price chart (weekly) (TradingView)
Poring into its weekly chart, we can visualize the menace of its second double-top in March 2022. Notably, there was a validated bear trap in December 2021, which stanched the previous decline from its first double-top in April 2021. However, its December bear trap has been resolved with the formation of the March double-top.
There was an attempt to bottom with a bear trap in May, which was eventually rejected at its near-term resistance. Therefore, investors must be careful in adding on the initial bear traps after potent double-top bull traps, as they are unlikely to be reliable. Therefore, investors should be patient to wait for a validated re-test.
Notably, there was a validated bear trap re-test that formed last week (week of June 13), giving a Buy signal.
However, investors must continue to give precedence to its double-top in March until we observe another higher high or a double-bottom bear trap.
Therefore, we believe it’s appropriate to use a price target (PT) below its near-term resistance for the current speculative opportunity.
SBSW Valuation Is Not Attractive
| Stock | SBSW |
| Current market cap | $7.57B |
| Hurdle rate (CAGR) | 19% |
| Projection through | CQ2’26 |
| Required FCF yield in CQ2’26 | 15% |
| Assumed TTM FCF margin in CQ2’26 | 14% |
|
Implied TTM revenue by CQ2’26 |
$16.27B |
SBSW stock reverse cash flow valuation model. Data source: S&P Cap IQ, author
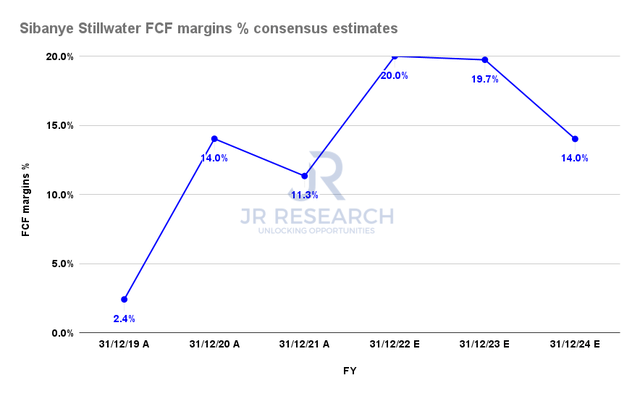
Sibanye Stillwater FCF margins % consensus estimates (S&P Cap IQ)
Of notable concern is its falling free cash flow (FCF) profitability projections as seen in the Street’s consensus (Bullish, 6/7 analysts with Buy/Strong Buy ratings) above. Therefore, even the Bullish Street analysts suggest a steep decline in its FCF margins, which should raise a red flag for investors to consider.
Accordingly, our reverse cash flow valuation model indicates that SBSW stock could underperform its 5Y CAGR of 19% even after its steep fall from its March highs.
We used its 5Y CAGR as our hurdle rate and also assumed an FCF yield lower than its 5Y mean of 16.27% (current NTM FCF yield: 24.06%). We believe the market’s requirement for higher FCF yields is justified given the volatility in its FCF margins.
Moreover, we also used a TTM FCF margin of 14% modeled after its FY24 estimates and derived a TTM revenue requirement of $16.27B by CQ2’26.
Investors need to note that further adjustments to its FCF profitability could markedly impact its valuation. Therefore, conservative investors should consider using higher FCF yields to compensate for the risk or use lower FCF margins assumptions.
The bullish consensus estimates indicate that Sibanye Stillwater could deliver revenue of $9.49B in FY24, which is identical to its FY22 estimates.
Therefore, we believe investors looking for similar 5Y outperformance from SBSW moving forward could be disappointed. Accordingly, investors should reduce their longer-term hurdle rate assumptions to model for a performance that they believe justify the risk/reward profile of holding SBSW stock.
Is SBSW Stock A Buy, Sell, Or Hold?
We rate SBSW stock as a Speculative Buy with a PT of $12.50 (an implied upside of 14.8%). However, we urge investors to use an appropriate risk management strategy to prevent outsized losses if the bear trap does not hold.
We continue to give precedence to its double-top bull trap until a double-bottom bear trap or signs of higher lows are seen in its trend. Therefore, near-term caution is warranted.
In addition, we urge investors to consider their assumptions of what performance they expect SBSW to deliver over the next four/five years.
Notably, our valuation analysis indicates that SBSW could struggle to meet its 5Y CAGR performance of 19%.


Be the first to comment