

hapabapa
Upstream indicators of inflation (labor market tightness, commodity prices, supply chain pressure, prices paid by manufacturers, etc.) are normalizing and yet consumer price inflation remains high. Some of this is due to the time lag between when cost pressures ease and when they feed through to consumer prices, but an increasingly large part of this is due to how CPI is calculated.
Shelter is a large component of the consumer price index, but due to the way it is calculated it significantly lags current market conditions. As a result, a large portion of current inflation actually occurred last year and is only now showing up in the statistics. This is problematic because monetary policy is trying to stop inflation that has already occurred, and in the process harming the economy.
Figure 1: Upstream Inflation Indicator (source: Created by author using data from The Federal Reserve)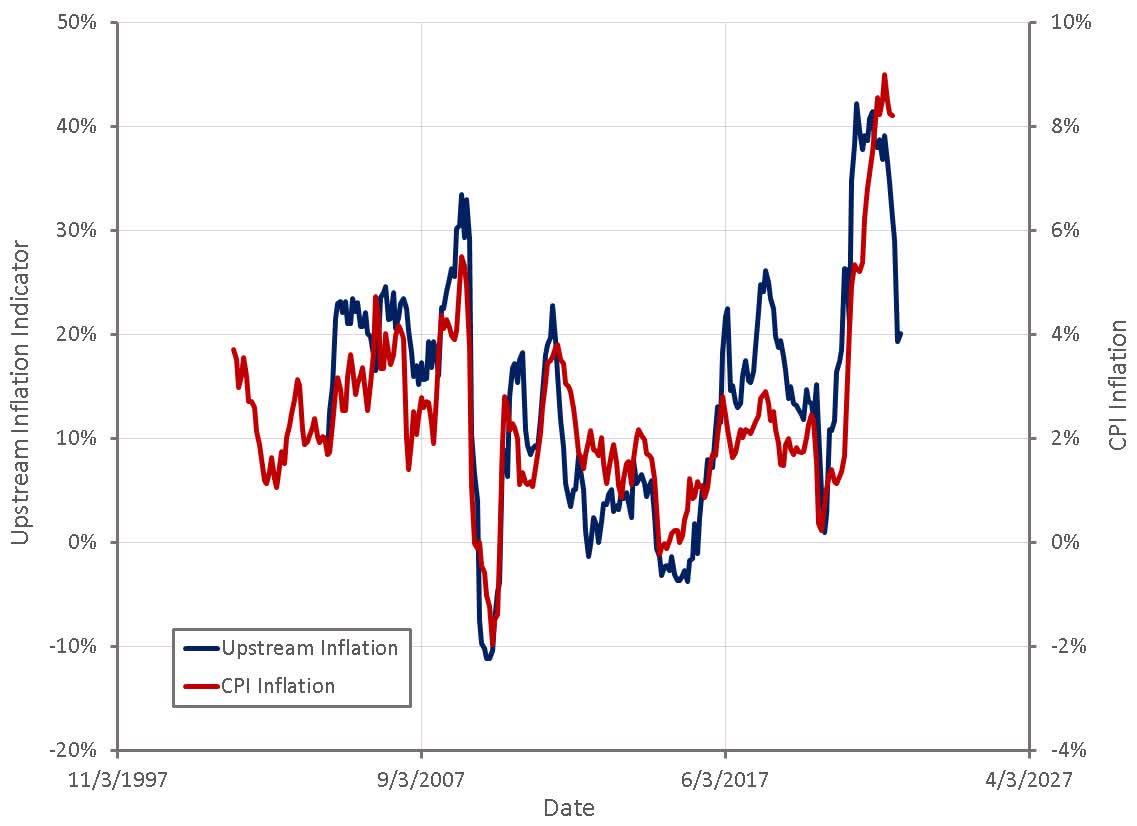
Housing constitutes approximately a third of the consumer price index, and consists of rent and owners’ equivalent rent components. The rental component is essentially a moving average of current market rental rates, as the BLS periodically samples tenants and updates the index when their rent changes. Rents generally only change when a lease expires though (typically annually), meaning that the index will only progressively adjust as each tenant’s lease expires. From a CPI perspective this is accurate as it captures what consumers are currently actually paying. When market conditions are rapidly changing it introduces a large lag though, and means that CPI is reflecting market conditions from up to 12 months ago.
For owner occupied housing, the BLS computes an Owner’s Equivalent Rent based on what it would cost the owner to rent a similar place. This is imputed from the average rents paid for comparable rental housing within the same area.
There is a range of data available showing current market rents, which increased rapidly in 2021 and early 2022 and now appear to have peaked. High shelter inflation in recent months is largely the result of CPI catching up with inflation that has already occurred.
Figure 2: Lag Between Shelter CPI and Current Market Prices (source: Created by author using data from Zillow and The Federal Reserve)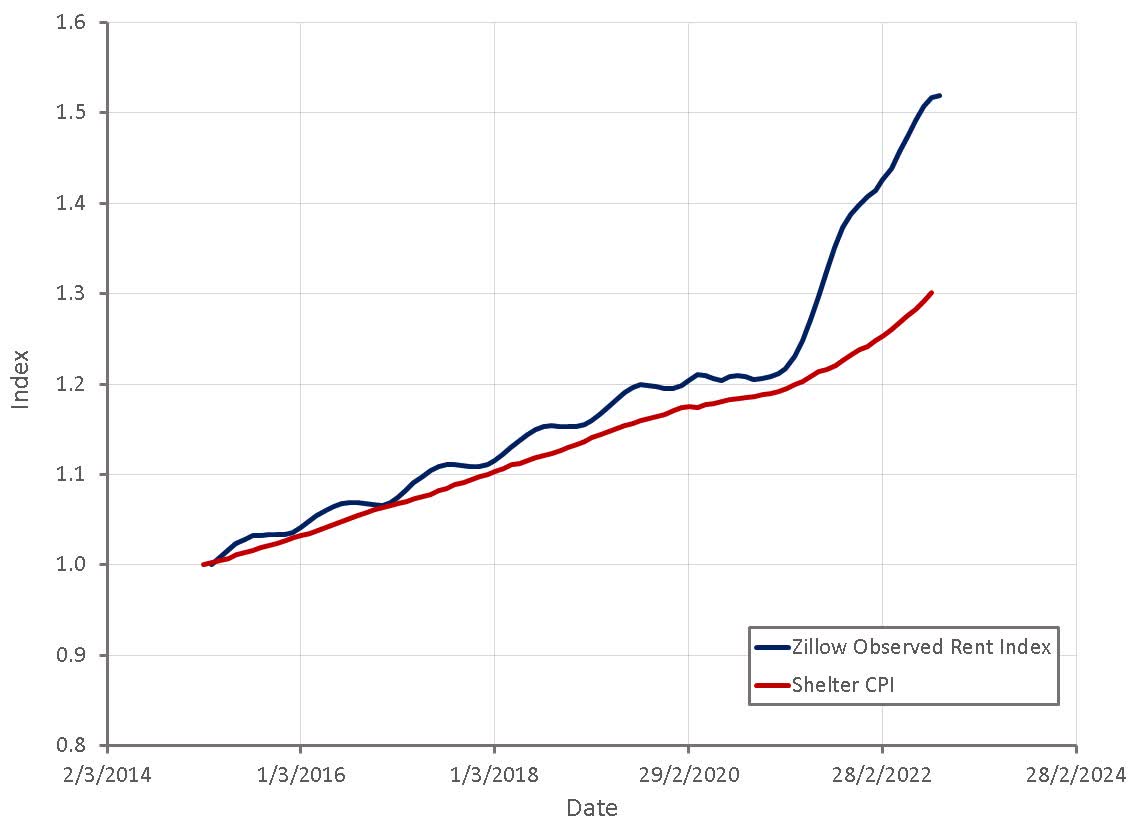
The rental market has already softened significantly, and current apartment rental market conditions are typically associated with rent inflation of around 1.5%.
Figure 3: NMHC Apartment Market Tightness Index (source: Created by author using data from NMHC and The Federal Reserve)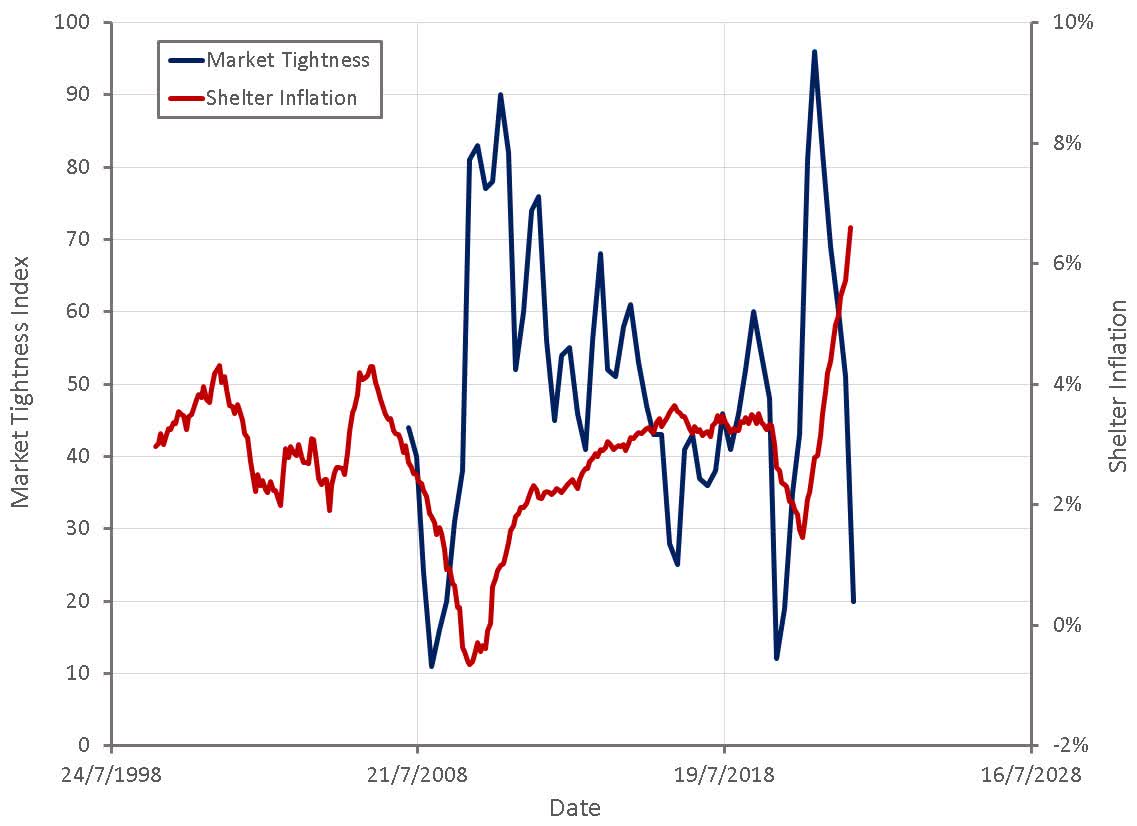
Shelter inflation is currently high, and will remain high in coming months due to the calculation method. Because shelter is high and has a large weight in the CPI basket, it has been responsible for a large proportion of core inflation in recent months and will likely continue to dominate core inflation in the coming months.
Figure 4: Contribution of Shelter Inflation to Core CPI Inflation (source: Created by author using data from The Federal Reserve)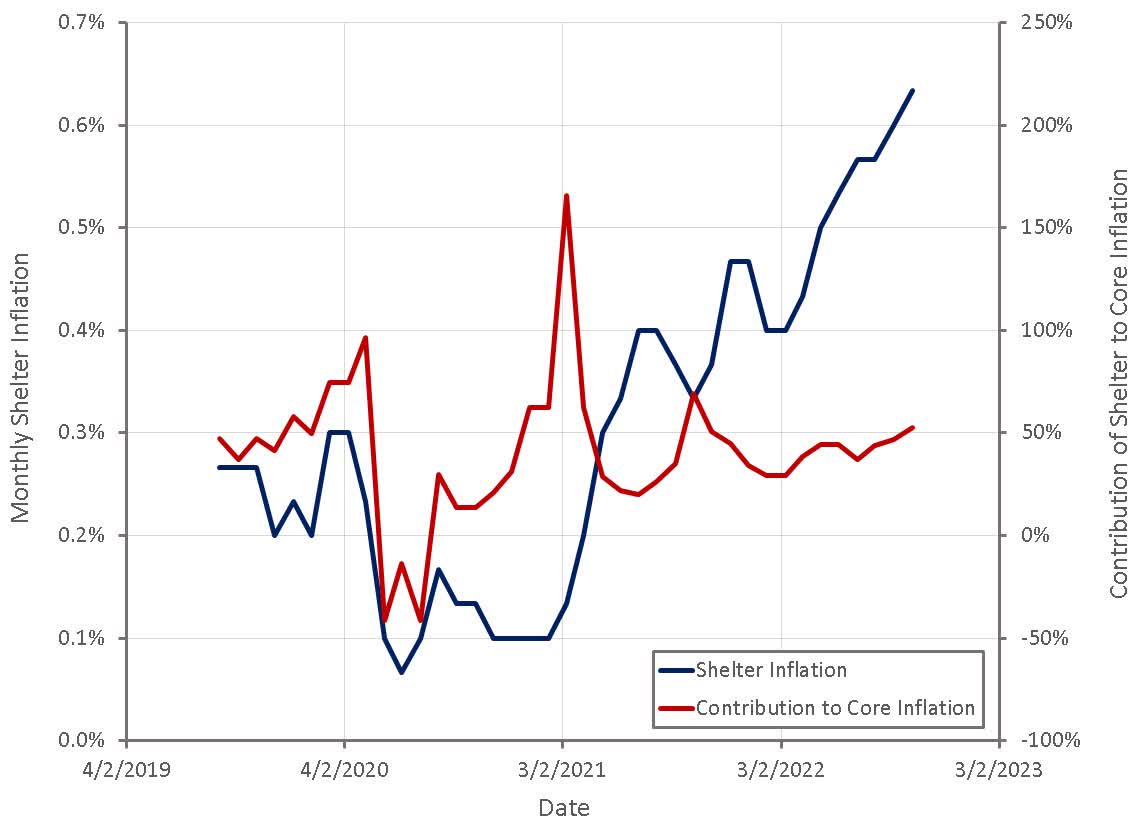
There are a range of indicators which point towards a decline in actual home ownership/rental costs going forward, even if this is not reflected in BLS statistics. Home prices tend to lead shelter inflation and have already peaked.
Figure 5: Home Prices and Shelter Inflation (source: Created by author using data from The Federal Reserve)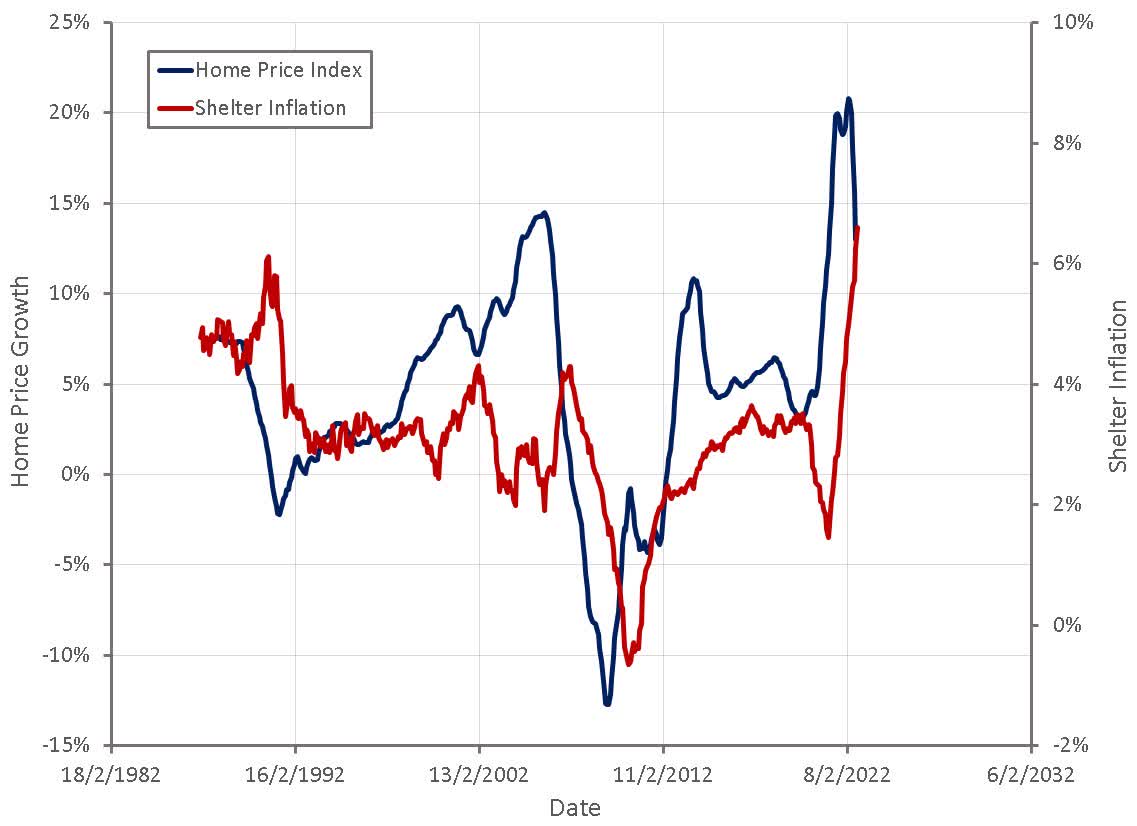
After accounting for income and mortgage rates, house prices are now at record levels. This has caused the housing market to grind to halt, as potential buyers are unwilling or unable to purchase at current prices.
Figure 6: Housing Affordability Index (source: Created by author using data from The Federal Reserve)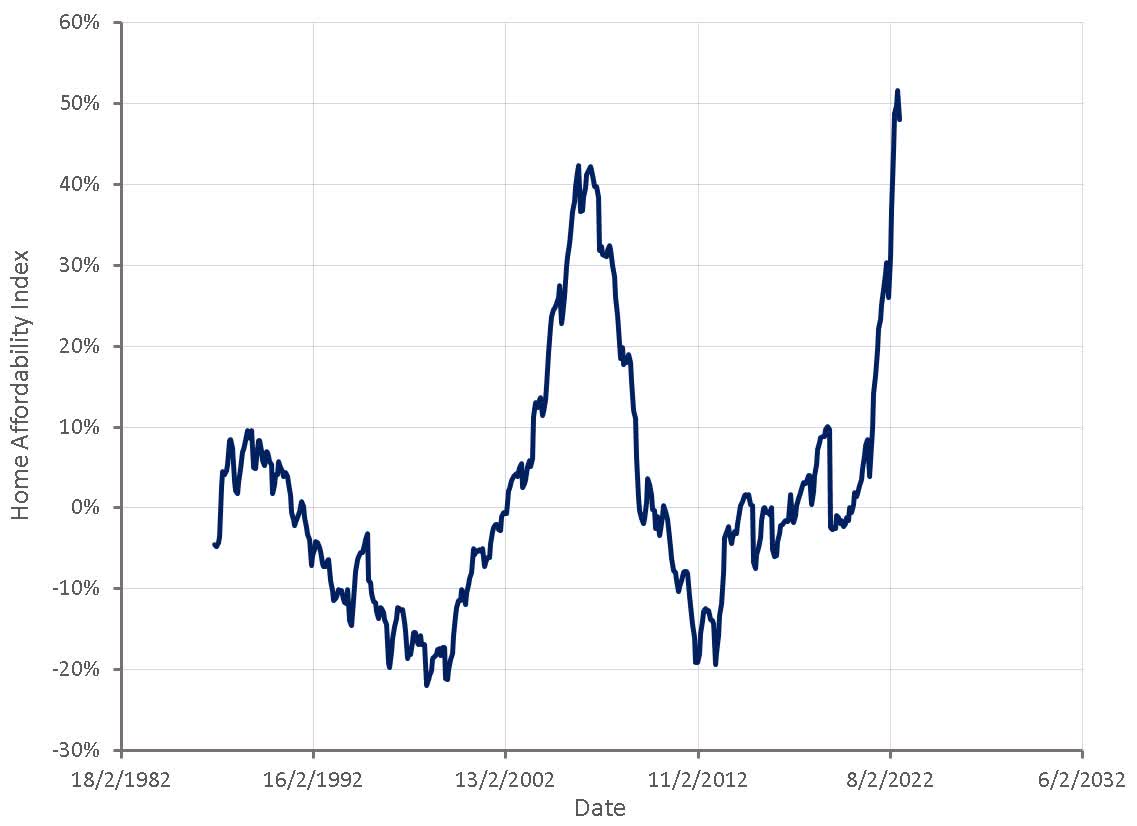
In the past, housing affordability has been a reasonable predictor of future house price appreciation. Absent a large decline in mortgage rates it seems likely that home prices will decline significantly from current levels.
Figure 7: Housing Affordability and Future Housing Returns (source: Created by author using data from The Federal Reserve)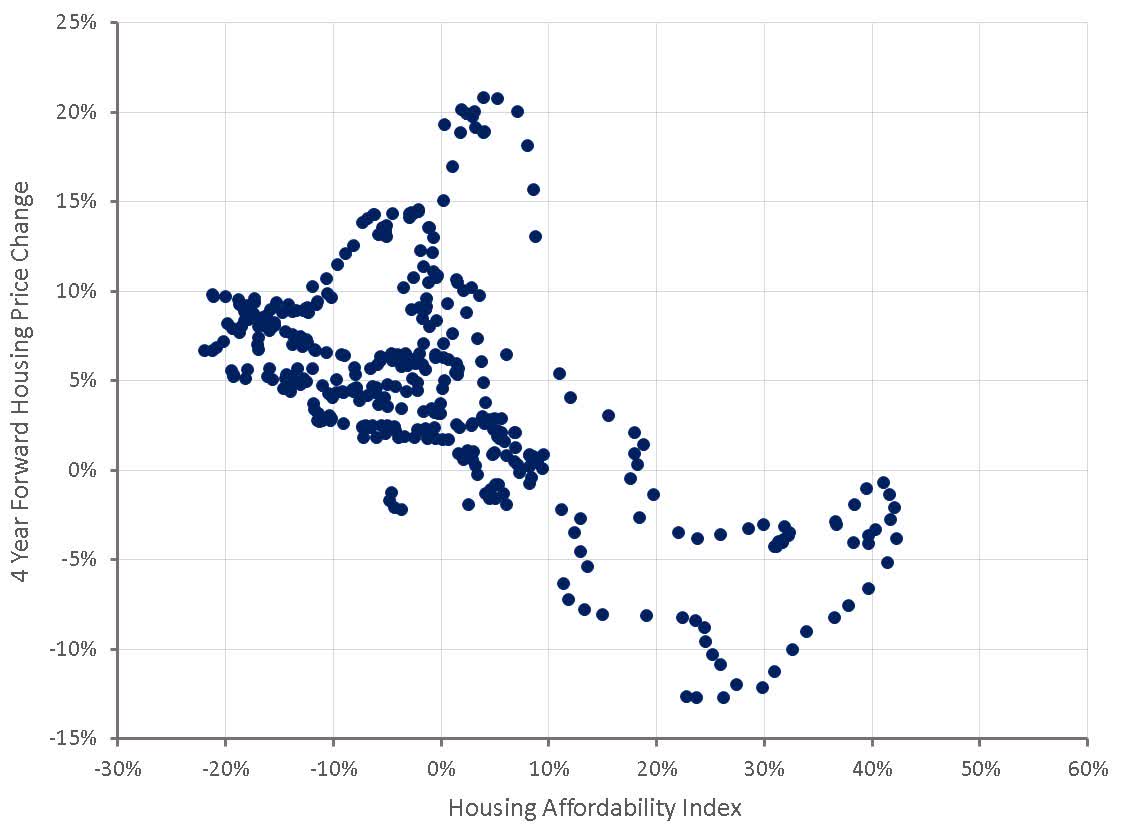
The supply of homes on the market is also a good indicator of how house prices are likely to change. The supply of existing homes is currently low (approximately 3.2 months of sales), but this is not necessarily a good indicator of market conditions. The current market is less the result of a lack of housing and more due to an unwillingness of sellers to accept the prices that buyers are able to afford. This situation will take time to resolve as sellers come to realize that they will need to accept lower prices if they want to sell.
The supply of new homes is quite high (9.2 months of sales) and will remain high as the backlog of homes currently under construction continues to make its way onto the market. This level of supply is typically associated with a correction in housing prices.
Figure 8: Months of Supply of New Houses and Housing Price Changes (source: Created by author using data from The Federal Reserve)
Post-pandemic economic activity is normalizing in a number of sectors (e.g. transportation) and activity is collapsing in more interest rate sensitive areas of the economy (tech, real estate). Layoffs appear to be accelerating, and while this may currently be fairly constrained to a small part of the economy, this process is just beginning. Based on internet search interest, economic uncertainty is high, which is typically associated with a reduction in consumer spending. A feedback loop between recessionary fears and consumer spending will probably occur, accelerating the slowdown that is already underway.
Figure 9: Recessionary Fears and Consumer Spending (source: Created by author using data from Google Trends and The Federal Reserve)
Conclusion
A recession is being engineered to try and prevent something that happened last year. Shelter inflation is likely to increase or at least remain high in coming months, giving the Fed an excuse to continue raising rates if they so desire. The economy is already faltering, but is still being held up by strong consumer spending, which is at unsustainable levels. The current state of real estate markets and the impending reduction in consumer spending is far more concerning than last year’s inflation. This situation should be favorable for government bonds once recessionary fears begin to outweigh inflation concerns. Equity markets do not currently appear to be pricing in a significant fall in profitability for most companies, creating downside risk.
Be the first to comment