

sankai
Services are nearly two-thirds of consumer spending. That’s where inflation is now raging. The Fed has been talking about services for months.
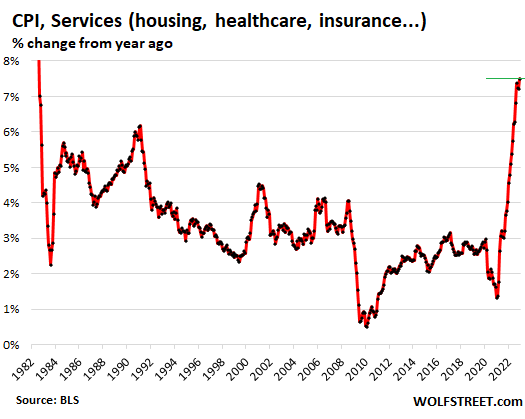
Nearly two-thirds of consumer spending goes into services. Services include housing, insurance, healthcare, education, travel and hotel bookings, subscriptions, streaming, telecommunication, haircuts… And this is where inflation is now raging.
This is where inflation has gotten entrenched, while prices of durable goods are unwinding the pandemic spike, and while energy prices plunged, and food prices slowed their increase, according to the CPI data released Thursday by the Bureau of Labor Statistics. Month-over-month and year-over-year:
- Services: +0.6%; +7.5%
- Durable goods: -0.8%; -0.1%
- Food: +0.3%; +10.4%
- Energy: -4.5%; +7.3% (gasoline: -9.4%; -1.5%)
- Core CPI (without food and energy): +0.3%; +5.7%
- CPI overall: -0.1%; +6.5%.
Inflation rages in services
We’ll start with services because services are such a big part of consumer spending and are therefore so important to consumers. The Fed has been talking about inflation in services for months. I have been talking about it for nearly a year. The CPI for services spiked by 0.6% in December from November, and by 7.5% year-over-year, the worst year-over-year increase since 1982. And it was the fourth month in a row over 7%:
Services by category
The health insurance adjustment. The spike in the services CPI occurred despite the ongoing massive mega-downward adjustment of health insurance. Without that adjustment, services CPI would have been even worse.
The BLS undertakes annual adjustments in how it estimates the costs of health insurance and then spreads those adjustments over the following 12 months. December was the third month (I’ve discussed this in greater detail here).
Due to this adjustment, the CPI for health insurance plunged by 3.4% in December from November. These three months of mega-adjustments reduced the year-over-year rate of the CPI for health insurance from 28% in September to 7.9% in December.
Health insurance is part of medical care services, and so that adjustment knocked down the CPI for medical care services as well. In the chart below, both are indicated in red.
| Services | MoM | YoY |
| Overall services | 0.6% | 7.5% |
| Airline fares | -3.1% | 28.5% |
| Motor vehicle insurance | 0.6% | 14.2% |
| Motor vehicle maintenance & repair | 1.0% | 13.0% |
| Pet services, including veterinary | -0.4% | 9.1% |
| Rent of primary residence | 0.8% | 8.3% |
| Owner’s equivalent of rent | 0.8% | 7.5% |
| Recreation services, admission to movies, concerts, sports events | 0.3% | 5.7% |
| Other personal services (dry-cleaning, haircuts, legal services…) | -0.2% | 5.5% |
| Water, sewer, trash collection services | 0.3% | 4.9% |
| Postage & delivery services | 0.2% | 4.6% |
| Video and audio services, cable | 0.9% | 4.2% |
| Hotels, motels, etc. | 1.7% | 3.2% |
| Telephone services | 0.3% | 1.9% |
| Car and truck rental | -1.6% | -4.9% |
| Medical care services | 0.1% | 4.1% |
| Includes: Health insurance | -3.4% | 7.9% |
The CPI for housing as a service (shelter)
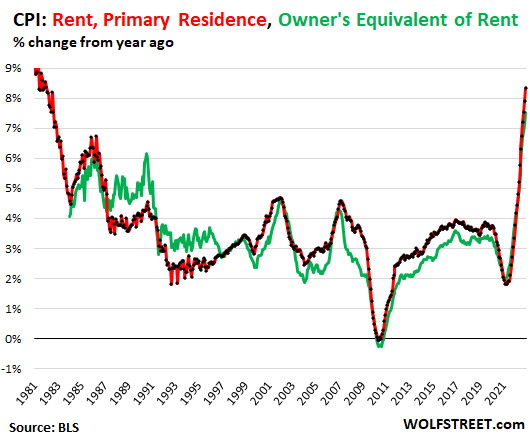
The CPI for “rent of shelter,” which accounts for 32.6% of total CPI, tracks housing costs as a service, not as an investment, and is based on rents:
“Rent of primary residence” (accounts for 7.5% of total CPI) spiked by 0.8% for the month and by 8.3% year-over-year, the highest since 1982. It tracks actual rents paid by a large panel of tenants, including in rent-controlled apartments (red in the chart below).
Other rent indices, including Zillow’s rent index, track “asking rents,” the advertised rents that landlords wish to charge future tenants. When asking rents are too high to fill the units, landlords may lower the asking rent. There was a boom in asking rents during the pandemic as landlords got a little crazy.
But rentals don’t turn over every day, and proportionately not many people actually ended up paying those asking rents, and these sky-high asking rents never fully made their way into actual rents. They were mostly a landlord wish list, which is now getting trimmed back to reality.
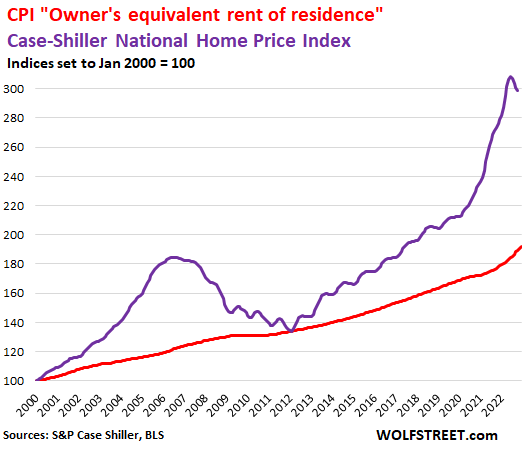
“Owner’s equivalent rent of residences” (accounts for 24.2% of total CPI) jumped by 0.8% for the month and by 7.5% year-over-year, the worst in the data. It tracks the costs of homeownership as a service, based on what a large panel of homeowners report their home would rent for (green line).
Home prices started to decline in 2022, according to the Case-Shiller Home Price Index [see The Most Splendid Housing Bubbles in America]. The most recent data point available is the three-month moving average of September, October, and November (purple line in the chart below).
The red line represents “owner’s equivalent rent of residence.” Both lines are index values, not percent-changes of index values:
Durable goods prices dropped
The CPI for durable goods fell for the fourth month in a row, -0.8% for the month, after the ridiculous spike that started in late 2020, extended through 2021, and part of 2022, before unwinding. This whittled away the remainder of the year-over-year gain and turned it negative, if barely: -0.1%.
The CPI for durable goods, expressed as index value, not as percent-change of the index value, depicts how ridiculous the situation had gotten in 2021 and through mid-2022, and how prices have started to drop from the ridiculous spike. The largest categories in this index are new vehicles and used vehicles.
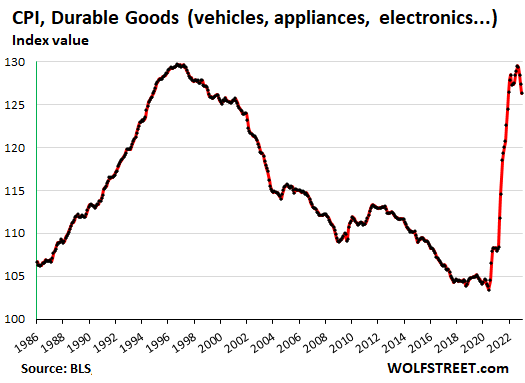
In normal years since the 1990s, after “hedonic quality adjustments” were incorporated, the CPI for durable goods tended to be negative. Inflation is supposed to measure prices of the same product over time.
But due to constant improvements of motor vehicles (for instance the move with F-150 trucks from a three-speed automatic transmission back in the day to the now standard 10-speed automatic), adjustments are made to remove the costs of these improvements from the index, which causes the index to decline in normal times:
| Durable goods by category | MoM | YoY |
| Durable goods overall | -0.8% | -0.1% |
| Information technology (computers, smartphones, etc.) | -0.9% | -11.8% |
| Used vehicles | -2.5% | -8.8% |
| Sporting goods (bicycles, equipment, etc.) | -0.5% | 3.5% |
| New vehicles | -0.1% | 5.9% |
| Household furnishings (furniture, appliances, floor coverings, tools) | 0.2% | 7.3% |
Food inflation
The CPI for “Food away from home”– prices at restaurants, vending machines, cafeterias, sandwich shops, etc. – rose by 0.4% for the month and by 8.3% year-over-year, the fourth month in a row of around 8.5%, the worst since 1981.
The CPI for “food at home” – food bought at stores and markets – rose by 0.2% for the month and 11.8% year-over-year, the 10th month in a row with double-digit year-over-year increases.
Overall, the increases are slowing. Some prices have started to retreat, while others still spiked, such as eggs, which spiked 11% for the month and 60% year-over-year, due to issues triggered by the avian flu:
| Food inflation by category | MoM | YoY |
| Overall Food at home | 0.2% | 11.8% |
| Cereals and cereal products | 0.0% | 16.1% |
| Beef and veal | 1.3% | -3.1% |
| Pork | -0.2% | 1.5% |
| Poultry | -0.6% | 12.2% |
| Fish and seafood | -0.7% | 5.0% |
| Eggs | 11.1% | 59.9% |
| Dairy and related products | -0.3% | 15.3% |
| Fresh fruits | -1.9% | 3.4% |
| Fresh vegetables | -0.1% | 9.8% |
| Juices and nonalcoholic drinks | 0.0% | 12.2% |
| Coffee | 0.0% | 14.3% |
| Fats and oils | 1.5% | 23.2% |
| Baby food | -0.2% | 10.7% |
| Alcoholic beverages at home | 0.6% | 5.3% |
Energy prices plunged in December
Gasoline prices plunged further in December and were down 1.5% year-over-year. This, and the plunge in heating oil in December, pushed down the overall energy CPI for the month to -4.5% and slashed its year-over-year gain to +7.3%. But natural gas still rose:
| Energy | MoM | YoY |
| Overall Energy CPI | -4.5% | 7.3% |
| Gasoline | -9.4% | -1.5% |
| Utility natural gas to home | 3.0% | 19.3% |
| Electricity service | -0.2% | 13.7% |
| Heating oil, propane, kerosene, firewood | -11.9% | 26.0% |
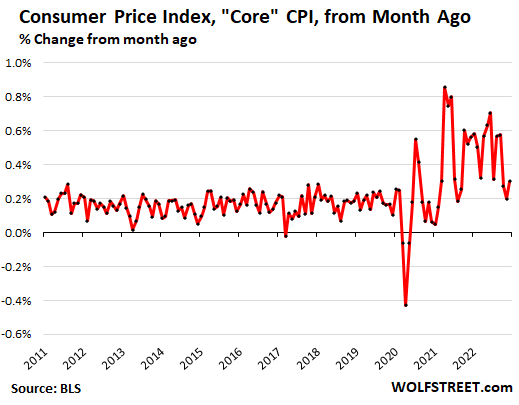
“Core CPI”
The core CPI, which excludes the volatile food and energy products, rose 0.30% for the month, an acceleration from November (+0.20%) and from October (+0.27%):
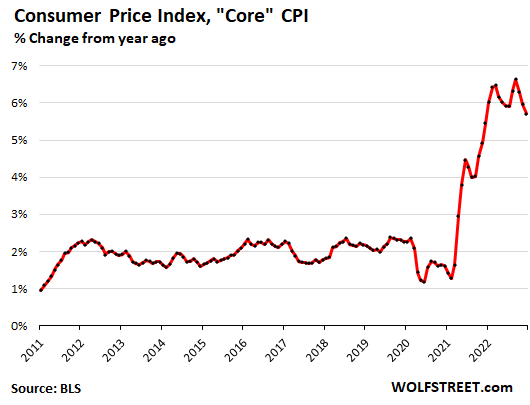
Year-over-year, core CPI jumped 5.7%:
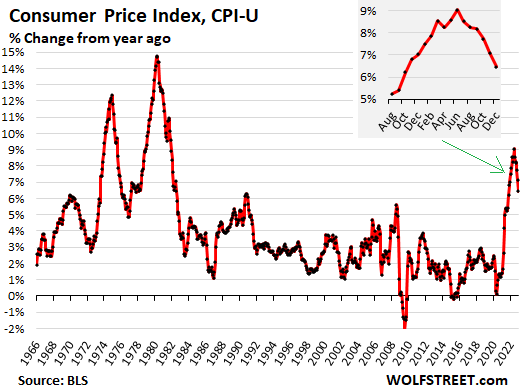
Overall CPI
Pushed up by services and pushed down by plunging energy and durable goods, the all-items CPI-U dipped 0.1% for the month, which whittled its year-over-year increase to 6.5%:
Editor’s Note: The summary bullets for this article were chosen by Seeking Alpha editors.
Be the first to comment