

DNY59
Stocks got off to a fast start in September. The S&P 500 jumped 4% through Monday the 12th following a strong U.S. employment report and generally improving inflation data. That came on the heels of a very hawkish speech by Federal Reserve Chair Jerome Powell at Jackson Hole in late August.
Then came a much hotter than expected Consumer Price Index report on Tuesday, Sept. 13. That sparked a continuation of the sharp drop that began in mid August. The S&P 500 took a sniff of its falling 200-day moving average back then but has since plunged about 15%. The large-cap index printed fresh 2022 lows during the end of the month as rising interest rates, wild currency moves, and a slew of bearish earnings preannouncement reports rocked Wall Street.
S&P 500 ETF: A Strong September Selloff Following A Summer Rally, Retesting June Lows
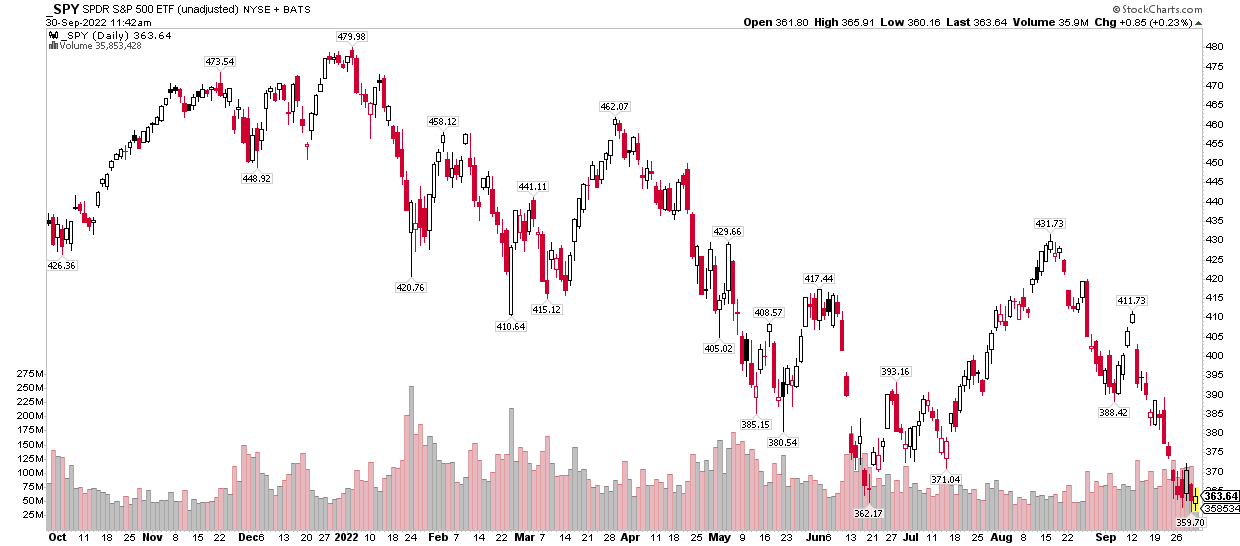
Stockcharts.com
In all, the S&P 500 fell nearly 8% while small caps, as measured by the iShares Russell 2000 ETF (IWM) dropped about the same. Tech stocks and long-duration assets were naturally clobbered by the big spike in interest rates. The Invesco QQQ ETF (QQQ) dropped 9% as the U.S. 10-year Treasury rate skyrocketed more than half a percentage point from under 3.2% to close out August to above 3.7% on Sept. 30. The key rate spiked to a high just fractionally below 4% during the final week of the month. Finally, foreign equities were no place to hide amid a soaring U.S. Dollar Index – the Vanguard FTSE All-World ex-US Index ETF (VEU) gave back 9%.
Stocks, Bonds, US and Domestic All Down Sharply In September
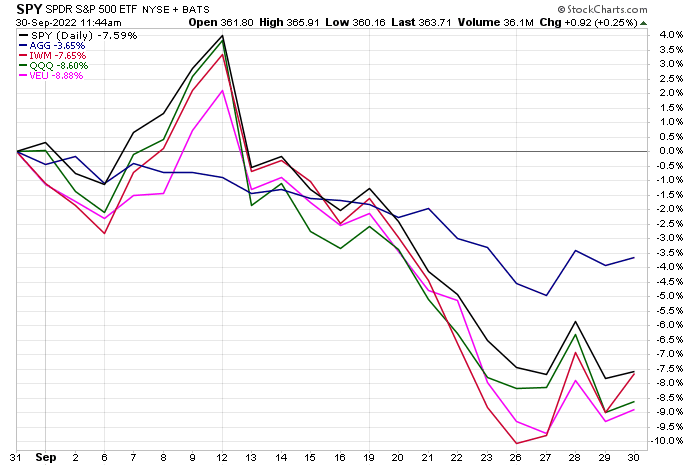
Stockcharts.com
The greenback finished the month at its highest level since early 2002.
DXY: Bull Market Presses On. +23% vs May 2021
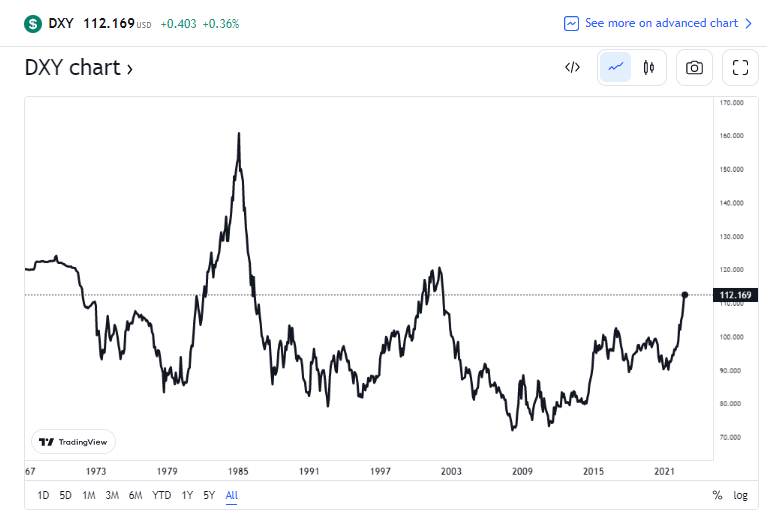
TradingView
The U.S. 10-year Treasury note yield notched its best monthly settle in more than 12 years.
Treasury Note Rates Jump To Decade-Plus Highs

TradingView
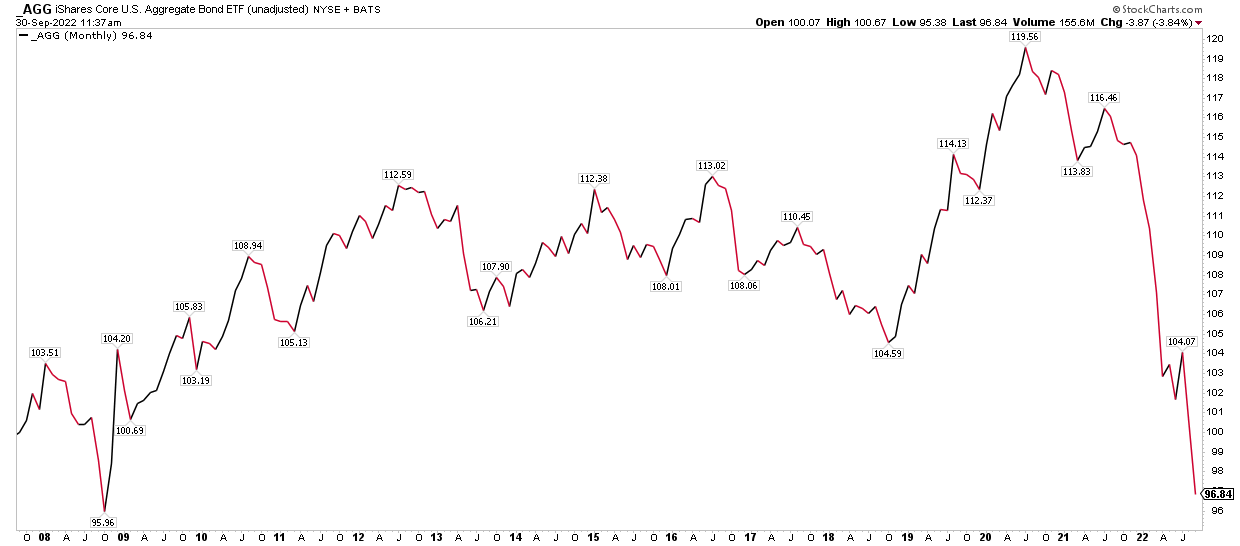
One of the biggest stories of the month was undoubtedly the extreme downward price action and volatility in the bond market. The iShares Core U.S. Aggregate Bond ETF (NYSEARCA:AGG) is now at its lowest price since the worst of the 2008 Great Recession. Soaring Treasury rates, heavy risk-off activity in corporate credit, not to mention an acceleration in quantitative tightening all helped to pressure AGG lower last month.
US Bond Market: Back to Oct 2008 Levels
Stockcharts.com
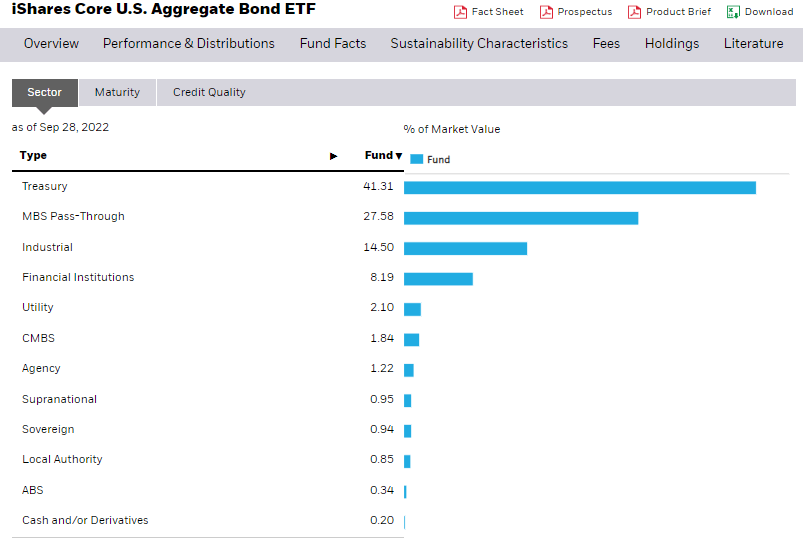
It’s important to know what AGG’s portfolio looks like. So many long-term investors and retirees have significant exposure to the broad domestic fixed income market through this ETF or a substantially identical fund.
The U.S. aggregate bond market is mostly government securities with 41% in Treasuries and 28% in mortgage-based pass-through notes. While most of AGG is invested in AAA-rated debt, 73% of the product, 24% is barely above investment grade at either A- or BBB-rated. The index AGG tracks does not include high-yield bonds. With an effective duration of 6.4 years and an average yield to maturity of 4.6%, there’s less interest rate risk today vs. a year ago and a much better yield.
AGG Exposure
iShares
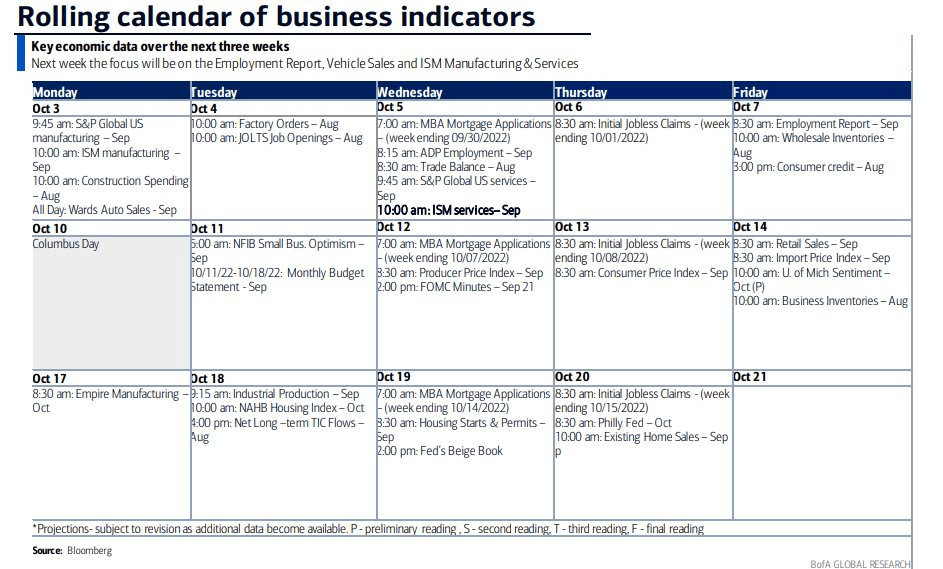
How AGG goes from here depends on a few variables. First, we’ll get key data early next month with the ISM Manufacturing survey Monday morning. Keep your eye on the Prices Paid Index for a September reading of inflation that companies are reporting.
Then comes Friday’s Employment Report which should show yet another decent month of job gains – a hot number and/or elevated wage gains figures could once again pressure rates higher and AGG lower. Perhaps the key data release will hit on Thursday, Oct. 13 when the September CPI report crosses the tape.
Upcoming Economic Data and Events
BofA Global Research
Along with important economic data during the first half of the month, corporate earnings will then carry the news baton over the latter half of October. JPMorgan Chase (JPM) Q3 results are confirmed by Wall Street Horizon to take place on Friday, Oct. 14, the unofficial start of earnings season.
What we won’t get in October is a Fed Meeting. Traders will have to wait until Nov. 2 for the next rate hike announcement.
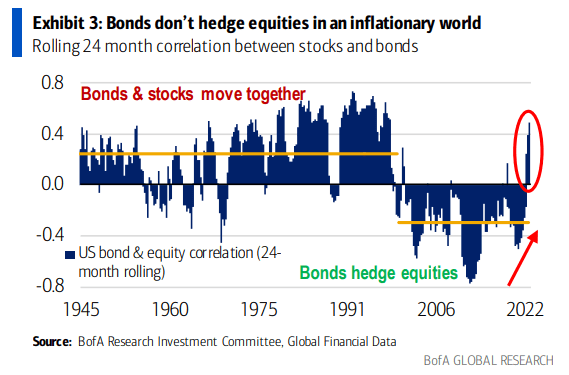
On the optimistic side of the ledger, September is historically the most risk-off month of the year, which has caused a lot of ink to be spilled already, but Q4 is often a time to buy stocks and sell Treasuries. What’s different this time is that we have seen an incredible correlation between bonds and stocks this year, so if we indeed see a late-year equity market rally, I expect AGG to take part, too.
Equity and Fixed Income Correlations: Highest Since The 1990s
BofA Global Research
The Bottom Line
September was a brutal month for being long just about anything aside from volatility and the dollar. Last month’s 4% bond market drubbing matched this past April’s huge fall for AGG’s worst monthly total return since its 2003 inception. The upshot is that bonds now offer an alternative to stocks with much higher yields today. “TINA: Resurrection” might be the hit Halloween investment party theme in 2022.
Be the first to comment