

z1b
Producer prices decided to do one better than consumer prices and outright decline during the month of July. That further fueled enthusiasm for risk assets at the opening of yesterday’s session with the S&P 500 climbing to a key level that marks more than a 50% recovery of its bear-market losses. The enthusiasm faded as the day progressed, which I think was due to technical factors more than anything else. We have come too far and too fast to hold these gains, but a new uptrend appears to have emerged. The bears on Wall Street are in desperate need of a new narrative, and I expect they will start to look for ways to back out of the corner into which they have painted themselves in coming weeks. The consensus call to sell the rip looks set to turn into buy the dip.
Finviz
The Producer Price Index fell 0.05% when it was expected to rise by 0.3%, resulting in a drop in the annualized rate from 11.3% to 9.8%. The core PPI, which excludes food and energy, rose just 0.2% when it was expected to increase by 0.04%, resulting in a drop in the annualized rate from 8.2% to 7.6%. This was the first decline in the PPI since 2020, and it now looks like we have seen the peak rate of inflation for both consumer and producer prices.
Blooomberg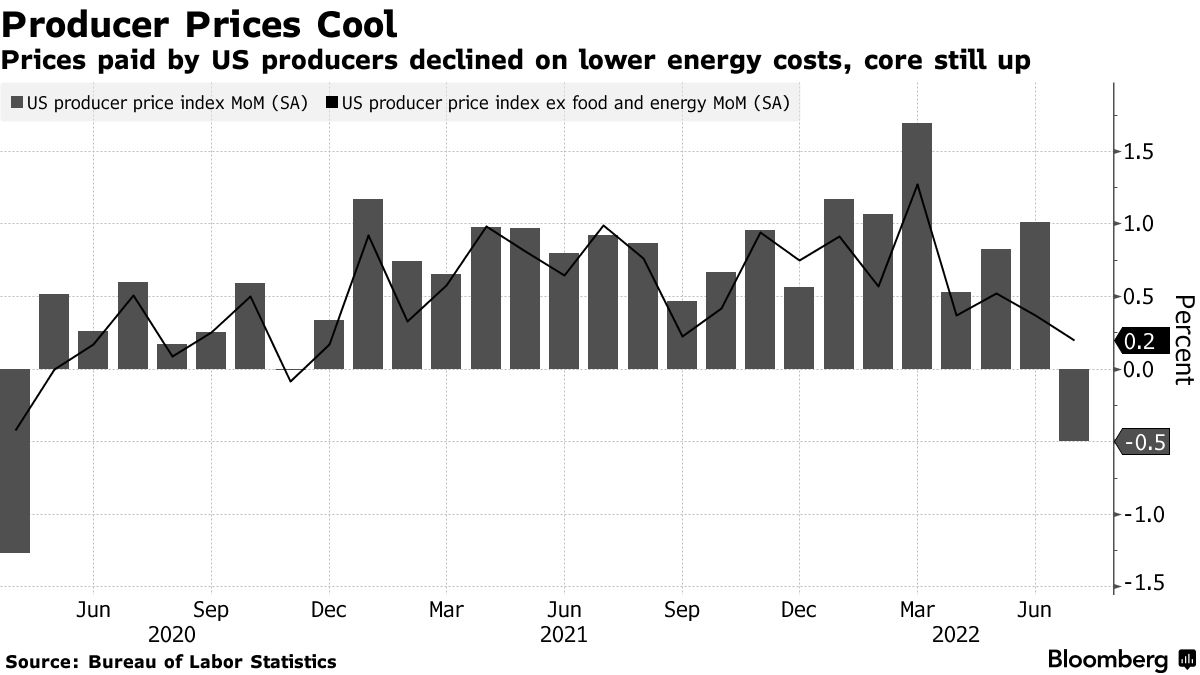
Yes, rates of 9.8% and 7.6% are too high, but both are moving in the right direction, which is what matters most to markets that serve as discounting mechanisms. I think the stock market’s more recent outperformance is telling us that not only has the rate of inflation peaked, but that it will recede far more rapidly than the consensus expects. My position has been that extraneous factors related to fiscal stimulus, in combination with supply chain disruptions caused by the pandemic and war in Ukraine, led to a large percentage of the increase in prices, which should resolve themselves as rapidly as they manifested. Other more systemic factors are likely to keep the rate of inflation above the Fed’s target of 2%, but that should be tolerable provided the economy restores real wage growth.
As a result, I don’t think the Fed has a lot more work to do on the interest-rate front. Inflation is going to burn itself off as the year progresses, allowing the Fed to be less aggressive in its tightening campaign later this year with a peak Fed funds rate of 3%. That should reverse the inversion of the yield curve (2/10 year Treasuries), as the 2-year yield falls below 3% and the 10-year yield climbs above it. I expect the dollar to weaken from current levels as investors become less risk averse, providing a modest tailwind to S&P 500 earnings during the second half of the year.
A rising 10-year yield should be a positive from the perspective of growth expectations in the economy, but anything meaningfully higher than 3% will likely be a headwind for stocks, as it has been over the past decade. This is something to watch for and the main reason I think the Fed is hoping it can stop raising short-term rates at 3%, because it knows that stock prices will suffer if long-term rates rise above that level. It also increases the cost to finance the government’s debt and deficits.
DataTrek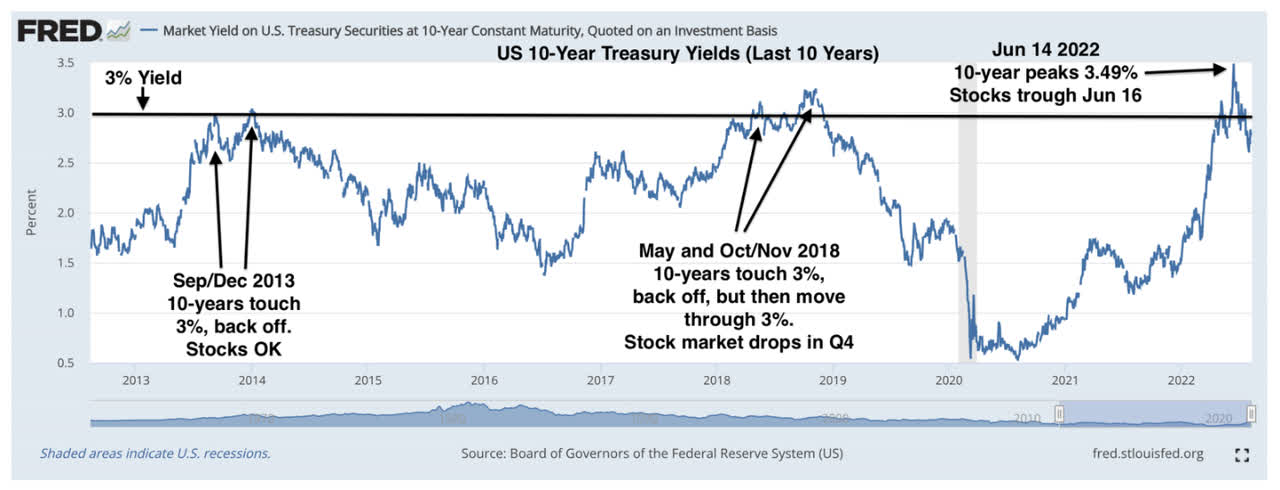
I recognize that the Fed is forecasting a much higher Fed funds rate than 3% today, but that is intended to set expectations that will result in a specific outcome. The markets are saying today that 3% will do the job.
At the same time that the Fed doesn’t want the stock market to melt down, it also doesn’t want it to melt up. The current run up is loosening the financial conditions that it has worked so hard to tighten, which is why we are seeing Fed governors jawbone markets with threats of continued tightening. This is partly why the market sold off yesterday afternoon. Investors recognize that if they ignite the speculative fervor of 2021, they could invite a more aggressive Fed that unwinds it all. A pullback in prices would be healthy for the new uptrend at this stage, and that is what I expect to see before we challenge higher levels.
The Technical Picture
The Russell 2000 small cap index has been outperforming the S&P 500 during this rebound, which is a very positive sign for the economy. That said, it has run up to major overhead resistance at its 200-day moving average and the Relative Strength Index (RSI) is at the overbought level at 70. We need a pullback with support at the 50-day.
Stockcharts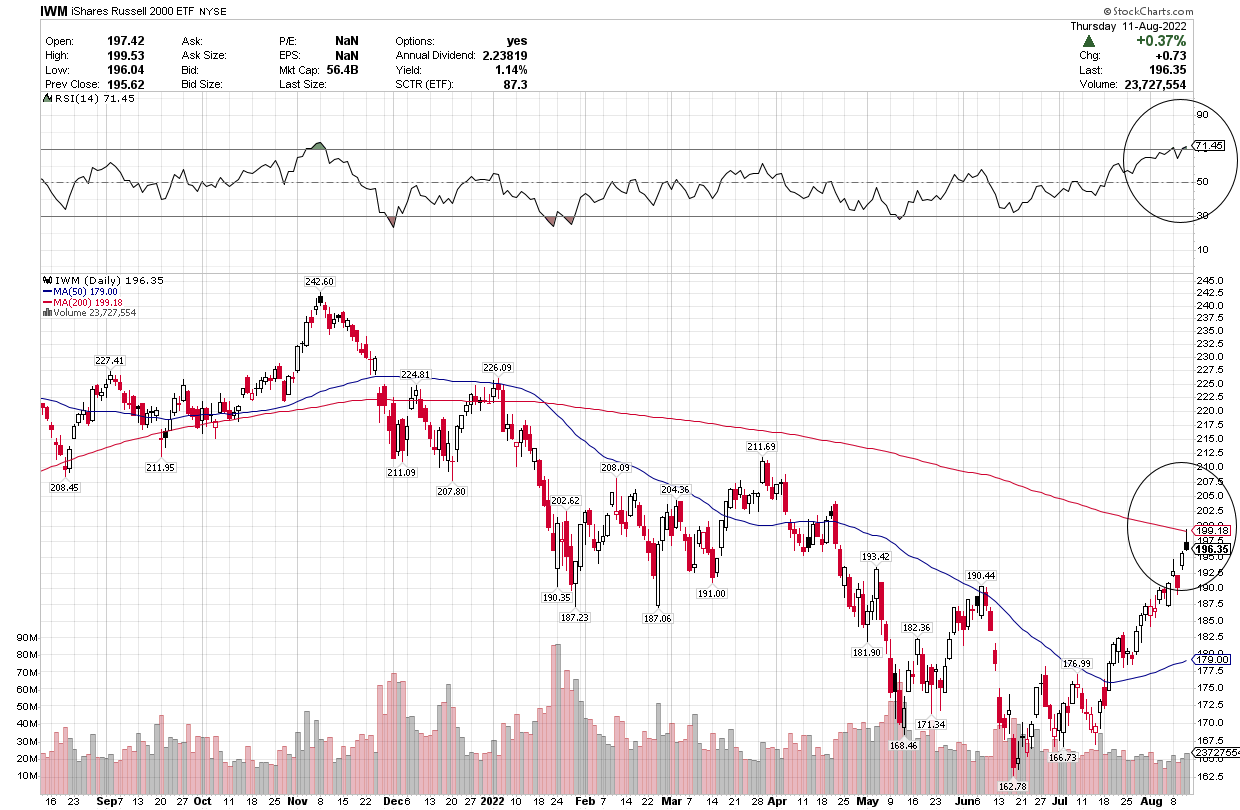
Speaking of overbought, the percentage of stocks in the S&P 500 that are trading above their 50-day moving average has risen to 86%, which is where we have topped out over the past three years. Again, we need a pause or pullback to refresh.
Stockcharts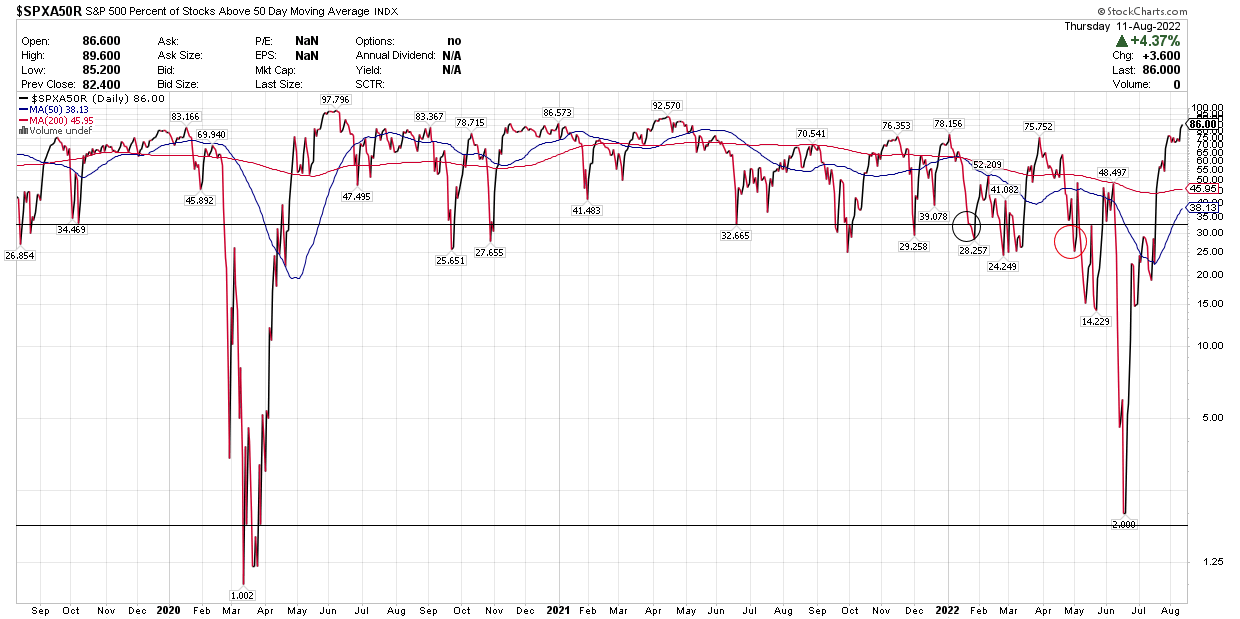
Even if the S&P 500 manages to retrace 50% of its bear-market losses at 4,231, that would occur with an overbought condition and significant overhead resistance that could be resolved with a pullback to the rising 50-day moving average.
Stockcharts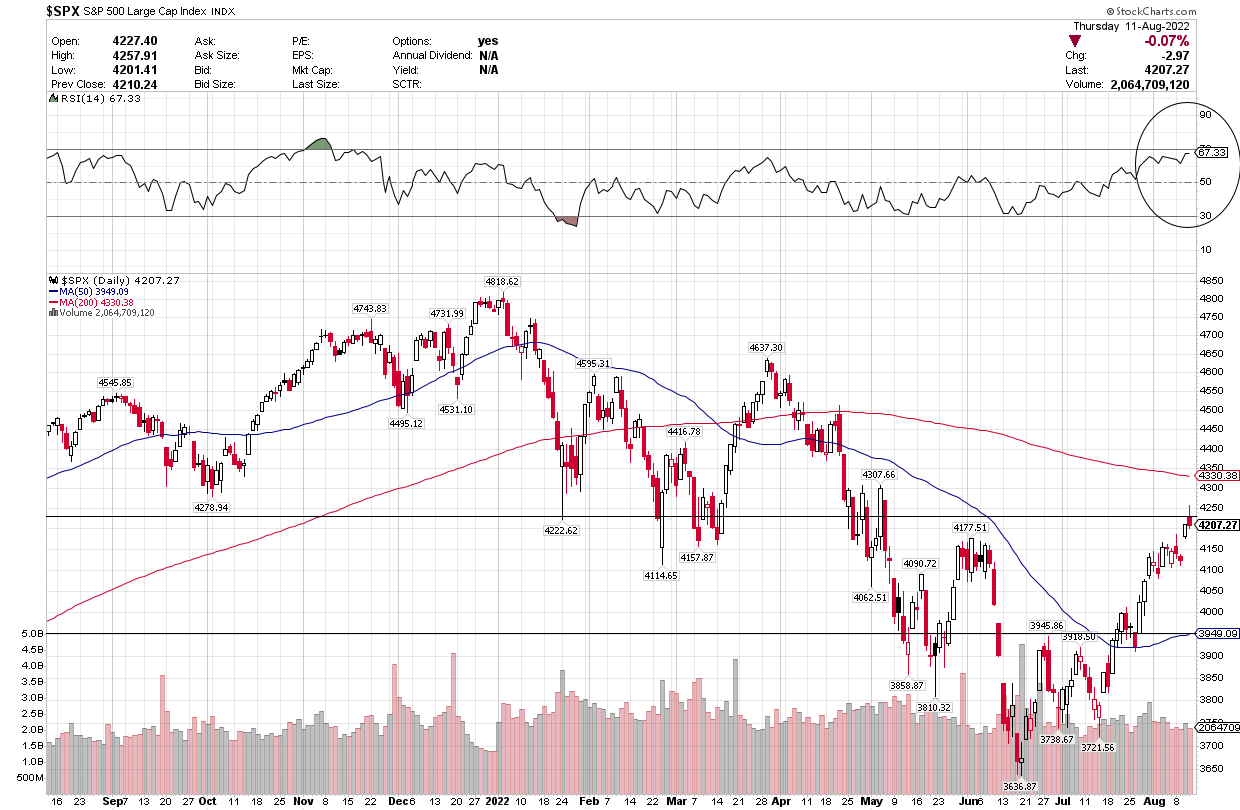
Be the first to comment