

andresr/E+ via Getty Images
Investment Summary
From the Portfolio Manager’s Desk
Equity strategies have been hammered in 2022 as the market finally lays weight to true fundamentals and unwinds the high beta/growth trade. Losses hurt the most for long/short and directional managers. As such, low beta and quality strategies are agreeing with investors the most this year. Balanced portfolios with exposure to commodities, and, in particular, alternatives, have retained strategic alpha and contained risk well below their watermarks this quarter.
Blended Portfolios Outperforming in 2022
Data: Portfolio Visulaizer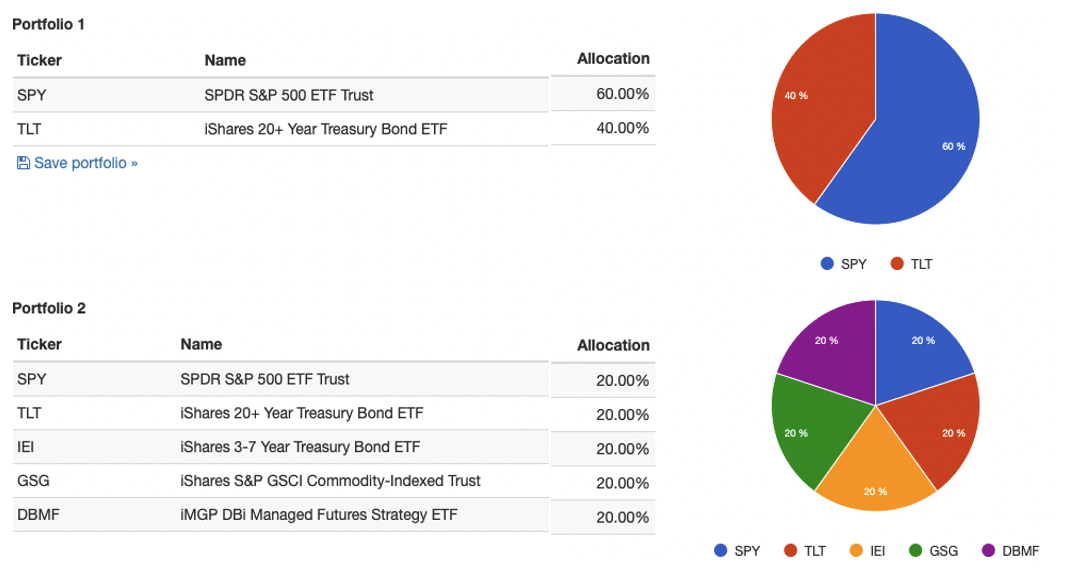
In terms of equity performance, the June correction was purely driven by the fed, in our opinion. Back in September 21′, the market had priced only 1 rate hike for FY22, and only for 25bps. Shift forward to June and the market’s priced ~350bps along the term structure of the curve, and that’s made up of 14 hikes of 25bps each. Note, 75bps has already occurred so far in 2022.
Inflation print still running hot in May…
Image: Yardeni Research 2022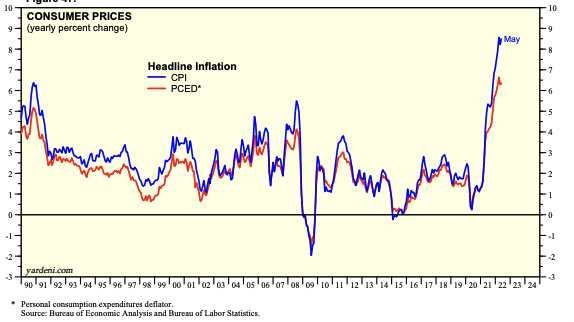
Image: Yardeni Research June 2022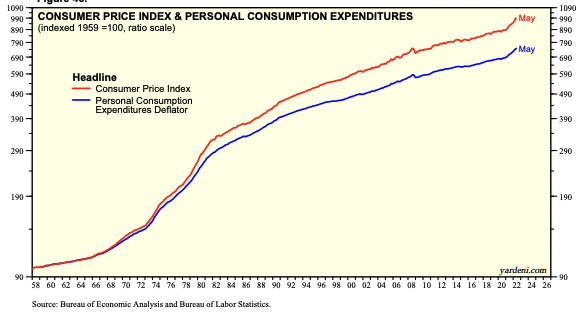
… yet commodities telling otherwise in May-June. What’s this mean for FY22?
Data: Tradingview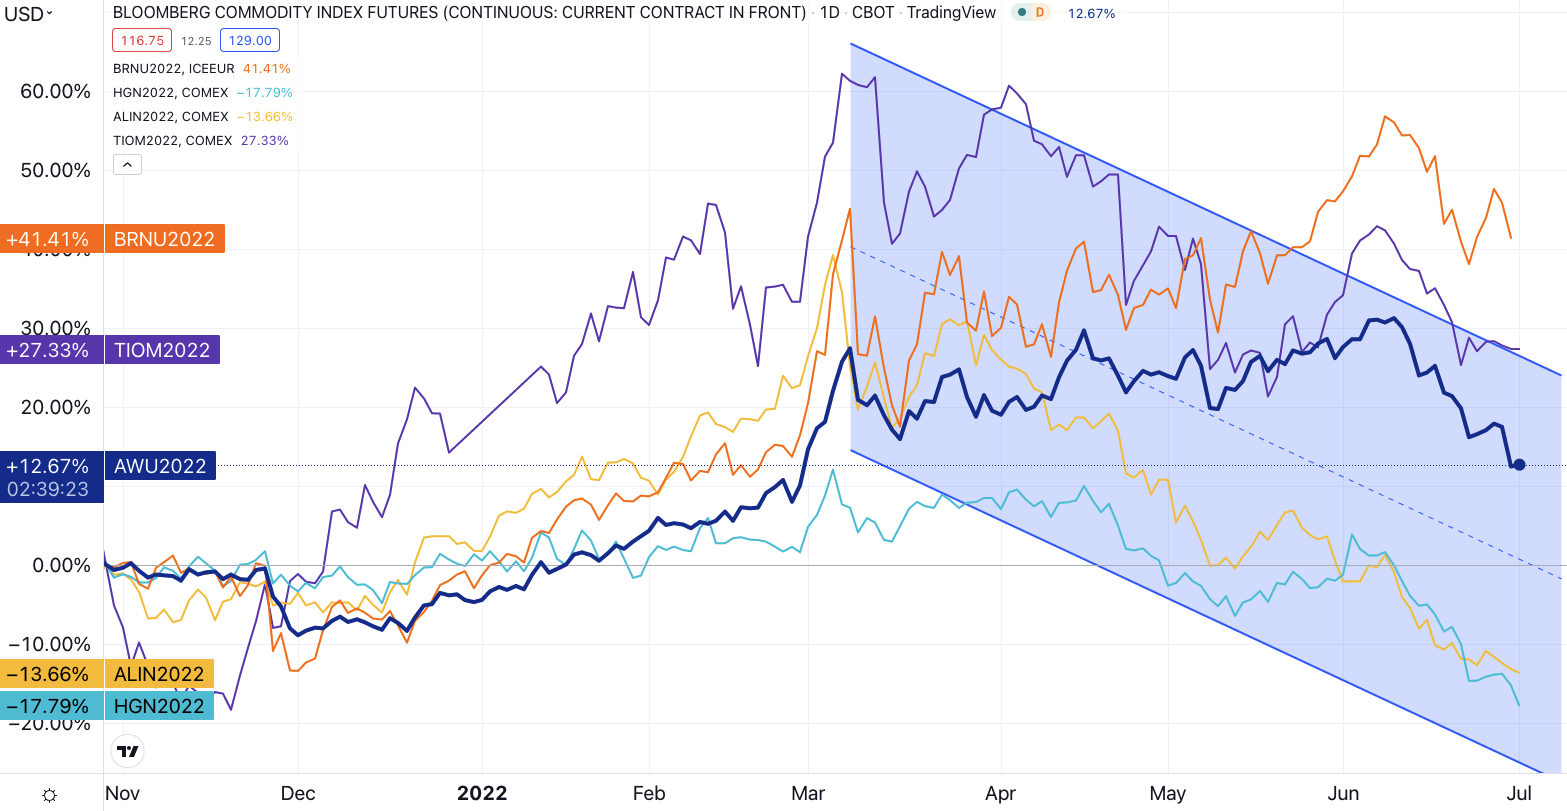
Investors continue to price in more tightening this year, amid other systematic risks, and attention has turned to themes of inflation, central bank tightening, supply chain headwinds and cash conversion. The impact to risk assets has been a major threat to drawdown and many weak, unprofitable companies have been obliterated on the charts. Unhedged, long-only portfolios continue to see some of the worst losses on record. Not to mention traditional 60/40 portfolios, currently performing their worst in decades.
US TIPS yields closed at 0.72% on Thursday up from -1.0% a few months ago. That rate of change has led to an acute de-rating in unprofitable tech, healthcare, and consumer cyclicals. But, it has pushed inflows to cash-rich miners and defensives — including large cap medical technology (“medtech”) stocks. Moreover, earnings growth is still expected for the S&P 500 this year and that’s a leading indicator for the index on a historical basis. In fact, our findings show that both earnings growth and profitability are set to be the main drivers of equity performance looking ahead. Evidence of the same is seen already in 2022.
Hummingbird Insights Equity Factor Premia Model, June 2022. Bottom-line fundamentals shining through:
Data & Image: HB Insights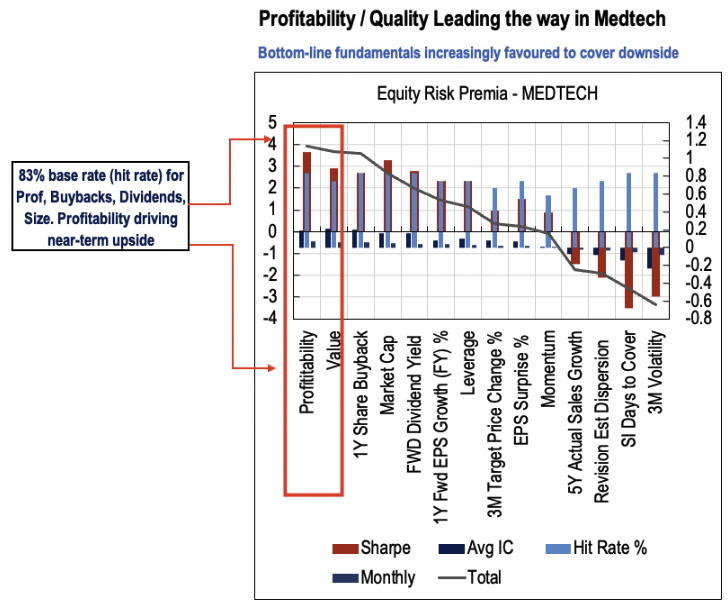
Hence, Earnings growth shows value spread yet to be realized
Data & Image: HB Insights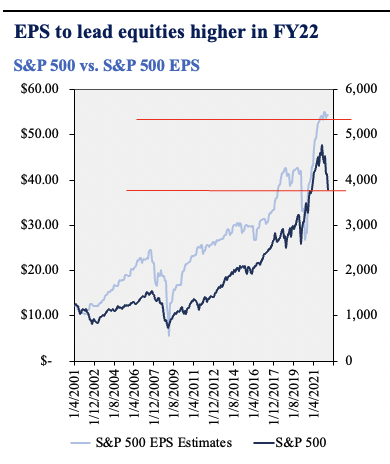
In essence, investors have turned away from top-line growth and shifted focus onto bottom-line fundamentals, prioritizing EPS, FCF, cash conversion and return on capital. And the wave of macroeconomic crosscurrents at play supports this narrative. Companies that have been patiently compounding cash can now put their balance sheets to effective use in a variety of formats and combinations. Hence, we are on the hunt for long-term cash compounders with fundamental momentum at reasonable prices.
Data & Image: Goldman Sachs Investment Research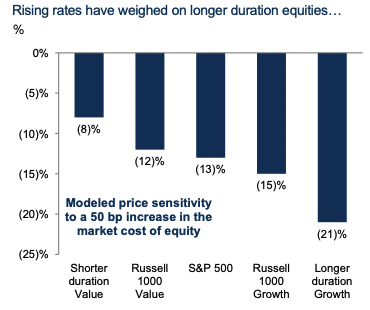
All of this information forms the backdrop of our buy thesis on Select Medical Holdings Corporation (NYSE:NYSE:SEM). It’s important to grasp this data in order to see why SEM can be positioned within a multi-directional, equity focused or cross-asset portfolio. Salient points of our bull case are outlined below. We rate it a buy with a $27 PT.
Investment Thesis Summary
As the asymmetry in risk assets continues to widen, SEM presents itself with the investment factors to prosper in the forward looking macro regime. The company looks set to surpass its FY22-23′ revenue forecasts at the current run rate. It printed $6.2 billion at the top in FY21, more than 150% of its 2021 market cap, and this carried down to $2.97 in EPS and $220 million in FCF. Adding a bullish tilt to the risk/reward calculus is SEM’s authorization of a $1 billion buyback that will run through until FY23. To date, $523 million remains under the repurchase program. Our findings also show steady FCF margins plus a strong case built by operating/earnings leverage.
Exhibit 1. SEM 12-month price action
Data & Image: Bloomberg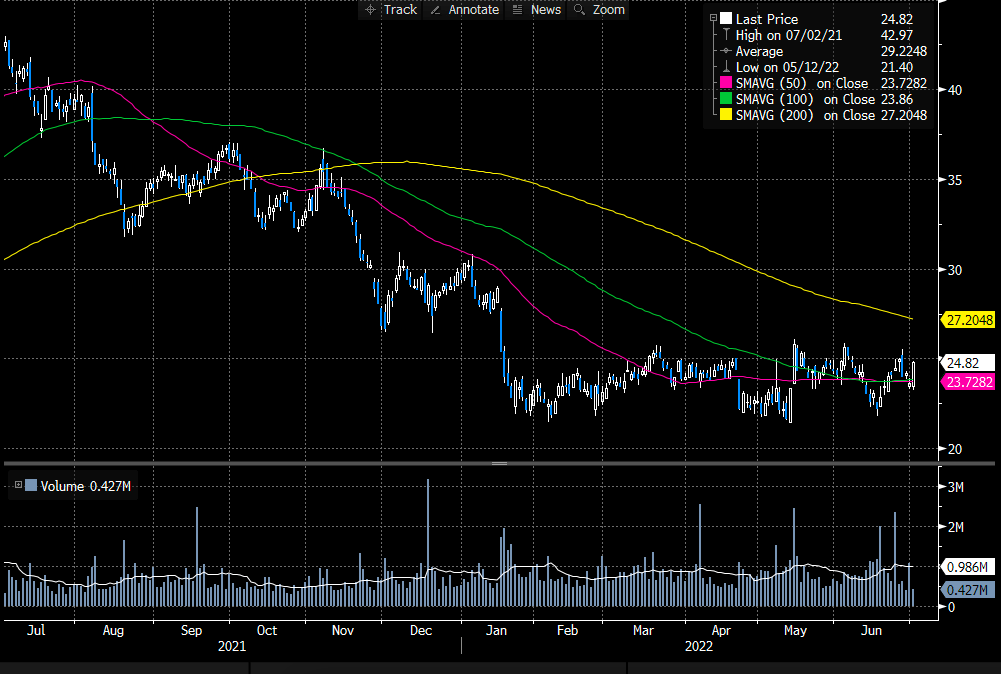
With inpatient and outpatient turnover trends now normalized to pre-pandemic levels, we see earnings leverage ratcheting up in the years to come for SEM. The backdrop is set for investors to enter or expand a position at these discounted multiples.
Labor Cost, Pricing, Vacancy Overhang Remedied
Based on SEM’s most recent filing and an easing of the labor supply, the company’s issues around labor costs have likely settled, by our estimate. Firstly, the company’s long-term acute care (“LTAC”) salary wages and benefits (“SWB”) ratio increased by 10% on average YoY last quarter. For inpatient rehab, the SWB ratio increased 8%, whereas for critical illnesses it was 18%, backed by nursing agency rates and usage. The registered nurse (“RN”) agency rate per hour increased 21% YoY and 4% sequentially. Agency labor utilization came in at 38%, well above historical averages.
Exhibit 2. National Hospital Patient Trends Have Normalized back above Pre-Pandemic Levels
Data & Image: Kaufman National Hospital Flash Report. Data corroborates that SEM’s labour pressures have likely eased. National Hospital Patient data shows trends have normalised back above pre-pandemic levels. This provides excellent entry to a company trading at a deep discount to peers and historical averages. 
ICU nursing rates have narrowed by around 10% since January, and that’s backed by patient procedure data. National hospital operating margins are trending back towards positive after printing net-negative from January FY22. Discharges gained 18% MoM to April and 14% from 2020, whereas patient days increased 1.2% YoY, around -5% of budget variance. Importantly, operating room minutes also jumped 17% YoY on the national level, and have normalized 40% back above 2020 levels. All up, this would translate to a ~15-17% decline in labor rates by Q2 FY22 for SEM in our estimate.
SEM has followed similar trends to national hospital statistics and its special hospital vacancies are improving. Open positions are showing a decline from a peak of 340 in February, whilst SEM expands its LTAC capacity. The company opened a hospital in Nashville and acquired 2 facilities in Q1 FY22 and has expanded on 2 new JV’s. We’ve modelled SEM’s capacity to grow by ~150-160 beds on the back of these new ventures. That would bring total to 4,700 beds by FY23 – more than 10% higher than before Covid-19. It’s already managed to add another 30 beds in its Miami rehab segment.
Exhibit 3. Hospital Operating Margins Normalizing Back Toward Long-Term Averages
Data & Image: Kaufman National Hospital Flash Report.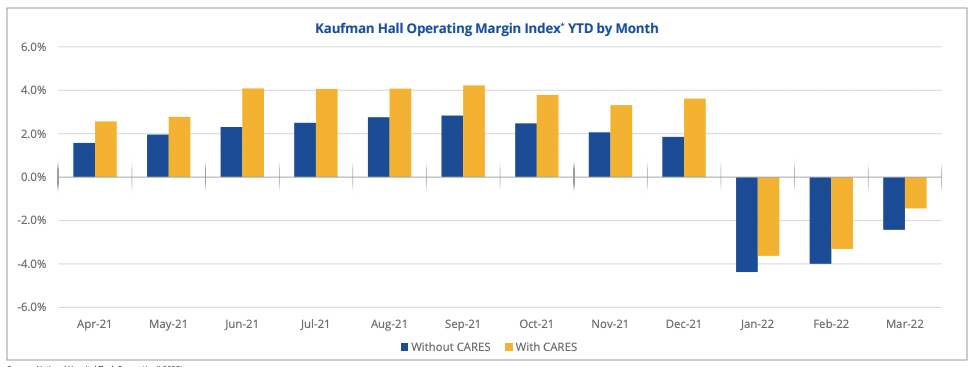
Pricing tailwinds hedge inflationary impacts and are also accretive to earnings and look set to match CPI increases into FY23. Over 50% of SEM’s payor mix is commercial, whereas <40% is Medicare based. For FY23 proposed Medicare pricing is ~3% with upward pull from higher CPI prints. SEM has numerous commercial contracts in place that include CPI inflators and this is accretive to earnings through as the pricing environment becomes less benign. In our model, each 100bps of price Medicare and/or commercial payor increase adds $20 million in operating income to our model.
Operating leverage
Additional bullish factors are observed when digging a little deeper into SEM’s financials. Specifically, operating income and EPS growth have been standouts for the company in the periods to date. 3-year sales growth normalizes to 7% for SEM, above its GICS industry peer median. This has carried through to an average 1.0x and 2.1x operating leverage and earnings leverage respectively. One important note regarding operating income for SEM, since FY20, is how it books operating income. Per it’s latest 10-K:
For the three months ended March 31, 2021, we had other operating income of $34.0 million. Of this amount, $16.1 million related to the recognition of payments received under the Public Health and Social Services Emergency Fund.
Exhibit 4.
Data & Image: SEM SEC Filings; HB Insights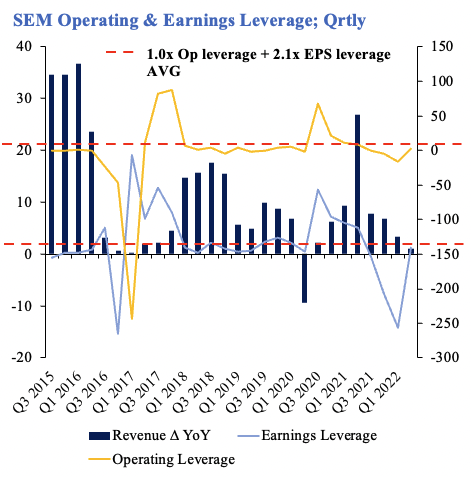
Operating and earnings leverage have been lumpy at times since 2015 on a quarterly basis. Nevertheless, the earnings flywheel has consistently fed FCF down below the bottom line in that time. SEM’s averaged FCF margins of 8.3% are from FY18–to date, ahead of the peer median’s 6.7%. It printed $220 million in FCF in FY21 and investors enjoy a 7% yield on that figure. Cash from operations (“CFO”) is seasonal YoY for SEM although has remained top-heavy above $400 million annually since FY18. It’s averaged an earnings-to-CFO ratio of 0.45 since FY15. This demonstrates each $1 in CFO relates ~$0.44 in earnings on average for SEM after deducting non-cash items. In FY21, the ratio was 0.96, suggesting high efficiency at this level.
Exhibit 5.
Data & Image: SEM SEC Filings; HB Insights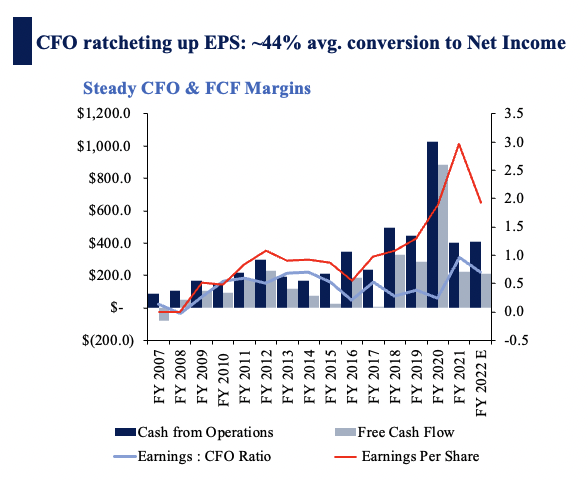
This data is important in the wider scope for SEM. Prior to 2020, its share price was driven by a culmination of fundamental and technical factors. In 2020/21′, data shows its share price was primarily driven by a large shift in earnings. This was partially brought about by $123.8 million of other operating income (see SEM FY21 ‘Summary Financial Results’: Other Operating Income) related to the recognition of payments received under the Provider Relief Fund.
Exhibit 6. Share price returning to bottom-line fundamentals?
Data & Image: Bloomberg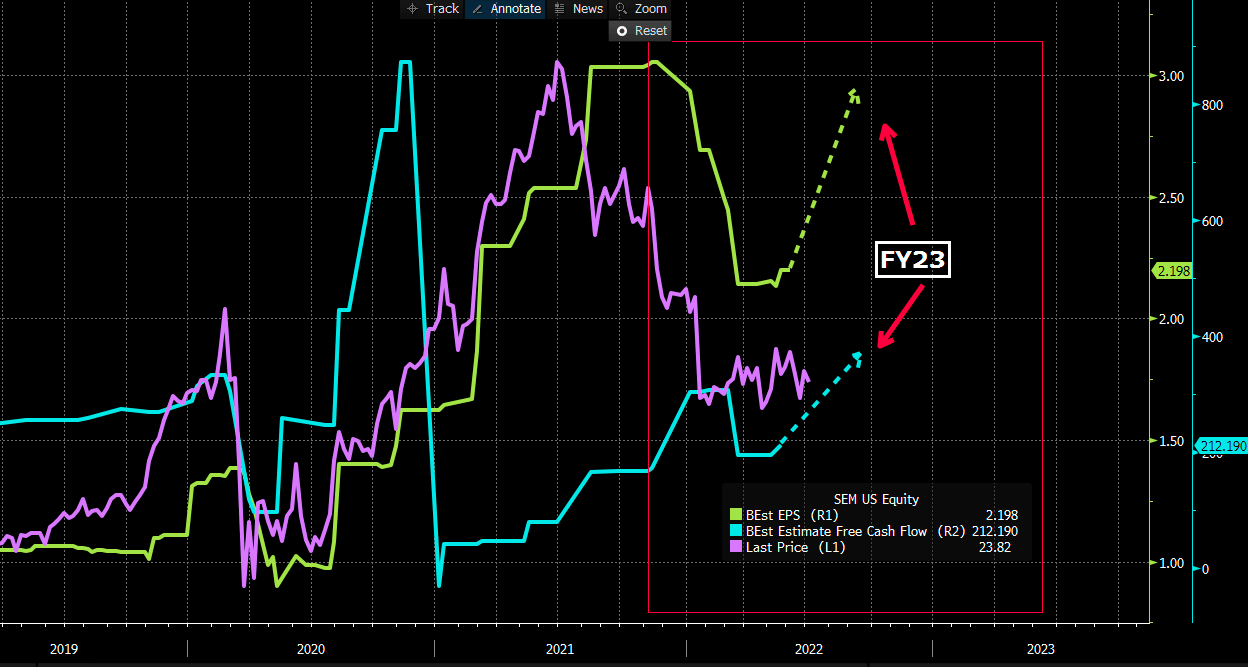
Nevertheless this raises a few important points. First is that SEM’s bottom-line fundamentals have historically been a key factor for share price movement. Prior to 2020, earnings and FCF was steady. However, from 2020, EPS and FCF consensus estimates have shown high causal relationships to date. With FY23 estimates for both staged ~32% and ~74% higher than today, this points to a higher share price for SEM.
This argument is supported by the fact that investors have shifted away from rewarding top-line growth and are focused on bottom-line fundamentals. Low-beta and quality strategies have outperformed in 2022 and look set to continue amid the macro regime. Profitability is a tight fit for a proxy of profitability. The Bloomberg US pure profitability portfolio total return (“BUSPPTR”) is a watermark to benchmark various securities against in terms of profitability. It has outperformed the S&P 500 in 2022, and since March, both SEM and the BUSPPTR have converged (below).
Exhibit 7. SEM agreeing with profitability this year
Data: Bloomberg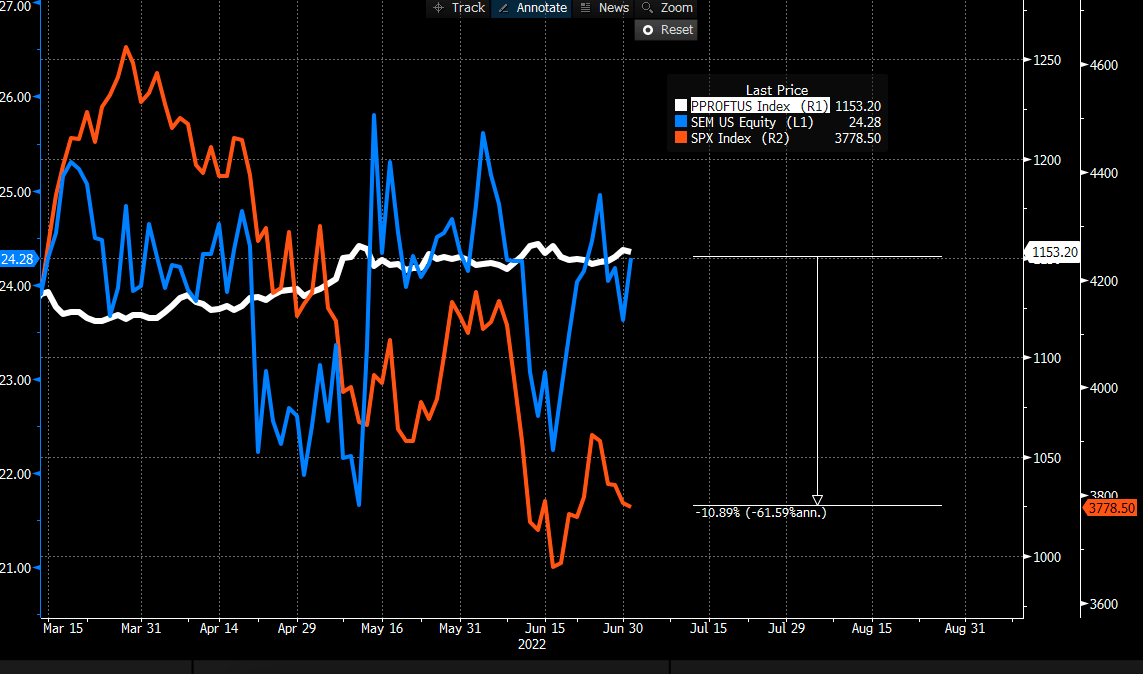
This is important data too because SEM’s profitability has outstripped peers and grown geometrically over the last 5 years. ROA has spiked to 4.4% in Q1 FY21 and ROIC 7.7%. These have pushed 6.5% and 4% higher on average each year since FY17. Despite this, however, SEM has lost its equity risk premium (“ERP”) back in April as its earnings yield compressed and Treasury yields spiked. The gap it has maintained, however, has begun to narrow in late June. Nonetheless, the ERP is an essential component for decision making and inclusion into an equity segment of one’s portfolio. We’d like to see this spread narrow and reverse for full conviction on the name in order to scale in at force.
Exhibit 8. SEM’s loss of ERP from around April
Data: Bloomberg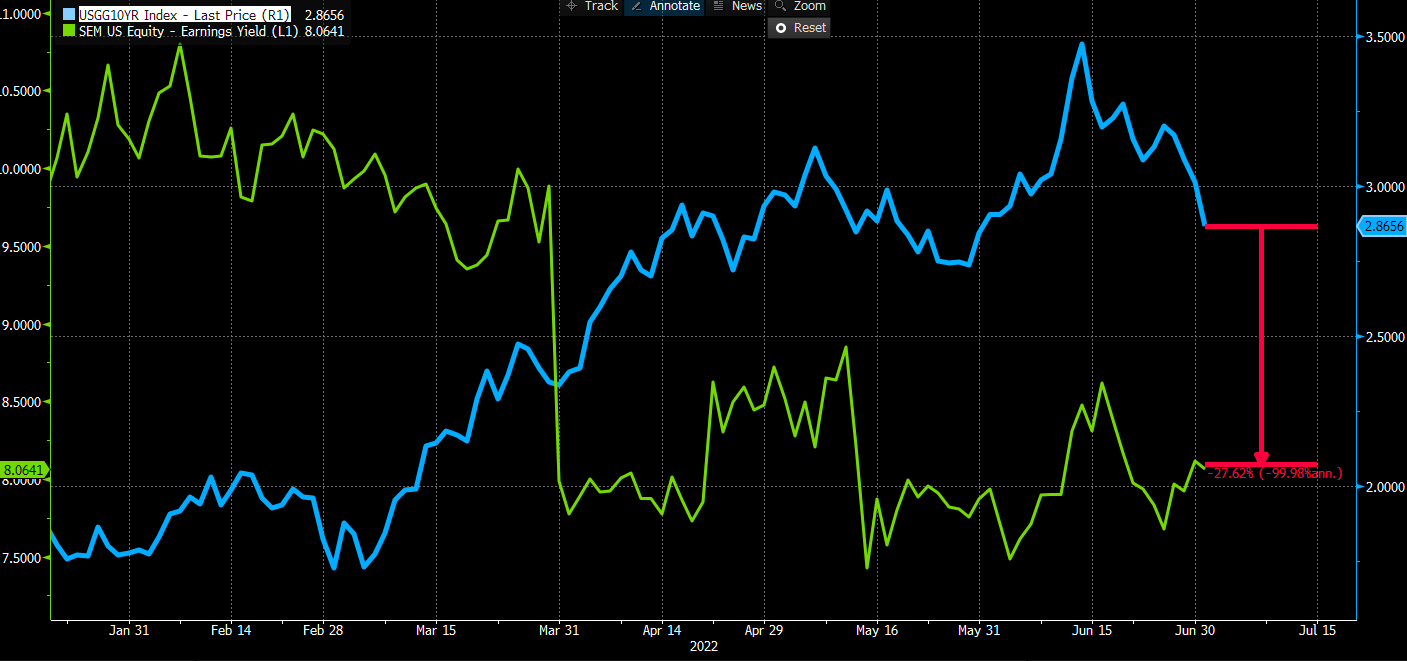
Tailwinds from balance sheet management
Questions arise of how well the balance sheet is managed. The debt ratio is 62%, whilst total debt to total capital is 78%. Whereas common equity to total assets is 15%. However, the interest expense is well covered at 6x, and more than 4x over cash interest paid.
The interest expense on its term loan debt looks to potentially creep lower in coming periods as well. This is due to SEM’s collar on a floating rate, that’s indexed to 1-month LIBOR/SOFRA. The interest rate collar caps floating rate exposure on a notional $2 billion of term liabilities at 1%. When the cap of 1% is breached on the term debt the counterparty in the contract is liable for payment. SEM has this hedge in place until September FY24, and the position now rests at ~$70 million in the money. Effectively we see SEM’s sensitivity to rates reducing substantially from this move. Interest expenses have been reducing since 2019 whilst cash interest payments are following suit. As central banks embark on the tightening cycle, this adds weight to our ‘quality’ thesis for SEM’s balance sheet, despite its debt load.
Exhibit 9.
Data & Image: HB Insights, SEM SEC Filings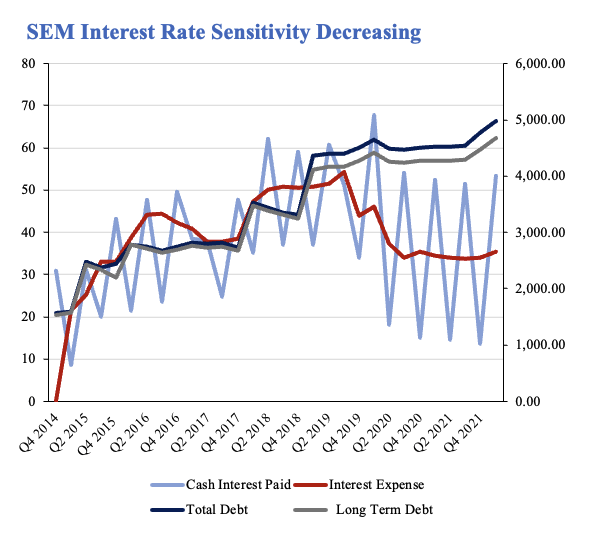
Exhibit 10. SEM Credit Summary
Data & Image: HB Insights, SEM SEC Filings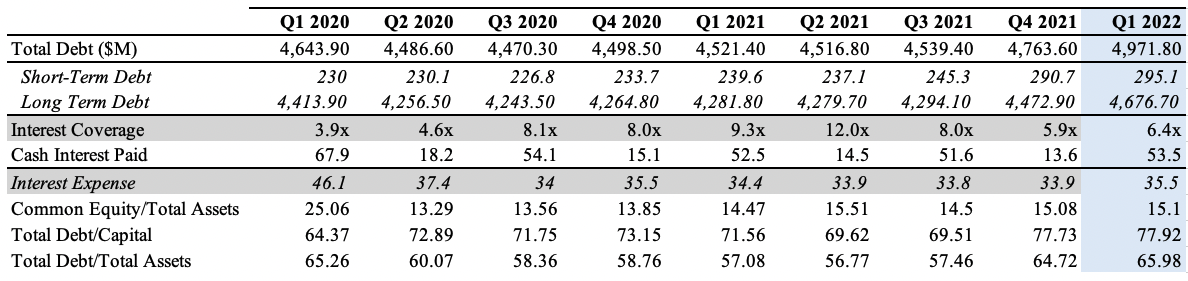
Valuation
Shares are trading at ~9.5x our FY22 EPS estimates, above 4-year normalized P/E of 15.5x. Shares are also priced at ~7x FCF, slightly behind 4-year normalized 7.7x P/FCF. Shares are trading at an average 23% discount to names within the GICS peer group, and this presents a compelling value opportunity in our estimate.
Exhibit 11. Multiples & Comps
Data & Image: HB Insights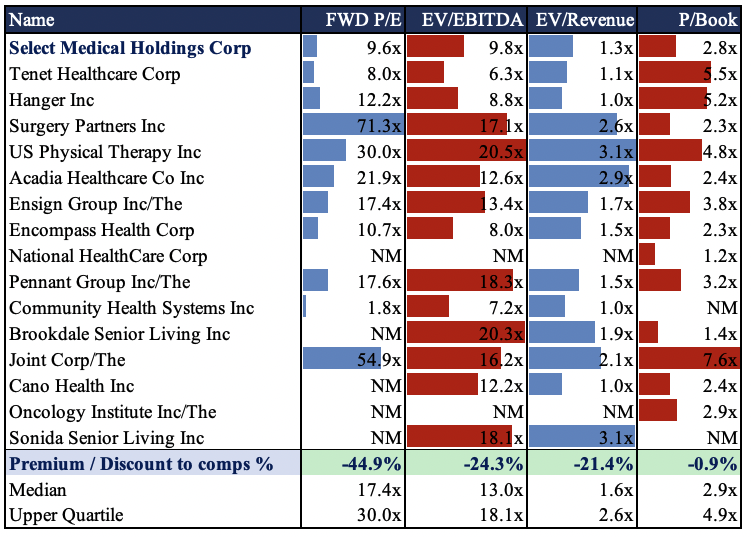
The question is if this discount is justified or not. Based on the summation of factors in this report, we’d say not. Utilizing normalized multiples as a cleaner forecasting tool reveals the same. SEM trades at an average 8.5% discount to its 2 and 4-year normalized multiples, in the composite seen below. Collectively, we’ve priced SEM at $26.60 based on the blend of factors below.
Exhibit 11. Normalized valuation forecasts
Data & Image: HB Insights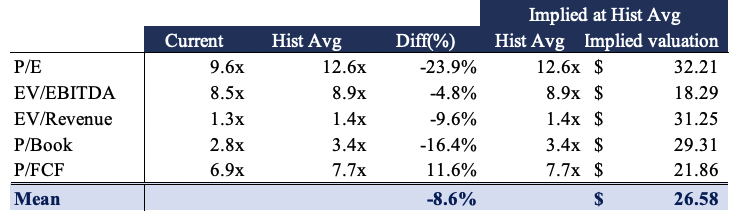
Forecasting FCF’s into FY27 for SEM, and discounting these back at 12.5% yields $45 in unrealized FCF/share for investors. This tangible value is backed by SEM growing its book value of equity by 7.5% geometrically over the last 5-years to date, below the S&P 500’s annualized total return. Point and Figure (“P&F”) analysis reveals much of the same. Price action is bullish having broken through two inner resistance lines in recent times, with multiple upside targets ranging from $25.5, $27.5 and $31.5 respectively.
Exhibit 12. Multiple upside targets
Data: Bloomberg
The confluence of data pointing to the $25-$30 mark suggests there’s value to be realized until that point in the short-term. Our 6-12 price target of $27 represents the midpoint of all valuation inputs. Looking further ahead, we’ve baked in out DCF valuation estimates as well, lifting our price objective to $31 per share. This has us chasing ~26% upside in this name with a re-evaluation of the position at that point, or with a 15% drawdown of principal.
In Short
The market has punished SEM in favor of more systematic risks in 2022, by estimation. It has the profitability characteristics that adhere to the current premia driving equity returns in 2022. Moreover, it is a consistent cash-compounder that looks set to continue adding value through its share buyback. This is backed by sound balance sheet management that helps mitigate impeding macro-risks on the horizon.
We’ve priced SEM at $25-$31 based on a blend of inputs, and are seeking a return objective of ~26% in the upside case. SEM justifies its inclusion in an equity focused portfolio in offering this margin of safety.
Be the first to comment