

Scott Olson/Getty Images News
Thesis
After a long bull run, recent market corrections have brought an attractive entry opportunity to the equity market. In particular, large caps had been trading at a lofty valuation with a Shiller CAPE around 38.5x during 2021 and early 2022. And the recent corrections have brought the CAPE to about 31.0x as of this writing, a valuation contraction of almost 20%.
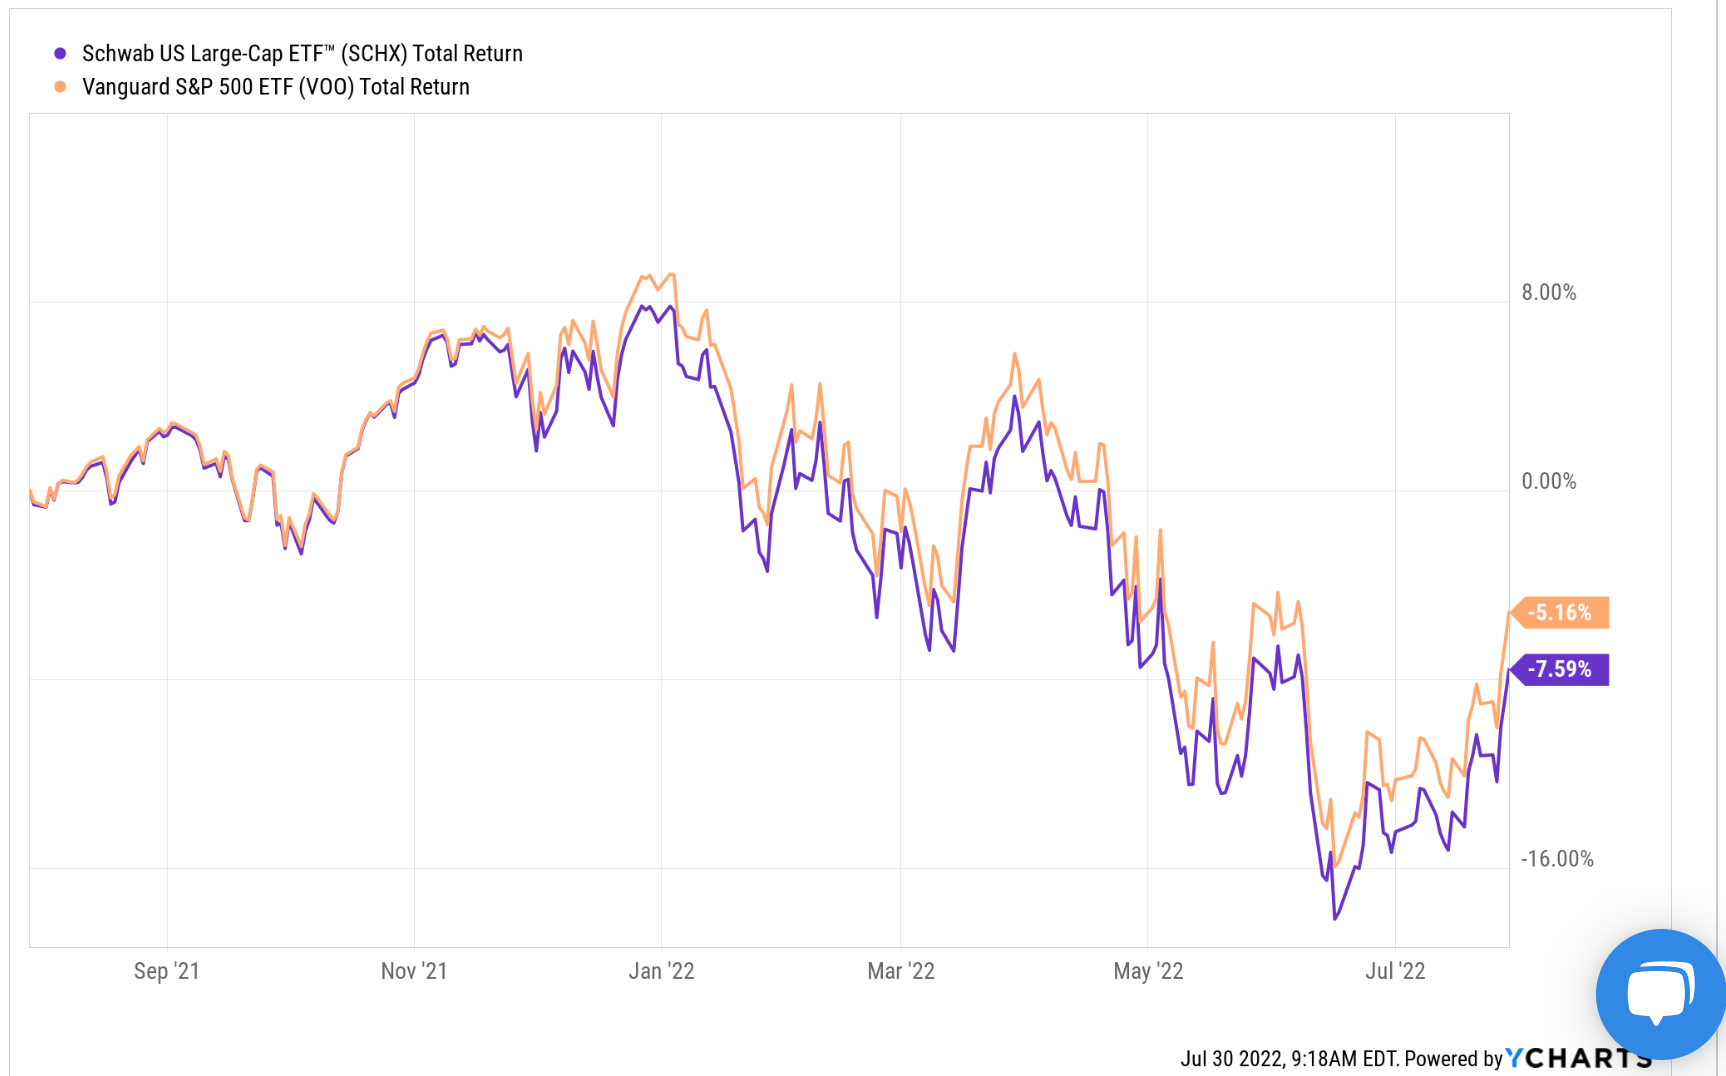
Such contraction has provided investors an opportunity to better strengthen their portfolios. And this article will compare two of the popular large-cap funds to help investors make an informed choice: the Schwab U.S. Large-Cap ETF (NYSEARCA:SCHX) and the Vanguard S&P 500 ETF (NYSEARCA:VOO). As you can see from the following chart, SCHX suffered a total loss of 7.59% over the past year, and VOO suffered a total loss of 5.16%. And the chart below probably already provided a good idea of the similarities and differences between these two funds. As you can see, both funds closely tracked each other due to the similarities in their indexing method. Although SCHX historically has demonstrated slightly higher volatility than VOO because VOO holds larger companies.
In the remainder of this article, you will see a more in-depth comparison of these funds in terms of their indexing methods, performances, risks, dividends, and potential returns. And in the end, you will see that our conclusion is that they are essentially exchangeable. We don’t view the above volatility as a negative for SCHX ourselves. But investors do need to pick the right fund to suit their own risk profiles and investment timeframe.
Seeking Alpha
SCHX vs VOO: Basic information
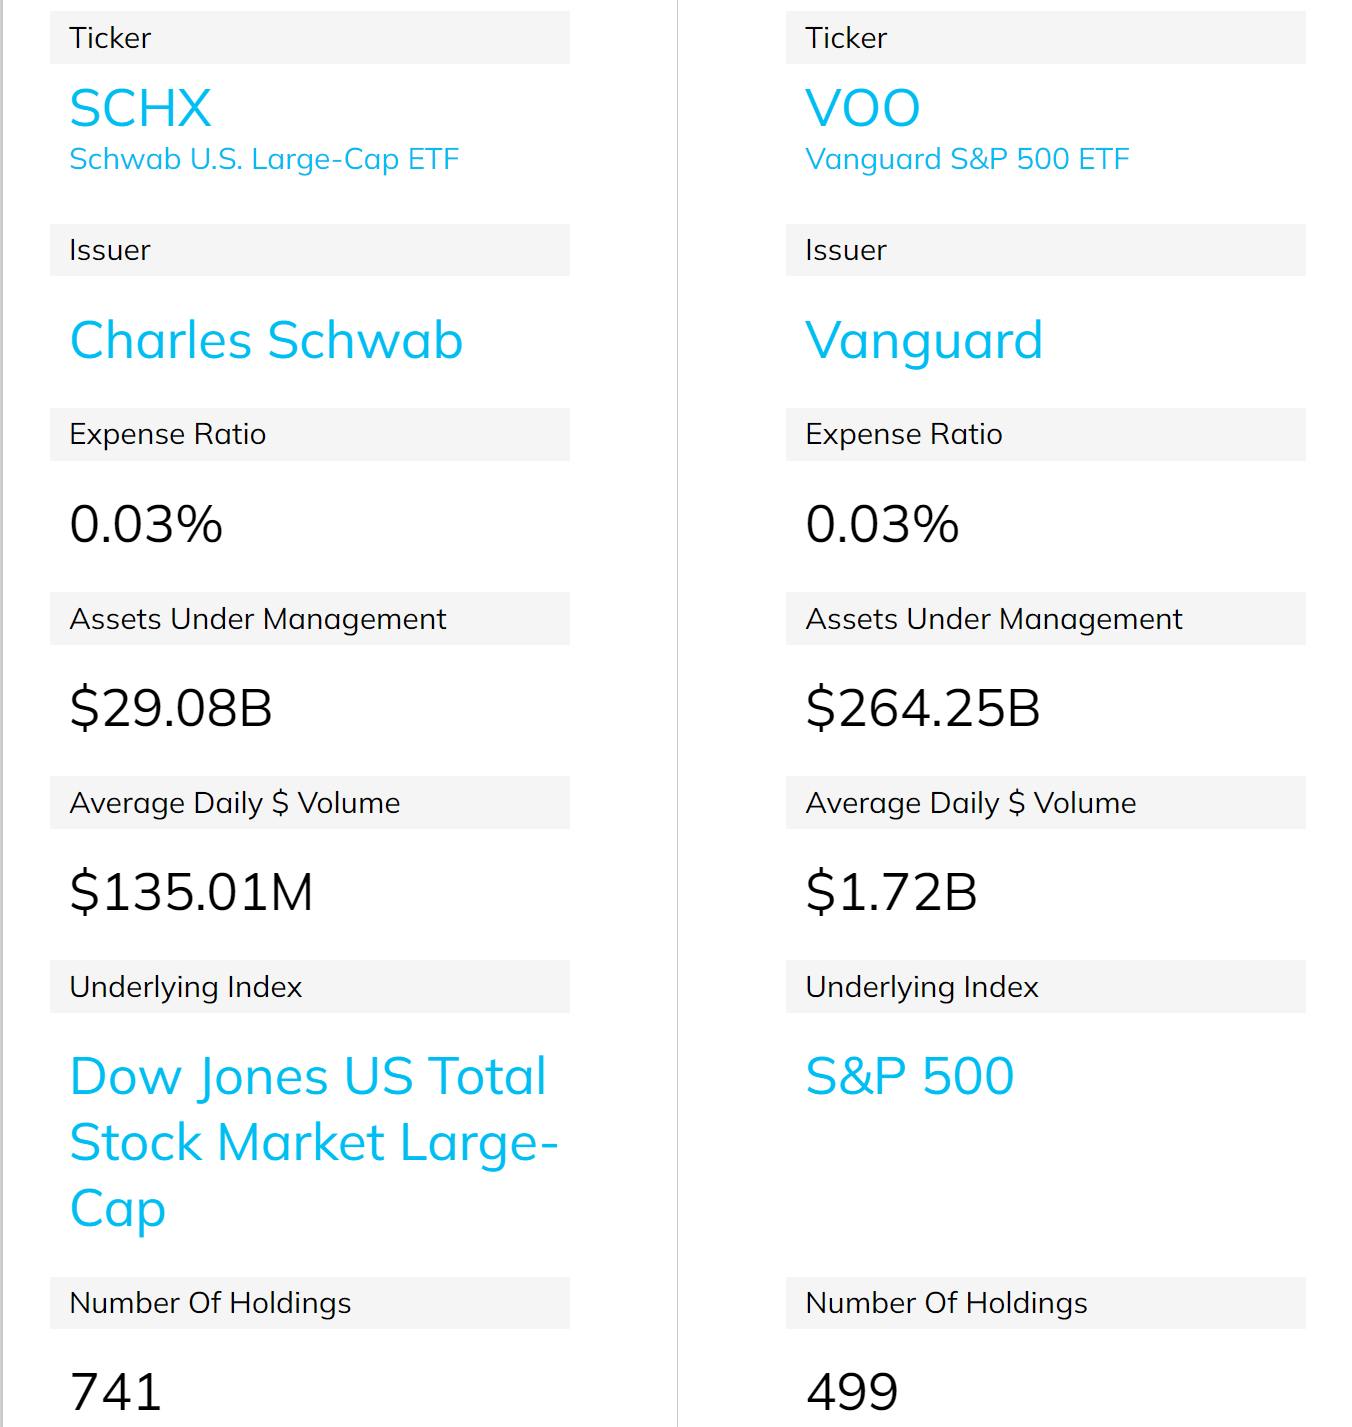
Both are popular funds that need little introduction. Here, I will just highlight a few details to facilitate the remaining discussions in this article. SCHX is one of the popular Schwab funds. It is indexed based on the Dow Jones US Total Stock Market Large-Cap index (which consists of the largest 750 US stocks). It has a total asset of over $29B. In contrast, VOO is based on the S&P 500 index. VOO features an even larger AUM of over $264B. Although both funds are large enough and both trade with negligible spread (0.02% for SCHX and 0.01% for VOO). Also, both charge a rock-bottom low fee of 0.03%.
Source: ETF.com
SCHX vs VOO: indexing method
The biggest difference between these two funds is their indexing method as mentioned above. More specifically, the indexing methods and goals are:
VOO invests in stocks in the S&P 500 Index, representing 500 of the largest U.S. companies. Its goal is to closely track the index’s return, which is considered a gauge of overall U.S. stock returns.
SCHX’s goal is to track as closely as possible, before fees and expenses, the total return of the Dow Jones U.S. Large-Cap Total Stock Market Index. The fund offers simple access to the 750 largest U.S. companies as ranked by full market capitalization.
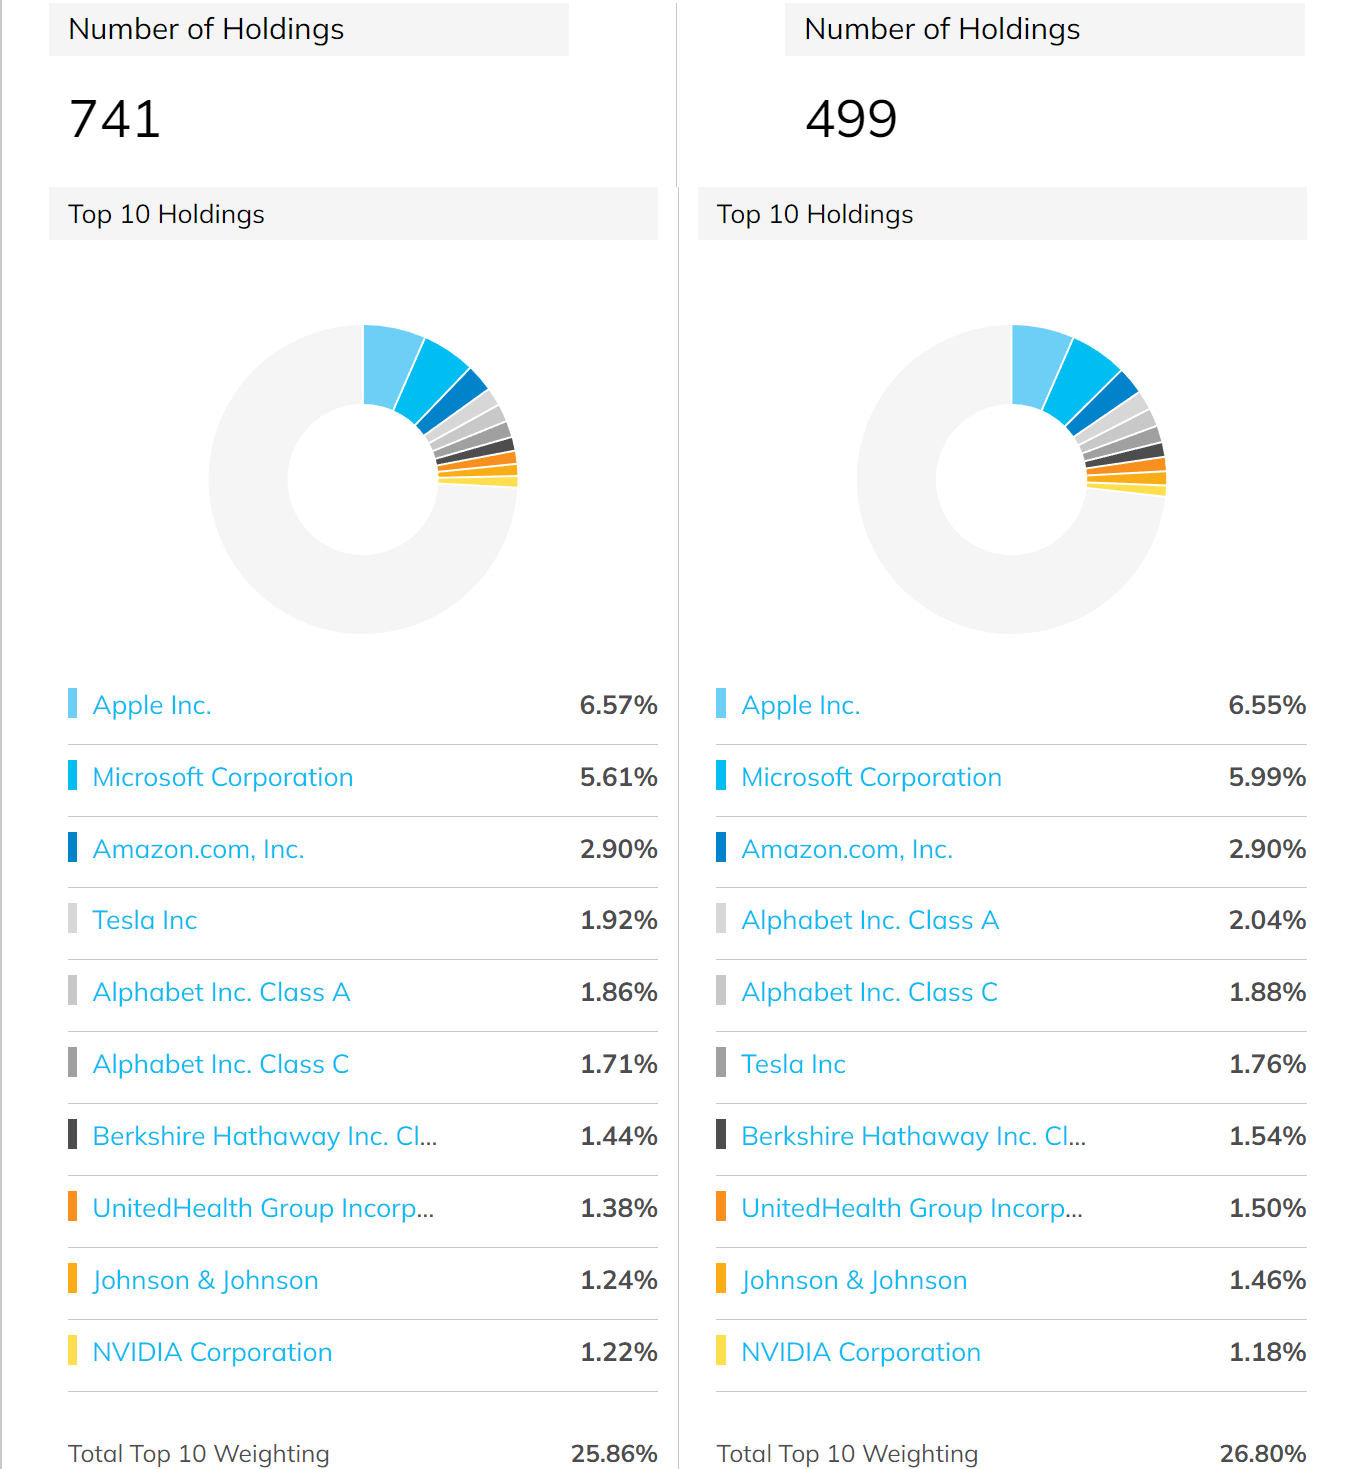
Despite the differences in their indexing method, their holdings are very similar for at least two reasons. First, obviously, about 500 of their holdings overlap. And secondly, even within the ~500 overlapping stocks, both indices are currently dominated by a handful of mega-cap companies as you can see from the following chart. As seen, their top 10 holdings are identical, and the allocations are also very similar. The top ten holdings in SCHX represent 25.8% of its total assets, and the top ten holdings in VOO represent 26.8% of its total assets. The difference here is only about 1%.
Source: ETF.com
SCHX vs VOO: Performance and risks
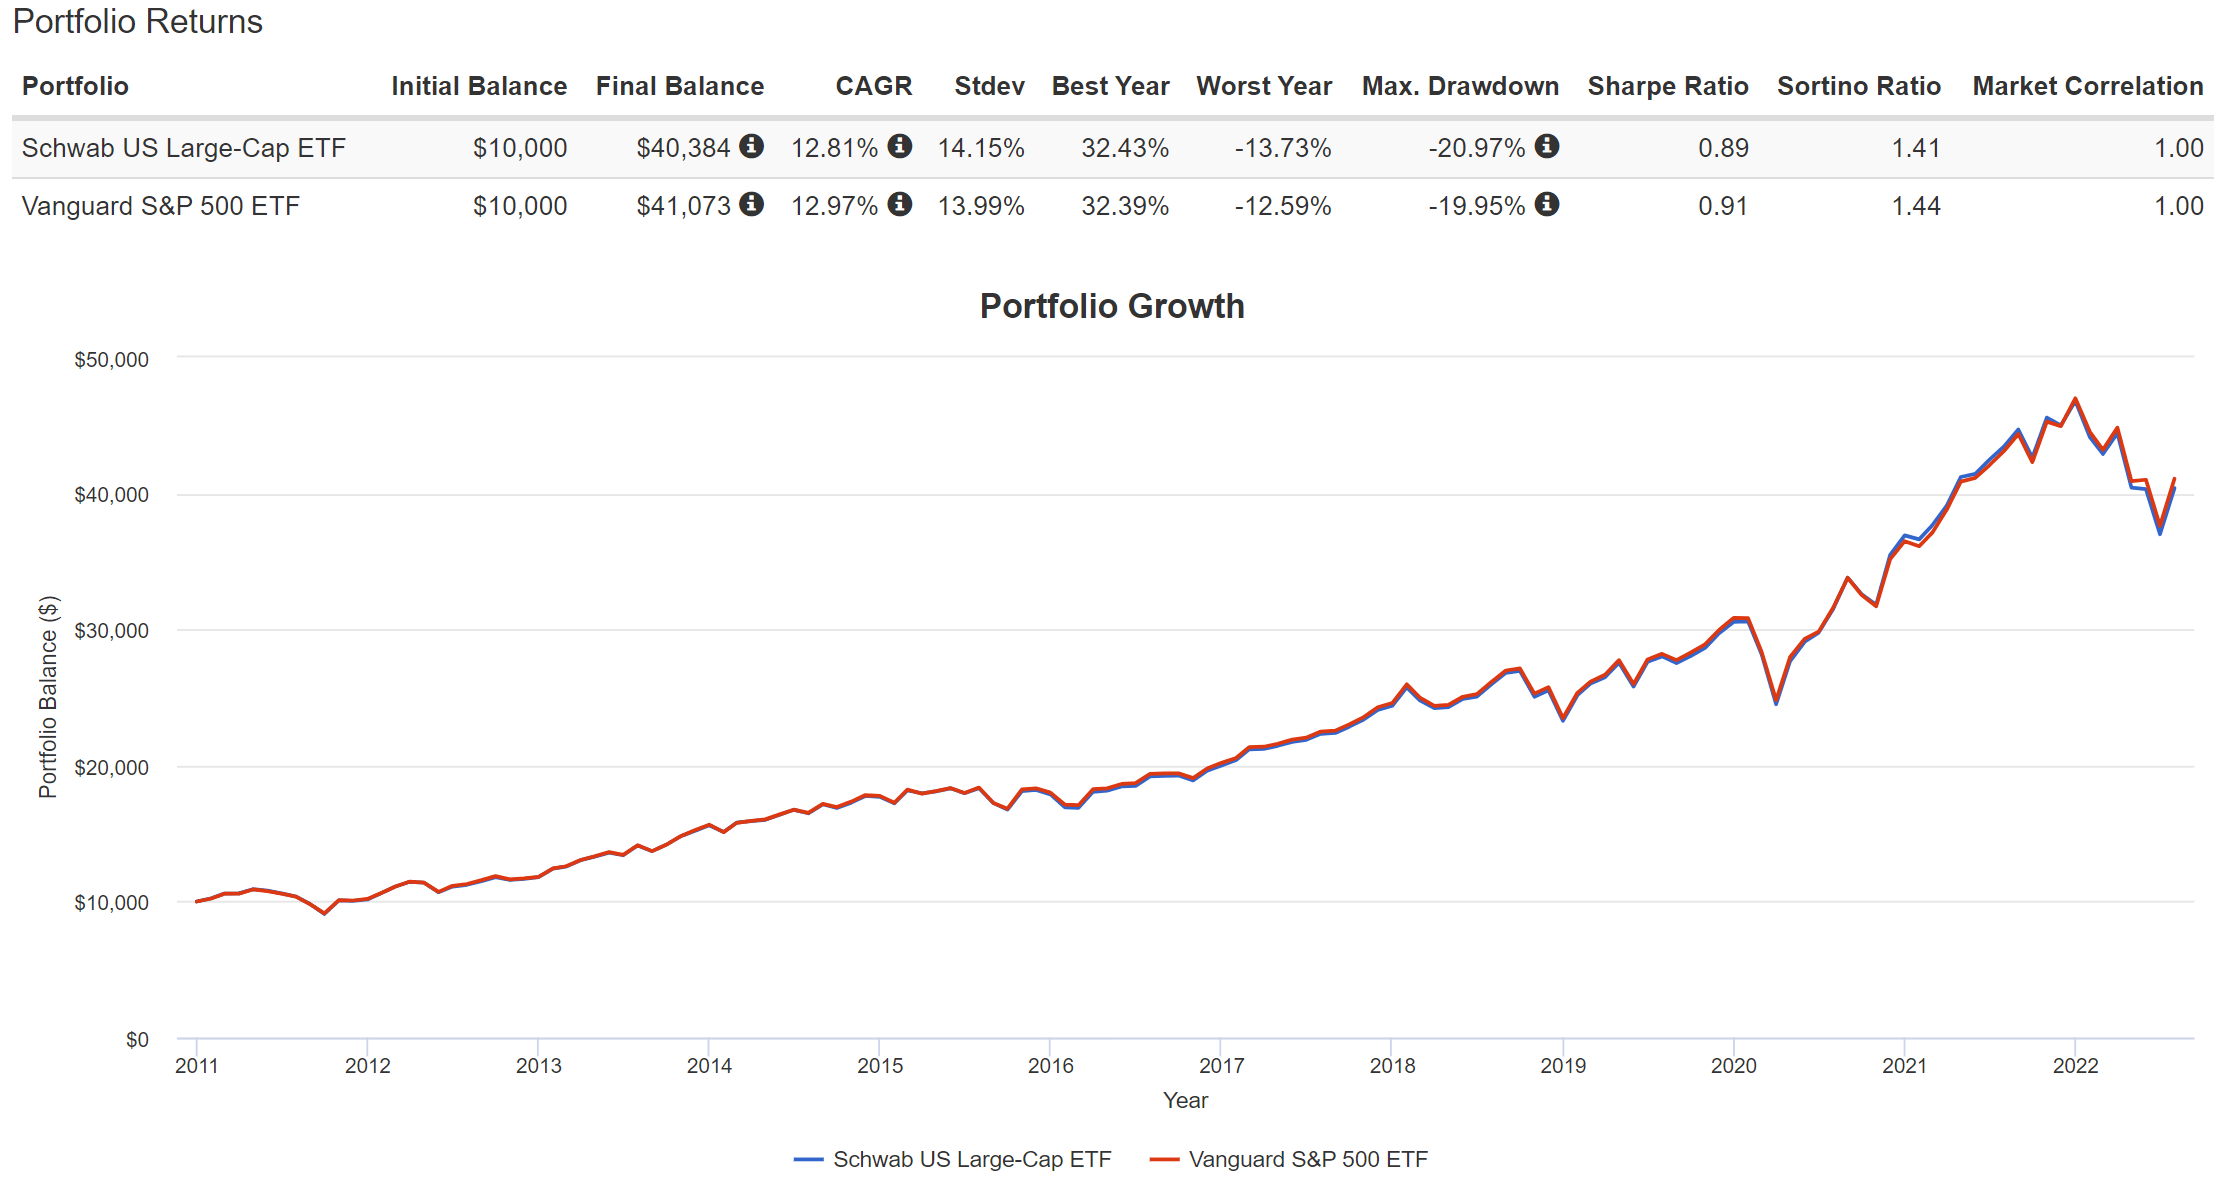
Due to the above high degree of similarities in their holdings, their performance closely tracked each other both in the short term as you’ve seen in the first chart above, and also in the long term as you can see in the chart below. Both SCHX and VOO have delivered healthy returns in the past (since SCHX’s inception in 2011). SCHX delivered a 12.81% CAGR, and VOO has delivered a 12.97% CAGR. I think the difference here is totally random and completely due to a play of luck.
Although you can see SCHX’s larger volatility here again. SCHX has suffered higher volatilities overall due to the fact that ~250 of its holdings are smaller than VOO. This serves as another illustration of the limit of diversification – your risks do not automatically go down when you hold more stocks. In terms of standard deviation, SCHX’s volatility has been on average 14.15%, compared to 13.99% from VOO. In terms of worst-year performance, the comparison was a bit more dramatic (13.7% vs 12.6%). And in terms of maximum drawdowns, SCHX’s almost 21% drawdown was higher than VOO’s ~20% by about 1%.
Again, as long-term investors, we don’t view the above volatility as a negative for SCHX ourselves. They are quite close anyway.
Source: Portfolio Visualizer
SCHX and VOO: Dividend comparison
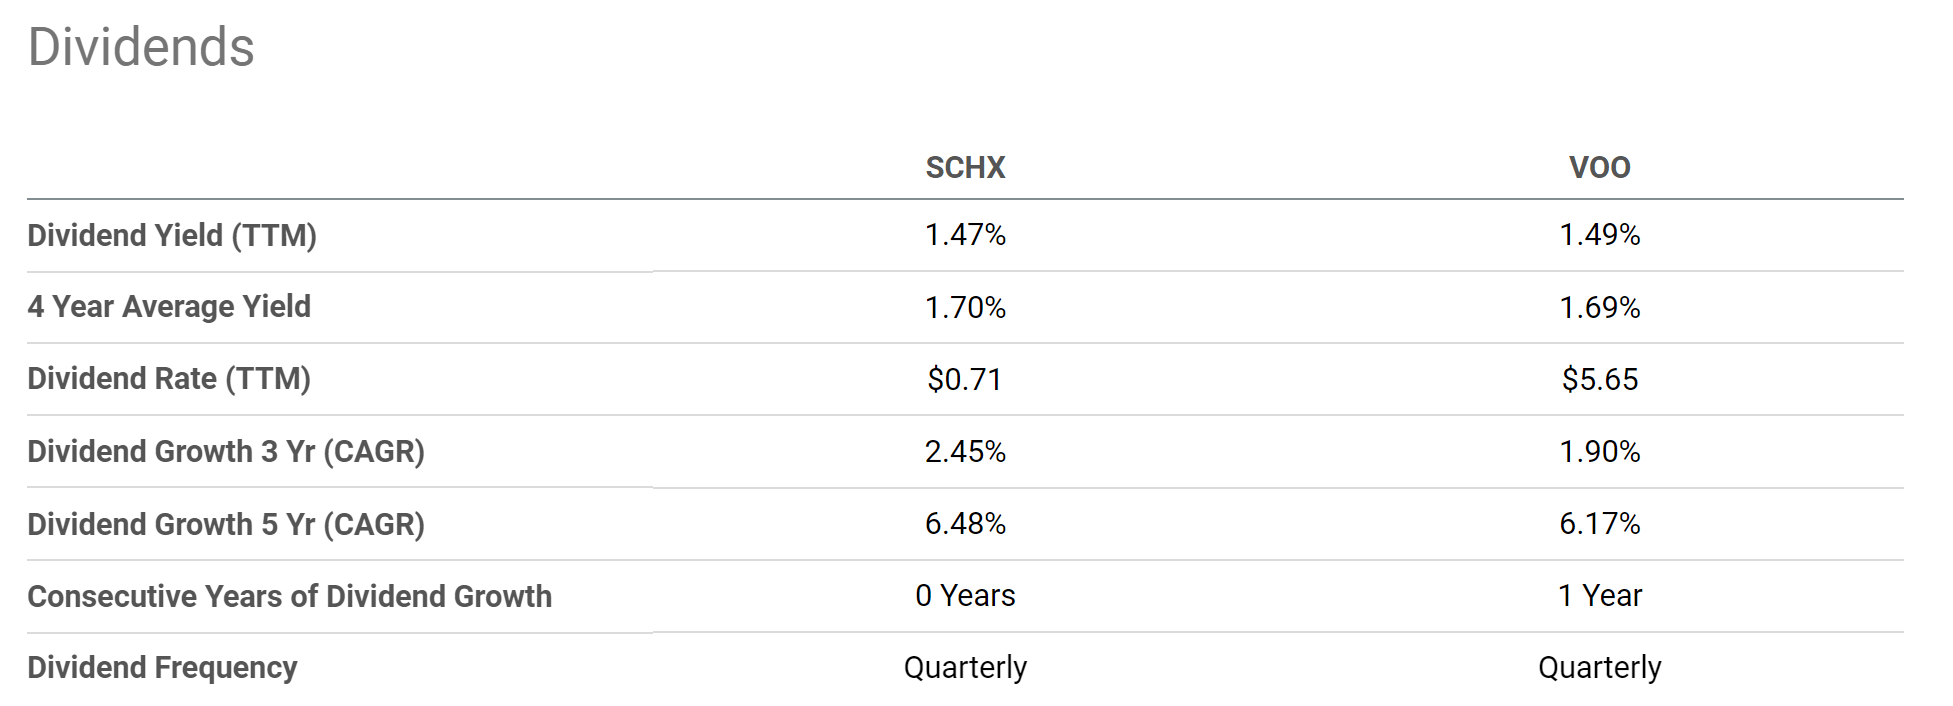
Now onto dividends. Due to the similarities already seen above, it should come as no surprise that their dividends are similar too. Both SCHX and SCHX are indeed providing essentially identical dividend yields as you can see from the following chart. SCHX is yielding 1.47% currently, and VOO’s yield is only 2 basis points higher (1.49%). Once we broaden the horizon a little bit, you will see that their historical yields also track each other closely. In the past 4 years, the average yield from SCHX is 1.70% and 1.69% from VOO.
Also, this chart shows that despite recent price corrections, both funds are still trading at a premium relative to their historical levels. For SCHX, its current yield of 1.47% is about 14% below its historical average, signaling a 14% valuation premium. VOO’s current yield is about 12% below its historic average, signaling a 12% valuation premium.
Seeking Alpha
SCHX and VOO: return projections
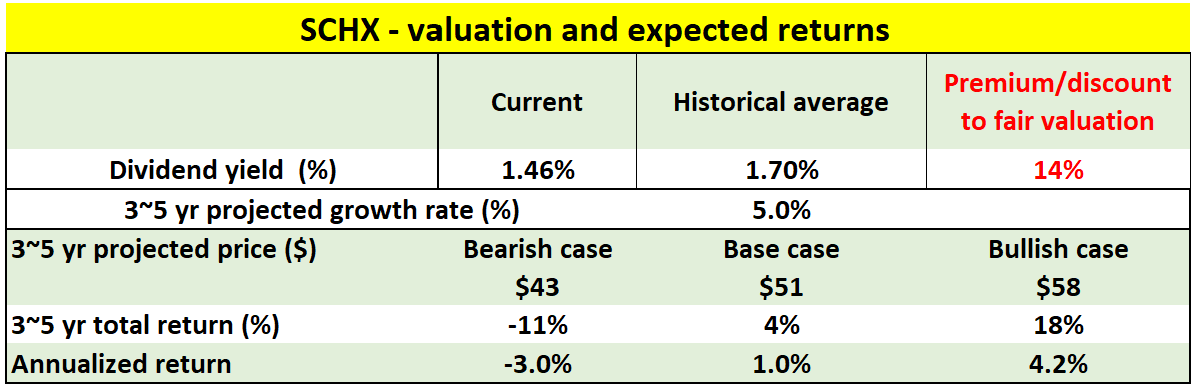
Based on the above valuation assessment, my return projections are shown in the next two charts for SCHX and VOO, respectively. In these projections, I assumed a 5% growth rate for the overall stock market. This is the nominal growth rate consisting of real GDP growth (assumed to be about 2%) and inflation adjustment (assumed to be about 3%).
As you can see, under these assumptions,
1. As a base case, the target price of SCHX in the next 3~5 years is projected to be $51. The base case assumed the valuation reverts to the mean (i.e., a dividend yield of 1.7%). And the total return would be only 4%, translating into an annual return of 1%. The reason is that the valuation premium would almost exactly cancel out the growth.
2. The bear case target price is around $43. In this case, investment at the current price would suffer a negative five-year annual return of 3.0%. The bear case assumes a valuation contraction to the bottom quartile corresponding to a dividend yield of 2%.
3. Finally, the bull case price is projected to be around $58. And in this case, investment at the current price will offer a decent annual return of 4.2%. The bull case assumes the valuation remains at the current premium level.
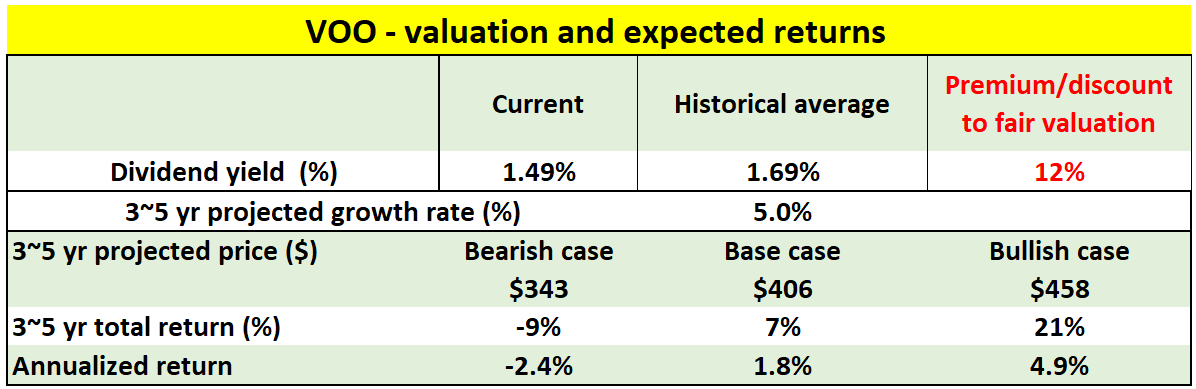
4. The projections for VOO are slightly better but really close. The numbers are a bit rosier for VOO because it’s overvalued to a slightly lesser degree than SCHX as aforementioned (12% vs 14%).
Author
Author
Final thoughts and risks
In the end, our conclusion is that both SCHX and VOO are essentially exchangeable funds to gain exposure in the large-cap space. They are both excellent funds in my view with rock-bottom low fees of 0.03%, tight trading friction, and ample liquidity. Recent market corrections have contracted their valuations by about 20% in terms of the Shiller CAPE, although both are still trading at a mild premium compared to their historical averages (about 12% to 14%).
Finally, risks. Both funds suffer the same structural risks such as the macroscopic risks facing the overall U.S. economy. There are signs of a recession in the near future, such as the inversion of the yield curve, and also the headwinds reported by leading bellwether stocks such as JPMorgan and Walmart recently. Specific to SCHX, it has large volatility risks than VOO as mentioned, and investors do need to consider their own risk profiles and investment timeframe.
Finally, my valuation and return projections are based on dividends. Although dividends are an excellent indicator of the true owners’ earnings, they have their own limitations. As detailed in our earlier article:
Dividend yields do not always reflect business fundamentals due to several factors such as tax law, political climate, the composition of the market index, et al. As a result, we do not directly use dividend yields in our investment or asset allocation decisions. In practice, we first adjust for the above corrections and then use the adjusted yield spread in our investment decision. But the data and approach illustrated here is the first place we check.
Be the first to comment