

undefined undefined/iStock Editorial via Getty Images
Introduction
We review our investment case on Schroders plc (OTCPK:SHNWF), a leading U.K. asset manager, whose shares are trading at 10.6x 2021 EPS and a 5.5% Dividend Yield.
We initiated our Buy rating on Schroders in March 2019, with a stated preference for its Non-voting shares. Since then Non-Voting shares have gained 38% (including 24% in dividends) in GBP after 3.5 years, a mediocre performance in our view, especially as GBP has fallen by 13.5% against USD (from 1.33 to 1.15 approximately) in the same period:
|
Schroders Non-Voting Stock Share Price (Last 5 Years) 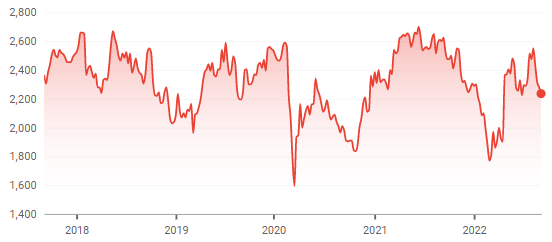 Source: Google Finance (05-Sep-22). |
(The more expensive Ordinary shares have gained only 19.3% in GBP since our initiation.)
Earnings growth has turned out much weaker than we expected. Revenue CAGR has been at mid-single-digits despite a low-teens assets CAGR, due to shrinking fee margins and a negative mix shift. Profit margin has not expanded, as Operating Expenses continued to grow faster than revenues. We believe these issues to be structural, and now expect Schroders to grow EPS at a CAGR of just 3-5%. While valuation metrics look superficially cheap, we do not expect them to change, which limits future annualized returns to high-single-digits.
We downgrade our rating on Schroders to Hold, meaning investors should avoid the stock.
Our Old Schroders Buy Case
Our old investment case saw Schroders being able to grow earnings at high single-digits, based on:
- Assets Under Management (“AUM”) growing at mid-to-high single-digits with inflows and asset price appreciation
- Revenues growing at mid-single-digits or higher, with AUM growth offsetting slightly declining fee margins
- Earnings growing faster than revenues, as asset managers have natural operational leverage
We believed Schroders would be able to achieve this as it is a best-of-breed U.K. asset manager enjoying both economies of scale and a strong brand name that would allow it to grow assets, retain talent and control costs.
Schroders’ AUM growth was much stronger than we expected, but revenue growth and expenses were much worse.
Schroders’ Performance Since 2018
The table below shows key financials at Schroders since 2018, along with the share price change since our initiation:
|
Schroders’ Comparison – Current vs. Initiation 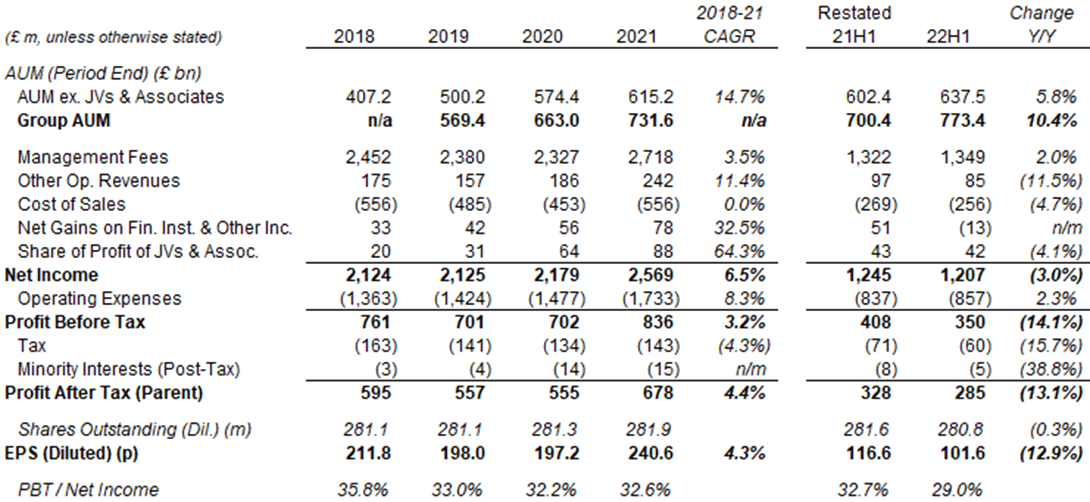 Source: Schroder company filings. NB. All figures are pre-exceptionals, and presented on a pre-2022 layout for consistency. H1 2022 and restated H1 20221 figures are on a different basis, with Wealth Management AUM restated and Schroders Personal Wealth moved into “JV & Associates”. |
We believe the 2018-21 period represented an atypically good period for Schroders. Asset prices reached a record level in 2021, more than recovering losses during the early stages of COVID-19. Schroders also gained £74bn of AUM in from a new relationship with Lloyds Banking Group (LYG). (Currency was broadly neutral in this period, with GBP/USD starting and ending it both at approximately 1.35.)
Schroders’ earnings growth has been much weaker than expected in 2018-21. When we initiated our Buy rating in March 2019, EPS in the preceding year (2018) was 211.8p; now EPS in the preceding year (2021) was 240.6p, implying a CAGR of just 4.3%. Subsequently, EPS was down 12.9% year-on-year in H1 2022.
Schroders’ valuation has also not improved. At our initiation, Non-voting shares were trading at a 9.3x P/E, relative to 2018 EPS; now they are trading at a 10.6x P/E, relative to the Pro Forma 2021 EPS that has been adjusted for the pending share class merger (covered in more detail below).
Fee Margins & Expenses Disappointed
The sources of the earnings disappointment in 2018-21 were fee margins and expenses:
- Assets Under Management, excluding JVs & Associates, grew at a CAGR of 14.7% in 2018-21
- Net Income, the equivalent of revenues for Schroders, grew at a CAGR of just 6.5%
- Management Fees, the most recurring part of Net Income, grew at a CAGR of just 3.5%
- Operating Expenses grew at a CAGR of 8.3%, faster than Net Income
- Profit Before Tax (“PBT”) grew at a CAGR of 3.2%, and PBT / Net Income fell more than 3 ppt
While AUM has been consistently growing each year, Management Fees in fact fell during 2018-20 and Net Income was relatively flat in those years. Operating Expenses, however, continue to rise consistently.
We examine some of these figures in more detail in the next section.
Overseas JV & China Risk
Share of Profit of JVs & Associates grew £68m (from £20m to £88m) in 2018-21; while this also resulted in Minority Interests growing £12m (from £3m to £15m), it would still have contributed approximately £40m of growth (assuming a 24% tax rate) to Profit After Tax to Parent Shareholders during the period, close to half of the £83m group total. This means growth in Schroders’ own business was weaker than even the headlines.
Moreover, 80% of the Share of Profit of JVs & Associates in 2021 were from China (from a 30% stake in a JV with the Bank of Communications (OTCPK:BCMXY)):
|
Schroders JVs & Associates (2021) 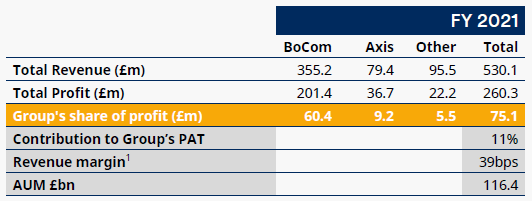 Source: Schroder results presentation (H2 2021). |
We have concerns about businesses over-exposed to Chinese regulations.
H1 2022 Flattered by Acquisitions & FX
H1 2022 figures showed above have been flattered by acquisitions and FX. While the market correction has helped pushed down Schroders’ AUM by £87.9bn, this was nearly entirely offset by acquisitions (£52.0bn) and FX (£34.2bn):
|
Schroders AUM – H1 2022 vs. 2021 Year-End 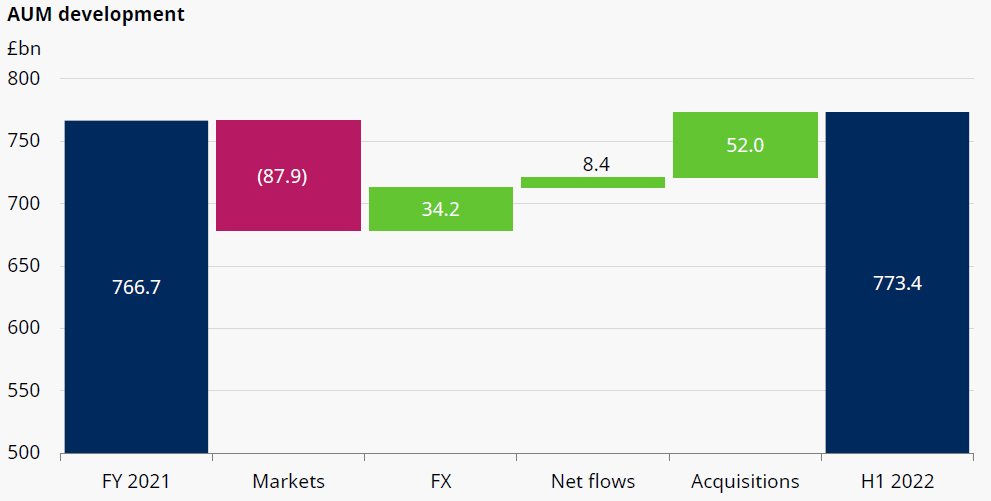 Source: Schroder results presentation (H1 2022). NB. AUM started 2022 at £766.7bn after two restatements added £35.1bn. |
Moreover, as much of the market decline happened relatively late in H1 (especially after the Russian invasion of Ukraine in late February), while performance fees are calculated on AUM figures each month, the real impact from asset price declines on Schroders’ P&L has not yet fully materialized.
Shrinking Fee Margins & Negative Mix Shift
Shrinking fee margins and negative mix shift are structural issues at Schroders, more than offsetting AUM growth.
AUM growth has been solid. Excluding JVs & Associates, AUM grew by 46% between the start of 2018 and the end of H1 2022 (from £435.7bn to £637.5bn). The transfer of assets from Lloyds was the biggest component, and acquisitions helped, but Net Flows and Markets & FX alone contributed £119.3bn, or on average 6% annually:
|
Schroders AUM Move By Source – Ex. JVs & Associates (2018 to H1 2022) 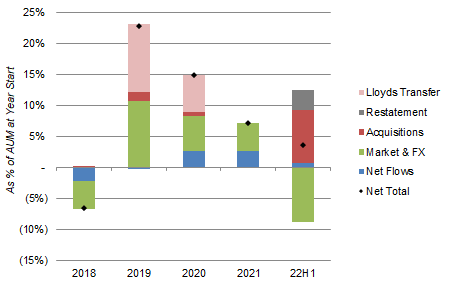 Source: Schroder company filings. |
Revenue growth has been much weaker, with margins shrinking. Operating Revenue Margin, which includes all income except performance fees and carried interest, has been falling in both Asset Management and Wealth Management:
|
Schroders Op. Revenue Margin by Division (2018 to H1 2022) 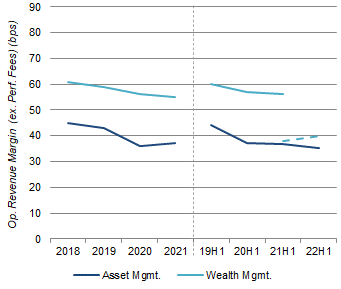 Source: Schroder company filings. NB. Wealth Management AUM restated in 2022, lowering fee margin. Asset Management fee margin estimated for H1 2021 and H1 2022. |
For Wealth Management, the decline in Operating Revenue Margin was partly the result of lower interest rates, which reduced Net Interest Income. Rate hikes meant the margin rose in H1 2022, but we expect the effect to be short-term as fee compression on investment products continue.
For Asset Management, the decline in Operating Revenue Margin the result of both shrinking margins within individual business areas and a negative mix shift towards lower-margin areas. Each business area has shown a downward trajectory in its Operating Revenue Margin, except for a brief respite during the market boom of 2021:
|
Schroders Op. Revenue Margin by Business Area (2018 to H1 2022) 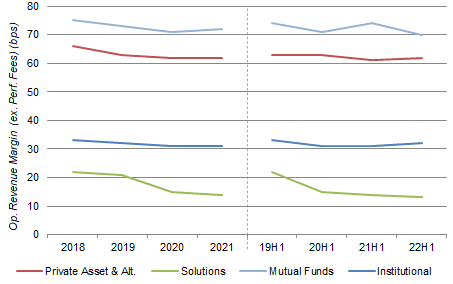 Source: Schroder company filings. NB. Wealth Management AUM restated in 2022, lowering fee margin. |
The market boom in 2021 boosted fee margins because higher-margin areas (such as equities) typically saw larger gains, and we similarly expect the effect to be short-term. Institutional margin rose slightly in H1 2022 due to the loss of a few lower-margin mandates, and did not mean that margins improved on a like-for-like basis.
Schroders’ AUM mix has also been shifting negatively in fee terms. As shown above, Mutual Funds has the highest margin, followed by Private Assets & Alternatives and Institutional, with Solutions having the lowest margin. Unfortunately, Solutions has been the largest area of AUM growth, contributing 41% of growth since 2019:
|
Schroders AUM by Business Area (2018 to H1 2022) 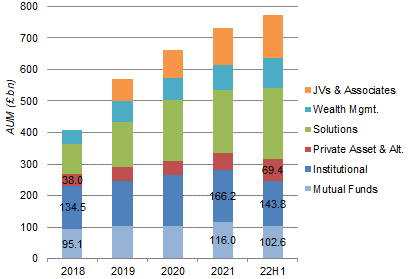 Source: Schroder company filings. NB. JVs & Associates AUM not disclosed for 2018. AUM restated up by £20.4bn for Wealth Management and £14.7bn for JVs & Associates in 2022. |
By contrast, AUM has grown with a CAGR of just 2% in both Mutual Funds and Institutional through 2018 to H1 2022. Private Assets & Alternatives is higher-margin than Institutional and has grown at a CAGR of nearly 19%, but from a small base so only partially offsetting the stagnation in Mutual Funds and Institutional.
The picture is even worse if we look at only Net Flows and not Market & FX. Across 2019 to H1 2022, Mutual Funds had a total net inflow of just £0.6bn, while Institutional had a total net outflow of £17.2bn; Private Assets & Alternatives had a net inflow of £15.0bn, but with the bulk (£9.2bn) occurring in H2 2021 and H1 2022:
|
Schroders Net Flows By Business Area – Asset Mgmt. Only (2019 to H1 2022) 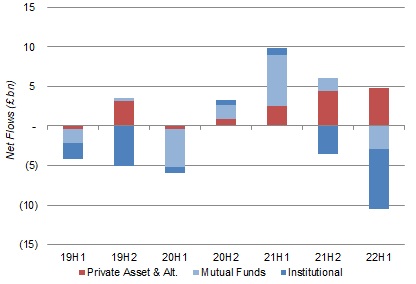 Source: Schroder company filings. |
We believe these issues to be structural – investors have been moving away from investment products in Mutual Funds and Institutional. As these two areas still represent more than 30% of group AUM and more than 50% of group Operating Revenues, the headwinds they face will likely continue to pressure group revenues for many years.
Lack of Operational Leverage
The lack of operational leverage has been another disappointment at Schroders.
Compensation Costs have risen from 43% of Net Income in 2018 to 45% in 2020, with the 45% figure now becoming the new target, thus precluding any operational leverage on people costs. Total Costs have been at around 67% of Net Income since 2019, which means there has been no operational leverage on non-people costs either:
|
Schroders Key Cost Ratios (2018 to H1 2022) 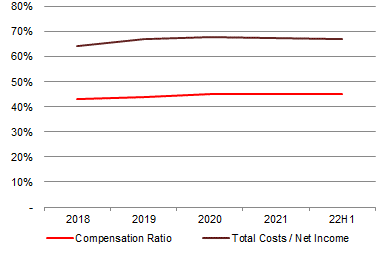 Source: Schroder results presentations. |
Management attributed part of the current non-people costs to an ongoing cloud migration that will deliver cost savings from 2024. However, management had in the past similarly attributed higher costs to a duplicated IT platform that was supposed to start disappearing in H2 2020, and no margin improvement materialized.
We do not expect margins to improve, so earnings growth will likely be in line with or lag revenue growth.
Pending Share Class Merger & Valuation
Schroders’ valuation metrics need to be adjusted for a pending share class merger.
Schroders has historically had two classes of shares, Ordinary and Non-voting, which have the same economic rights but only voting rights for the former. However, the valuation gap between the two became too wide and, as recommended by management, shareholders voted in August to merge the two share classes, with Non-voting shares also to be given voting rights, and Ordinary shareholders receiving three new bonus shares for every 17 they hold to compensate them for the dilution of their voting rights. (The new bonus shares will be issued on September 19 to shareholders of record on 16 September.)
2021 EPS was 240.6p for both classes of shares before the class merger. Adjusted for the new bonus shares, the EPS for each Non-voting share is diluted to 210.8p, while the effective EPS for each current Ordinary share is 248.1p:
|
Schroders EPS & P/E – Before & After Class Merger 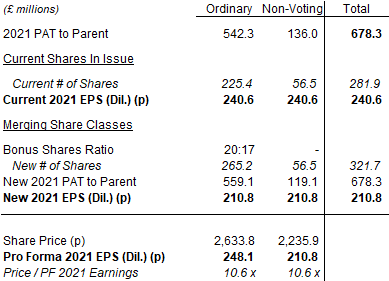 Source: Schroder company filings and Librarian Capital estimates. |
Pro forma the new bonus shares, both Non-voting and Ordinary shares are trading at 10.6x 2021 EPS. EPS will likely decline in 2022, having already fallen by 13% year-on-year in H1, so the real P/E is higher.
Schroders shares had declared dividends of 122.0p in the last twelve months, which (pro forma) implies a Dividend Yield of 5.5% for both classes. The dividend is well-covered, with a Payout Ratio of 58%.
On a blended basis, Schroders shares have a Free Cash Flow Yield of 8.5%:
|
Schroders Cashflows & Valuation (2017-21) 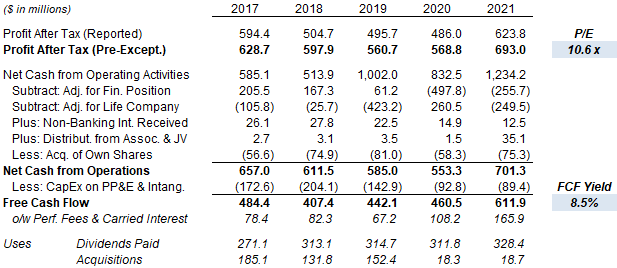 Source: Schroders company filings. |
Schroders had a capital surplus of £622m at H1 2022, equivalent to 9% of the current market capitalization. Management stated that they expect to have more buybacks after the share class merger, whereas the share count has been growing slightly in the past. However, no explicit targets have been given.
Is Schroders A Buy? Conclusion
We expect annualized investor returns in Schroder shares to be high-single-digits, consisting of the 5.5% Dividend Yield a 3-5% EPS CAGR, and no changes in valuation rating.
The 3-5% EPS CAGR is similar the 4.3% achieved in 2018-21, a period that included a large asset transfer from Lloyds and concluded with booming asset prices. We do not expect these positives to necessarily repeat over the next few years, while structural headwinds in shrinking fee margins and negative mix shift should continue.
A high-single-digit annualized return is below what we normally target. Schroders is also a weaker business and has a more uncertain future than others that are Buy-rated in our coverage.
We downgrade our rating on Schroders to Hold, meaning investors should avoid the stock.
Be the first to comment