


megaflopp/iStock via Getty Images
Investment Summary
Our diversified allocation to the broad healthcare spectrum continues to yield positive alpha in the back end of FY22. One standout is our buy thesis on Sanara MedTech Inc. (NASDAQ:SMTI) that’s rallied 19.5% to the upside from our last publication to the time of this report. As a reminder, our buy thesis on SMTI is built on the following factors:
- The differentiated exposure to non-surgical wound care via its CellerateRX hydrolyzed collagen surgical powder. We noted the size of the global hydrolyzed collagen market was poised for CAGR 7.8% into 2032. Management foresee an addressable market of ~12,000 hospitals in the U.S that it can sell into, and it had already approved to be sold in 1,580 facilities at the time.
- Revenue growth of 54% YoY with sequential revenue upsides each quarter since 2016. On average, each revenue print had also been a record for the company to that point.
- Completed the Scendia Biologics acquisition, adding a suite of complementary products to its Cellerate division. In particular, we opined the acquisition was complementary to the Amplify and Allocyte product lines, SMTI’s cellular and bone matrix offerings. We also observed SMTI’s goal was to expand Scendia into all 50 states.
You can read our last SMTI report here:
We have remained constructive on SMTI since our last publication and following the company’s latest set of numbers we’re back at it today to discuss our latest findings and reaffirm our buy call on the stock. Net-net, we are searching for targets to $39 then $47.90 as previously discussed.
SMTI Q3 earnings continues the fundamental momentum
Starting with SMTI’s latest set of numbers, we note it was an exceptional quarter of growth for the company, adding bullish weight to the risk/reward symmetry.
We saw that YTD, CellerateRX was sold within 662 hospitals and ambulatory surgery centres in 28 states.
Compared to the last quarter, the product was approved to be sold in 1,714 centres, an increase of 134 for the quarter or 8.5%. This brings the company a good step further to its 12,000 goal.
It’s also worth noting that Scendia sales pulled in $3mm for the quarter with upsides reported across its product portfolio.
Related to the above, management are said to be focusing on Amplify, verified inductive, advanced cellular bone matrix, bioactive mobile matrix and Texigen, amniotic membrane allograft within the Scendia portfolio as complementary offerings with CellerateRX. This will serve as a good litmus test going forward to see how it goes folding these into the CellerateRX portfolio.
Exhibit 1. SMTI sequential revenue growth continues to build momentum with record revenue prints on average each quarter to date.
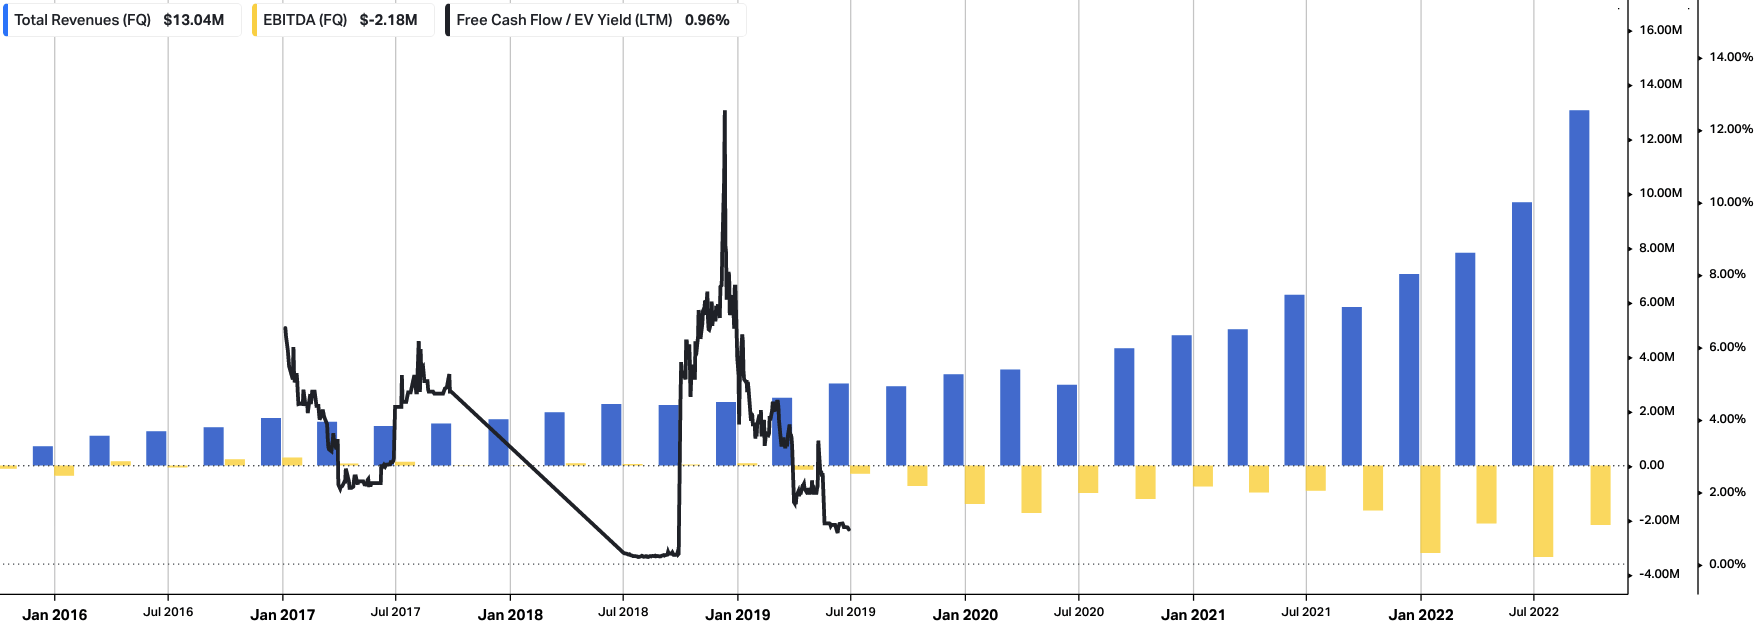
Note: FCF yield is negative in the periods where it is not plotted. We have opted to exclude the periods where SMTI realized a negative FCF yield. TTM yield is calculated as (TTM FCF / rolling enterprise value) (Data: HB Insights Estimates)
Notable takeaways from the company’s financials include the following:
- Revenue growth of 124% was another record for the company booking $13mm for the quarter [Exhibit 1]. Growth was underscored by the deeper customer network, and its expansion into additional sales territories.
- We’d note that the company now has 36 field sales managers on its books and this could be a tailwind to bulk distributor partnerships going forward. At the 36 headcount, each field sales manager hypothetically oversaw $361,111 in revenue generation for the period.
- With respect to the precision healing imager, SMTI opted to delay its 510(k) application, citing “an electrical firmware issue that has now been resolve” on the earnings call. The highlight being that it intends to submit the application by the end of the year, and hence any approval for clearance would be an additional tailwind by FY22 year end or early FY23 in our estimation.
SMTI technicals pointing to appropriate entry, scaling
The following series of charts cover our technical analysis of SMTI. We’d note, that a large part of our investing strategy in FY22 has been to closely inspect technical indicators to gauge market positioning and price visibility.
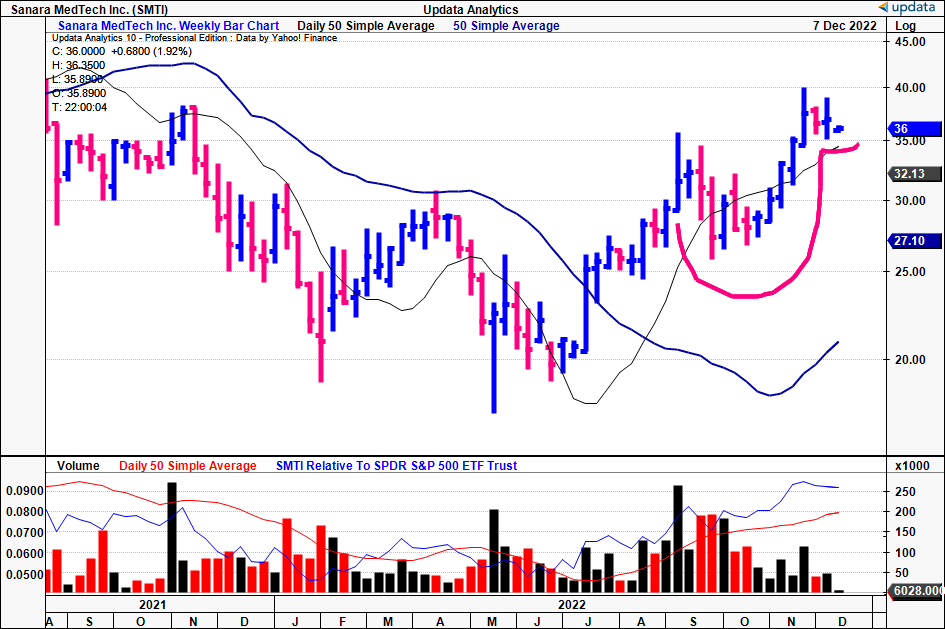
You can see that since our last publication the stock has continued within its longer-term uptrend. It has just formed a 14-week cup and handle and bounced off the 50DMA in the last 3 weeks of trade.
At the same time, volume has been relatively strong into the formation of the latest leg up. In this vein, the stock has made new highs, and we are of the opinion this looks to extend further.
Exhibit 2. SMTI 18-month weekly price action – 14-week cup and handle with latest move pushing off the 50DMA
Data:Updata
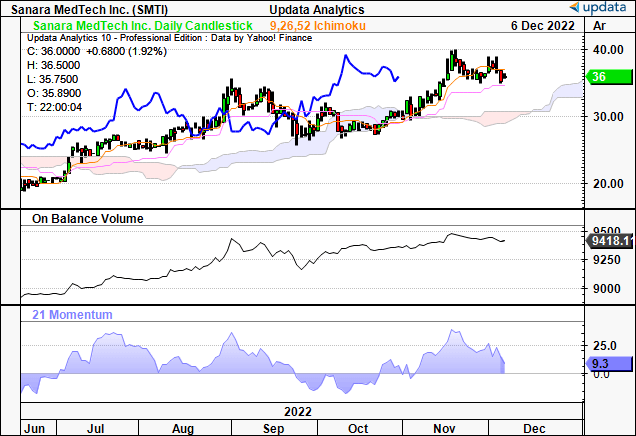
In terms of the trend itself, you can see below that shares are trading well above cloud support, with the lag line closely behind.
At the same time, on balance volume has pushed higher in continuation of its longer-term uptrend as well, demonstrating long-term accumulation/buying support. The cloud itself is blue and shifting higher, with the mouth of the cloud widening along the time series.
In our opinion, these trend indicators suggest there is validity and reliability in the trend, supporting our bullish position.
Exhibit 3. Trading above the cloud with tremendous buying support evidenced by on-balance volume trend
Data: Updata
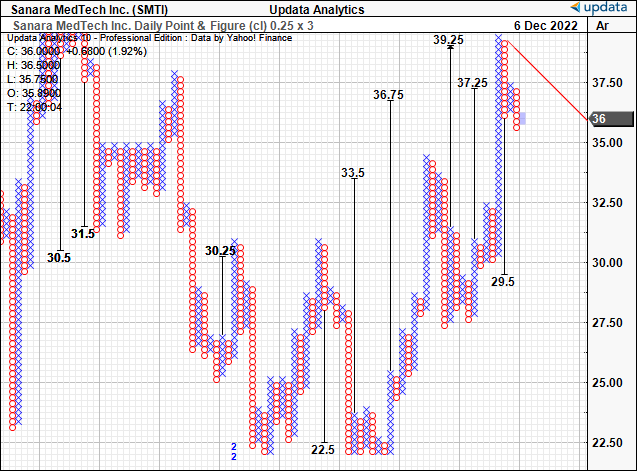
As such we have technically derived targets pointing to $39 as the next price objective, again adding bullish weight to the investment debate. These targets have served us well to date to gauge price visibility. Note, $39 was our base price target assigned in the last publication on SMTI.
We’d set the upper bound of our suggested price range to $47.90, and continue to look for this level. Hence we reiterate this target and look forward to providing a new suggested price range if/when the stock takes this level out.
Exhibit 4. Upside targets to $39 – identified as the price objective in our last publication as well
Data: Updata
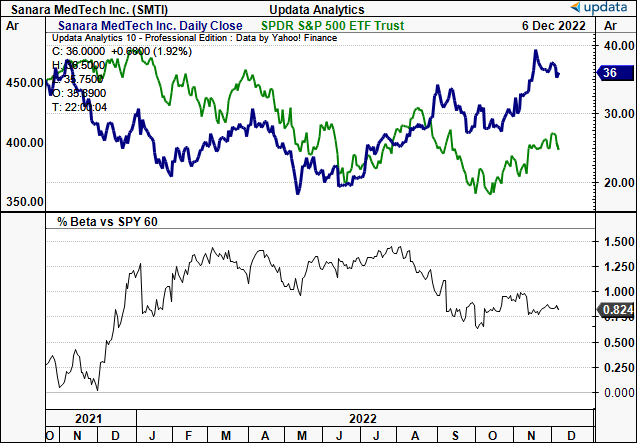
And finally, just to cap things off, we’ve identified a divergence in SMTI’s price evolution to its covariance structure to the benchmark. As you can see below, as the stock has rallied off its May lows, its equity beta has been drifting lower at the same time.
To us this suggests that investors are rewarding the stock based on idiosyncratic risk premia, and that its rally isn’t just a function of equity beta. In fact, this is a favourable setup in our opinion as it likely suggests there is validity in the rally, and that buyers are past the majority of overhead supply in the stock. Again, this confirms our buy thesis going forward.
Exhibit 5. SMTI price evolution vs. S&P 500 and corresponding equity beta
Data: Updata
Conclusion
We reaffirm our buy thesis on SMTI. There is ongoing support for the stock itself and for the company’s products in the end-market, evidenced by the 124% YoY growth in revenue this quarter. We are still looking for upsides to $39 then $47.90 in this name, and technical studies indicate it could be well on the way there, backed by the robust fundamental momentum to date.
Be the first to comment