

Jian Fan/iStock via Getty Images
If you are a cloud software investor, the past few months have been a roller coaster.
To illustrate:
- The S&P 500 (SPY) is down 18%.
- The Nasdaq (QQQ) is down 27%.
- The WisdomTree Cloud Computing ETF (WCLD) is 57% (!) off its high.
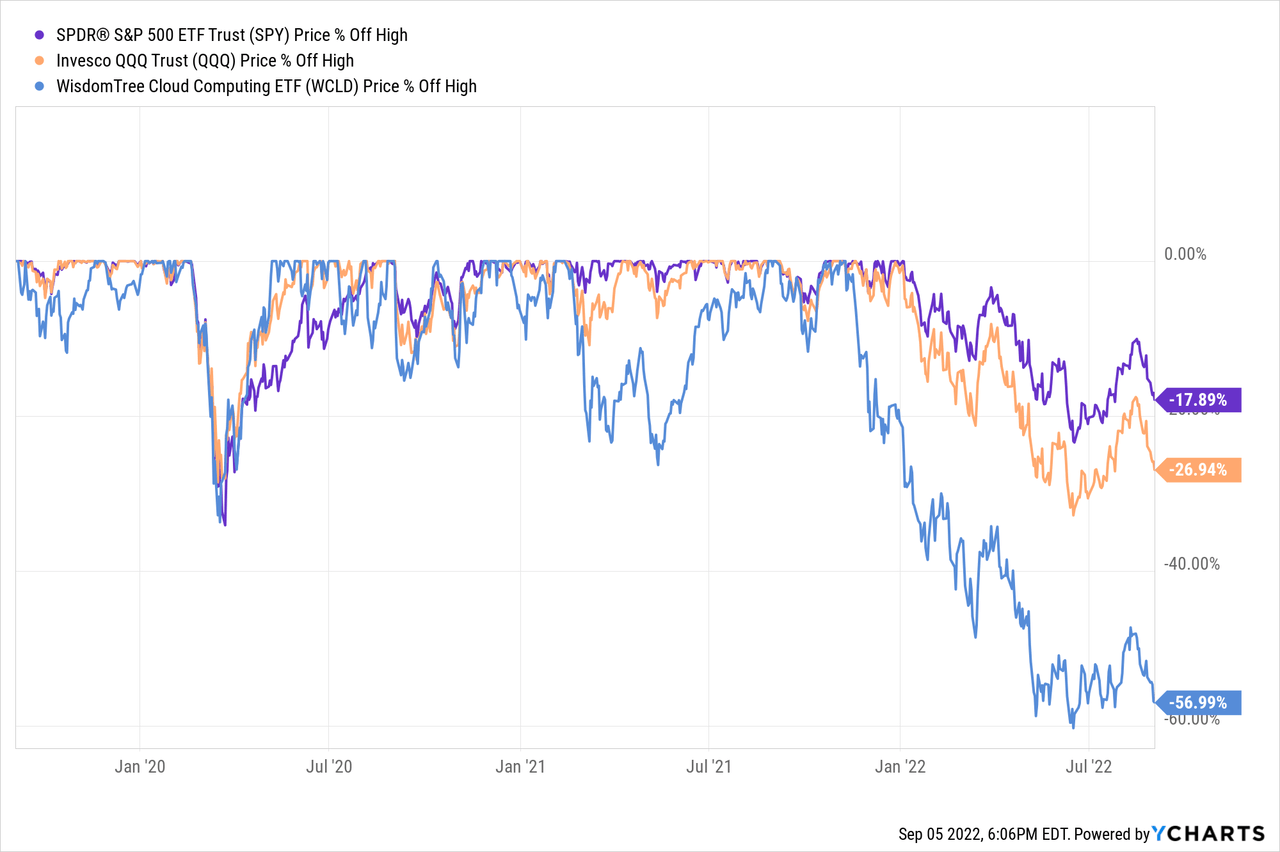
Of course, it often gets even worse if we zoom in on individual stocks.
There is no way to know what will happen next, no matter what crystal ball you are looking at. Of course, most investors suffer from recency bias and assume there is more pain ahead.
According to AAII’s sentiment survey, only 22% of investors are bullish now, and more than half are bearish. Remember that sentiment is a contrarian indicator since the best investment opportunities occur in times of extreme fear.
Sentiment Votes (AAII Investor Sentiment Survey)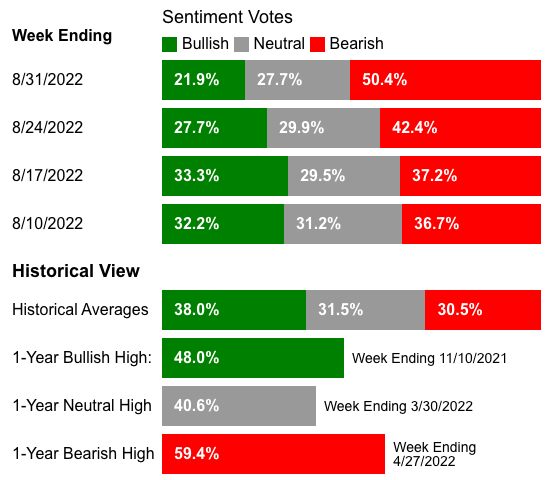
While I can’t speak for where the market is going (I don’t know), such a bearish sentiment has created better entry points for many outstanding businesses that used to trade at astronomical valuations in 2021.
- Could they fall even more? Absolutely.
- Are they looking increasingly attractive? Certainly.
I don’t waste my time trying to time the market. Members of App Economy Portfolio are familiar with the four simple rules I follow to protect my portfolio.
- I stage my investments over time (a fixed amount every month).
- I avoid throwing too much at my highest convictions (max allocation).
- I don’t let myself pile up on my losers.
- I hold onto my winners for years, letting them take over my portfolio.
This approach removes any form of market timing. Instead, I invest at market tops and market bottoms. I believe this strategy will pay off over a lifetime of investing.
While the macro environment is causing a lot of uncertainty, the migration to the cloud has continued its march forward unabated. Grand View Research projects US cloud computing to grow at +18% CAGR, illustrating the growth potential for the leaders in these categories.
Global enterprise IT spending (Gartner via Benedict Evans)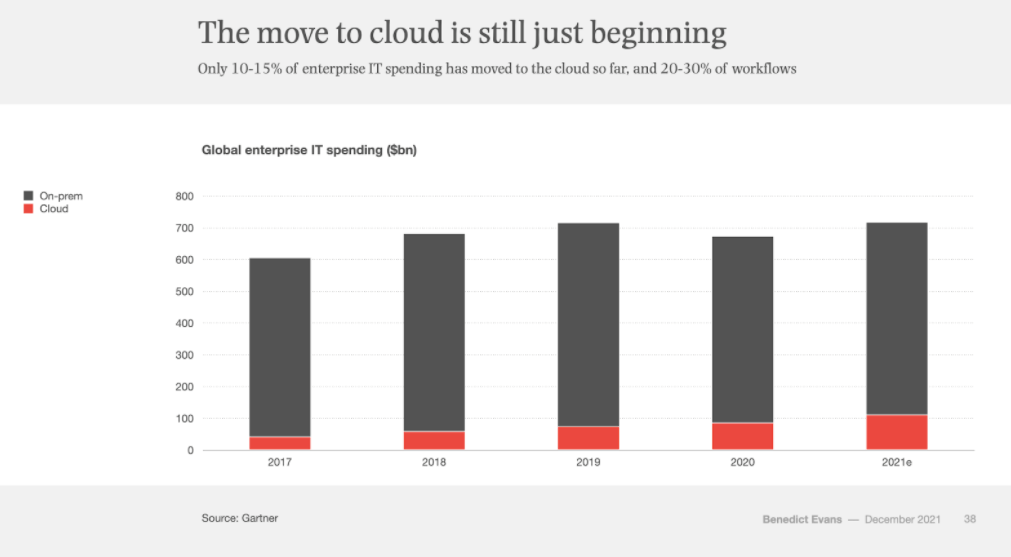
In the current macro environment, many investors are focused on guessing where inflation will be in the next six months or what the Fed will do next. They listen to whoever is willing to make an educated guess. Unfortunately, that’s a terrible use of their time.
As beautifully put by Peter Lynch:
“Nobody can predict interest rates, the future direction of the economy, or the stock market. Dismiss all such forecasts and concentrate on what’s actually happening to the companies in which you’ve invested.”
So let’s apply these wise words and focus on business performance.
Let’s review what we have learned from the recent earnings season and put valuations in a historical context.
Muted Outlooks
We have evidence that Q2 was relatively weaker in a challenging macro environment.
Historically, Wall Street’s expectations match the high end of the guidance provided by management in the previous quarter.
Management teams tend to provide conservative outlooks to allow for a slight overperformance; an approach also called “underpromise and overdeliver.”
Jamin Ball illustrated that:
- The median guidance beat was 2.3%, short of the historical ~4.5%.
- The median guidance raise was only 0.1%, short of the historical ~2.5%.
Q2 relative beat and raise (Clouded Judgment)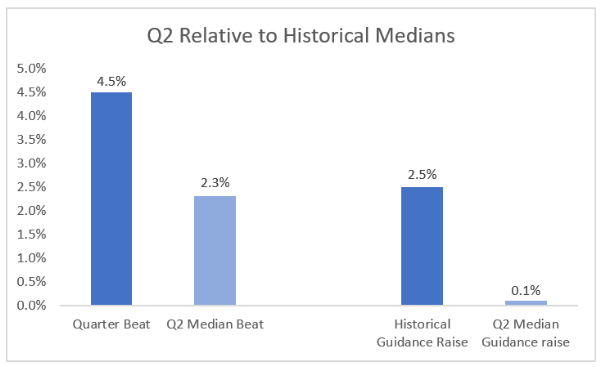
So while Q2 remained a decent quarter compared to Wall Street’s expectations, it came short of the usual beat.
The full-year outlook was muted, with many companies merely maintaining their guidance despite the outperformance of the most recent quarter (essentially implying a lowered guidance for the rest of the fiscal year).
There is a wide range of factors at play:
- Longer sales cycles with more C-level scrutiny.
- Softer usage for businesses with a consumption model.
- Management teams focused on mission-critical software.
- Softness in Europe, where the macro environment is worse than in the US.
We don’t know if the conservative guidance for the rest of the year is warranted. Unfortunately, just like the rest of us, management teams cannot accurately predict macro movements.
The Market Focuses On Cash Flow
While each company has its own unique set of risks and opportunities, the market focuses narrowly on cash flow at the moment.
Consider this:
- We saw upswings of more than 20% for companies with cash flow margins ahead of expectations. Cloudflare (NET) and Snowflake (SNOW) come to mind.
- We saw dramatic collapses for companies that fell short with worsening cash flow margins. MongoDB (MDB) and Okta (OKTA) are perfect illustrations.
The graph below shows the past month’s post-earnings reaction for these four stocks.
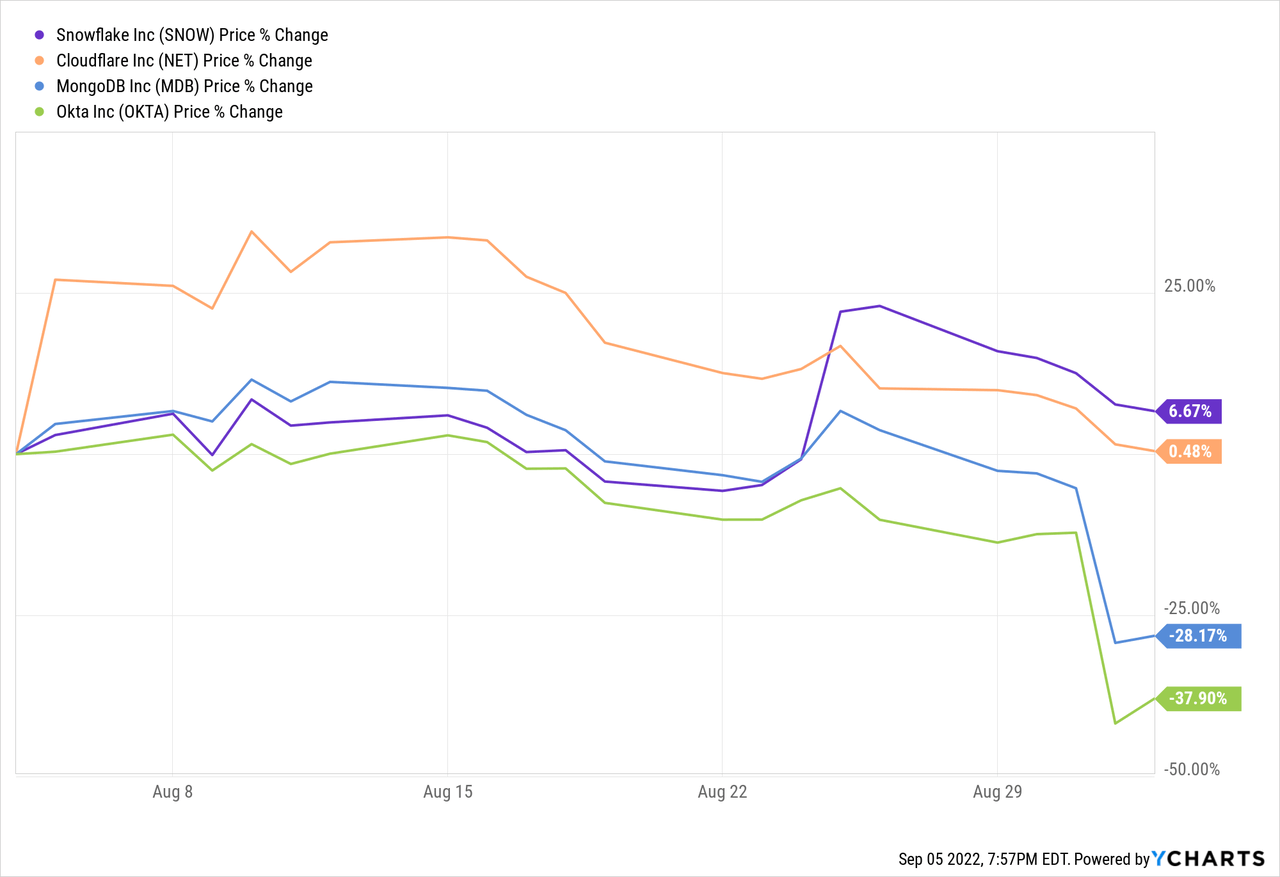
Another takeaway from the chart is the overall trend for all software stocks in the past month. Cloud stocks are down almost 20% in the past month based on the WCLD benchmark. So even the best performers like NET and SNOW remained flat.
A Look At The Rule Of 40
You are probably familiar with the Rule of 40.
As I keep refining my screening process before deciding where to invest next, I have come to realize that my biggest winners have an essential trait in common: they tend to satisfy the Rule of 40, the principle that a software company’s combined growth rate and profit margin should exceed 40%.
As explained by Thierry Depeyrot and Simon Heap, partners at Bain & Company:
“The Rule of 40 […] has gained momentum as a high-level gauge of performance for software businesses in recent years, especially in the realms of venture capital and growth equity. Increasingly, software industry executives are embracing the Rule of 40 as an important metric to help measure the trade-offs of balancing growth and profitability.”
I regularly update the “Rule of 40” chart for members of the App Economy Portfolio.
Some analysts like to use free cash flow margin as a profitability metric. It might make sense in the VC world, but I find it sub-optimal for public companies.
The use of stock-based compensation can be unequal, leading to an unfair comparison between companies and a flattering picture for those who abuse SBC as a tool to attract and retain talent.
So what am I using?
- X-axis: Revenue growth (Y/Y) from the most recent quarter.
- Y-axis: GAAP operating margin from the trailing 12 months.
I’m using the operating margin for the past 12 months to better reflect the performance of companies with some seasonality to their sales and marketing or R&D investments. Additionally, using GAAP numbers guarantees we are comparing apples to apples and including the impact of SBC.
The result is the chart below:
Rule of 40 chart (App Economy Insights)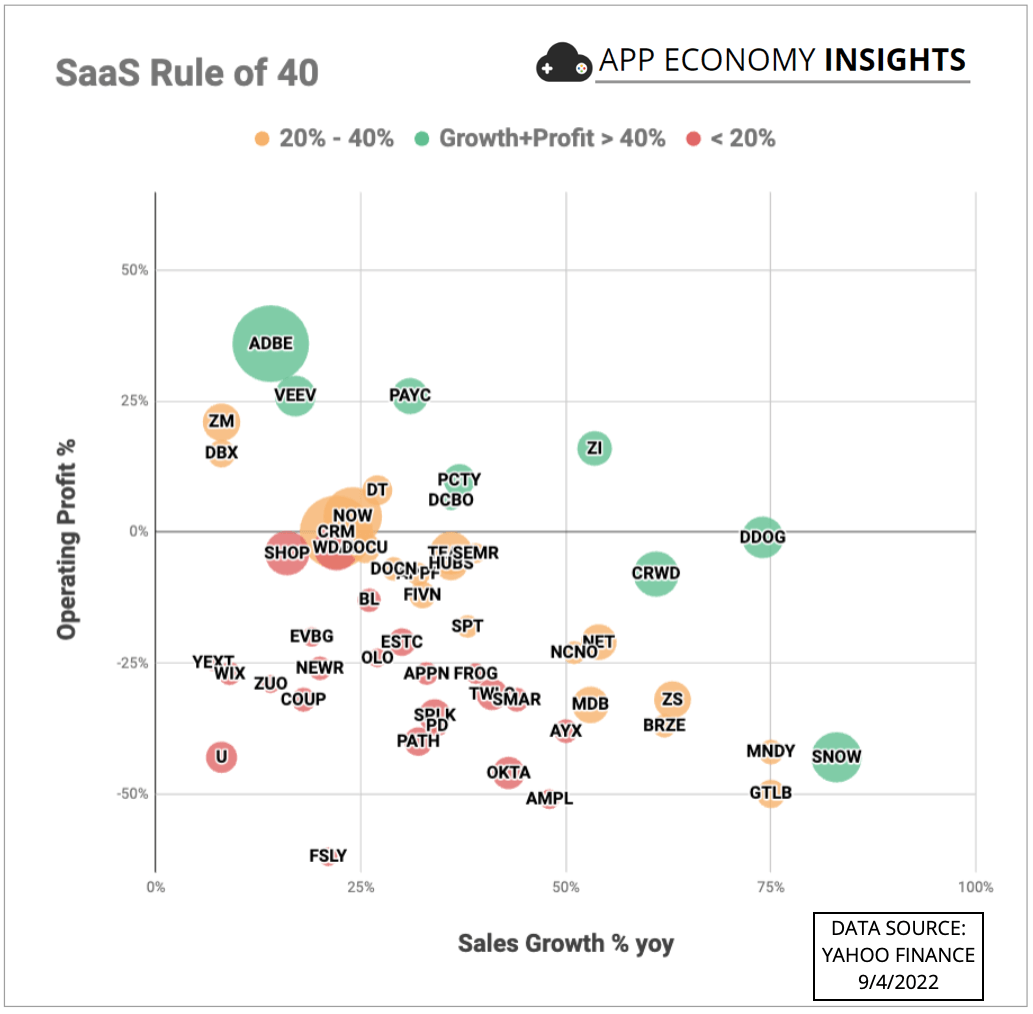
In the chart:
MDB, VEEV, PAYC, ADBE, AYX, TWLO, COUP, ESTC, APPF, NOW, CRM, TEAM, HUBS, FIVN, OKTA, NEWR, WDAY, ZS, U, DBX, NET, YEXT, WIX, BL, CRWD, FSLY, API, DOCU, SPLK, ZUO, APPN, PCTY, SMAR, ZEN, DDOG, ZI, DT, MNDY, EVBG, SHOP, OLO, FROG, SNOW, ASAN, SEMR, DCBO, ZM, PATH, PD, GTLB, AMPL, BRZE, SPT, DOCN, S, HCP, CFLT, BILL, NCNO.
This chart is handy to emphasize the performance of Snowflake. Despite the heavy use of SBC and a GAAP operating margin deep in the red, SNOW is a winner of the Rule of 40, thanks to unparalleled revenue growth.
I also find the chart compelling to appreciate the superior profile of companies like CrowdStrike (CRWD) and Datadog (DDOG).
Meanwhile, companies like Okta (OKTA) or Amplitude (AMPL) leave much to be desired based on their losses relative to their growth profile.
Of course, this chart is not a be-all and end-all formula. For example, I’m an investor in several stocks that would be considered losers of the Rule of 40.
Success is not linear, and it’s essential to appreciate the picture could be very different a few quarters from now with companies improving their profile. Conversely, a company like Zoom (ZM) used to be a massive winner of the Rule of 40 and didn’t yield great stock returns so far. So we can’t look at fundamentals in a vacuum.
This leads us to valuations.
Valuations: Where Are They Now?
Since many of these companies have yet to show a profit on a GAAP basis, we are left with only one metric to rule them all: [EV/NTM Revenue].
What does it mean?
- EV = Enterprise Value (market cap stripped of cash and debt).
- NTM Revenue = The next 12 months’ revenue (Wall Street estimates).
You may have heard of this as a forward-revenue multiple. The use of forward revenue is a way to factor in the rapid growth of some of these businesses and how they may “grow into” their valuation at a fast pace.
- X-axis: Revenue growth (Y/Y) + GAAP operating margin TTM.
- Y-axis: EV-to-NTM Revenue (forward-revenue multiple).
Rule of 40 vs. EV/NTM Revenue (App Economy Insights)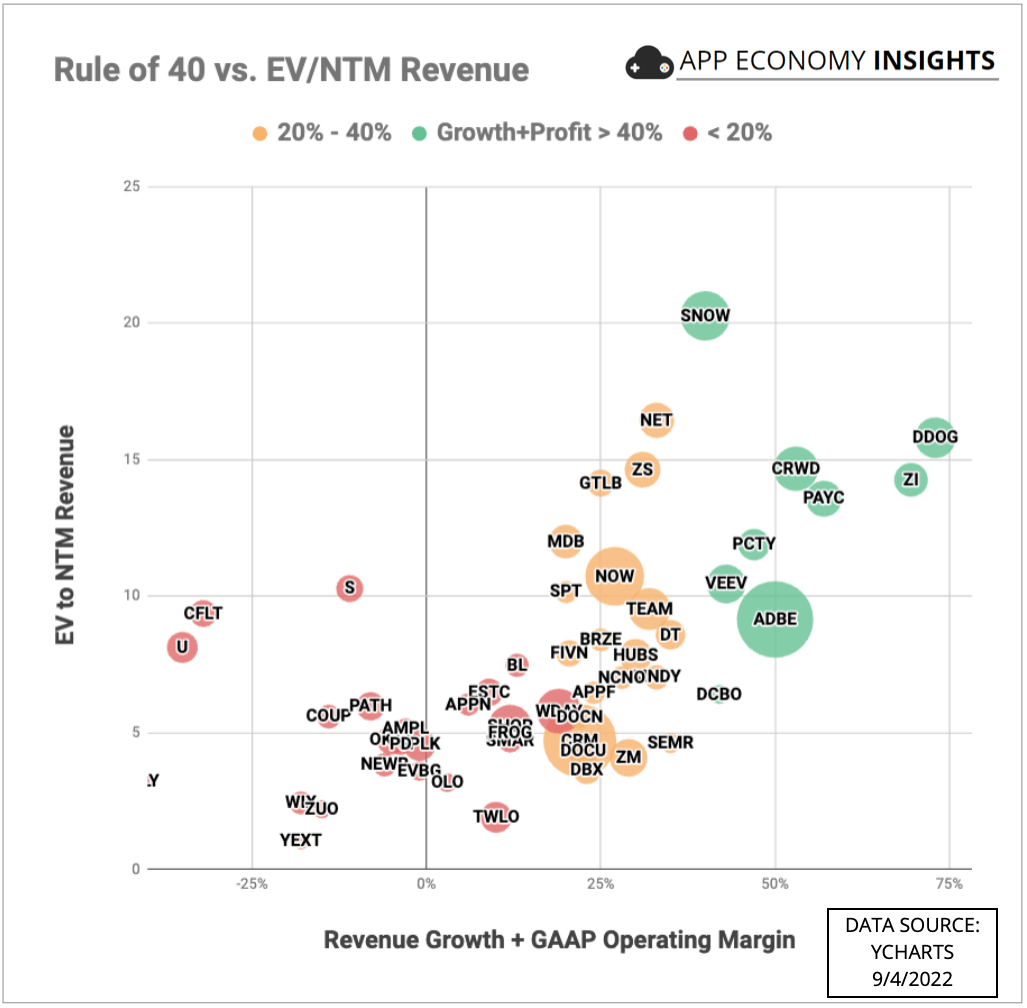
As you can see, there is a clear correlation between valuation and underlying performance. Many stocks that appear overpriced at first sight relative to other stocks have the fundamentals to justify it. Of course, short-term sentiment is another factor.
I would refrain from jumping to a conclusion solely based on this chart. It’s merely a bird’s-eye view to start additional research and dig deeper into companies that may appear attractive.
If we zoom out and look at how revenue multiples have evolved, there is no doubt we are back to historical rates after a bubble in 2021.
However, while most software stocks are trading more than 50% down from their 2021 high, they are now merely back where they were pre-COVID.
The chart below shows the “COVID roundtrip” of fast growers like CRWD, MDB, DDOG, and NET. Their multiples are now at a multi-year low, but I wouldn’t call them cheap.
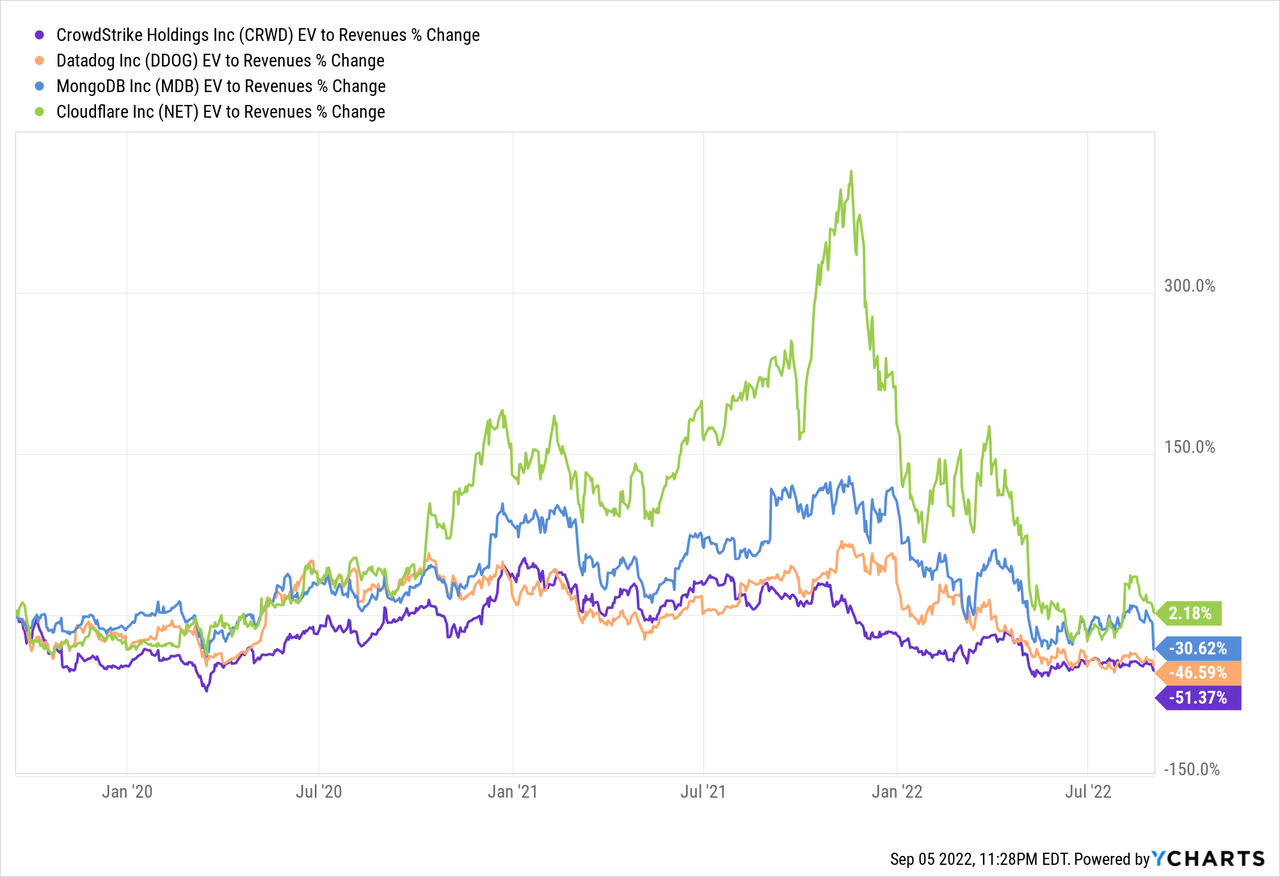
It might take only a few quarters for the valuation of the fastest growers to appear reasonable. The main caveat is that the more the valuation depends on future (unrealized) growth, the wider the range of outcomes and the higher the risk/reward profile of the investment.
Looking at more mature software businesses provides more context. For example, companies like Salesforce (CRM), ServiceNow (NOW), and Workday (WDAY) are all trading close to a 5-year low if we look at free-cash-flow multiples.
- NOW: 43 times FCF
- WDAY: 33 times FCF
- CRM: 27 times FCF.
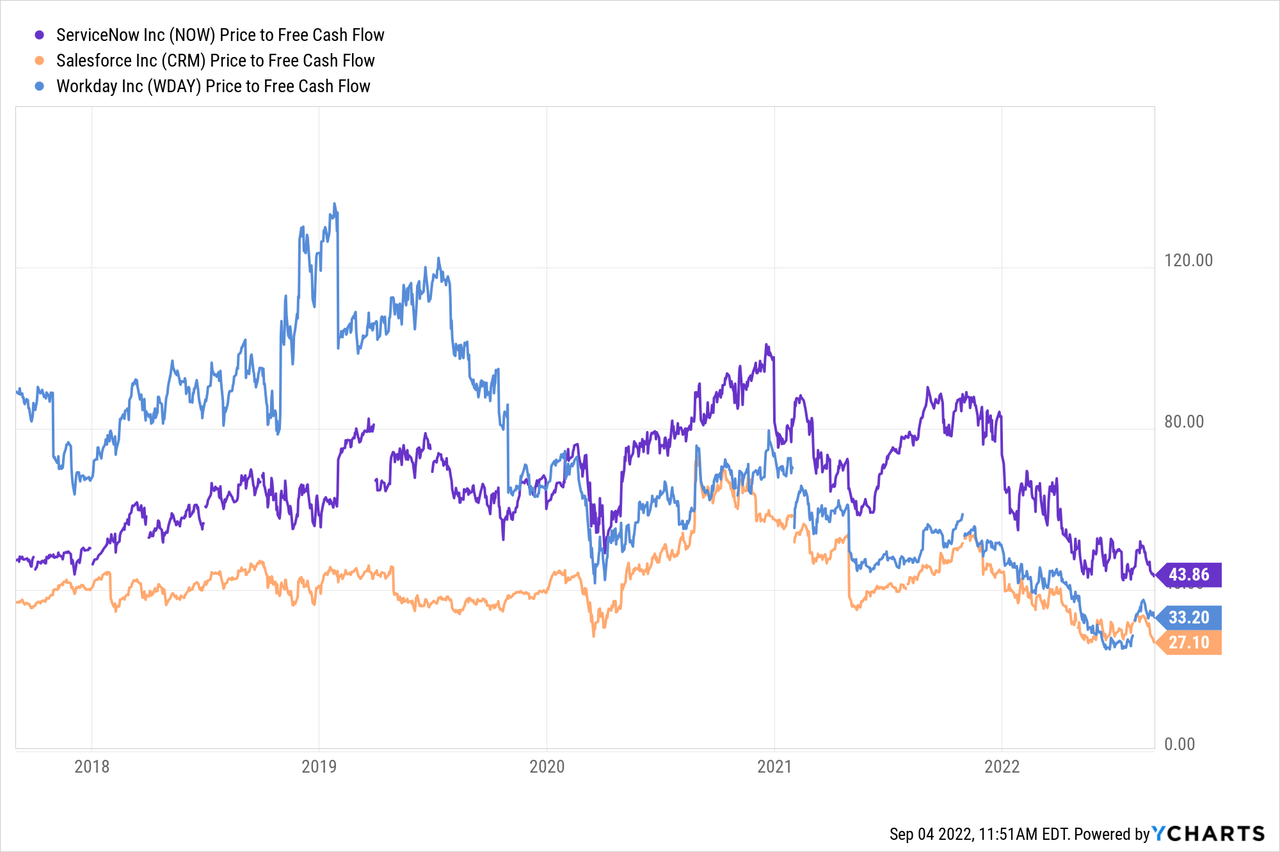
We are looking at businesses with durable long-term revenue growth rates in the ~20s and recurring revenue models. As a result, these entry points appear reasonable, particularly for investors with a multi-year time horizon.
A Tale From The Great Recession
Most software businesses I invest in are mission-critical or essential for companies to operate. However, a slowdown can affect all businesses in a potential recessionary environment.
We have seen household names struggle in a recession in the past. For example, during the Great Recession, Salesforce saw revenue growth collapse from 50% to 20% Y/Y. The graph below shows the drop in revenue growth from late 2008 to early 2009.
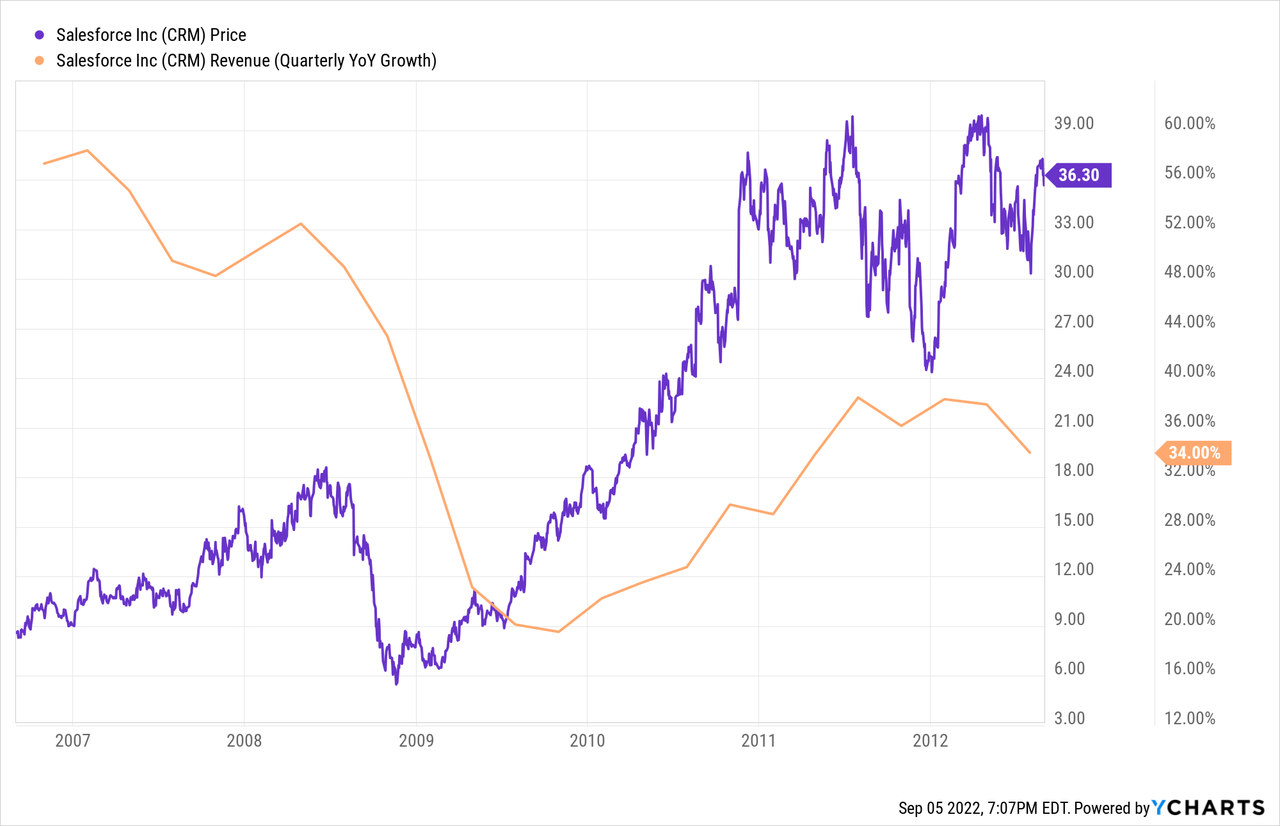
Revenue growth eventually re-accelerated after a few quarters.
However, it’s important to note the stock bottomed at the end of 2008. So the best time to buy CRM was when the business faced collapsing revenue growth in a challenging economy.
By the time we could see evidence that revenue growth was re-accelerating, the stock had already hit a new all-time high in 2010.
The market is always forward-looking.
Many individual stocks are beaten down today, far worse than the market.
Salesforce was one of the few public SaaS companies in 2008. So I looked at where CRM traded when the S&P 500 was down ~25% in October 2008. CRM was more than 44% down (a sell-off comparable to today).
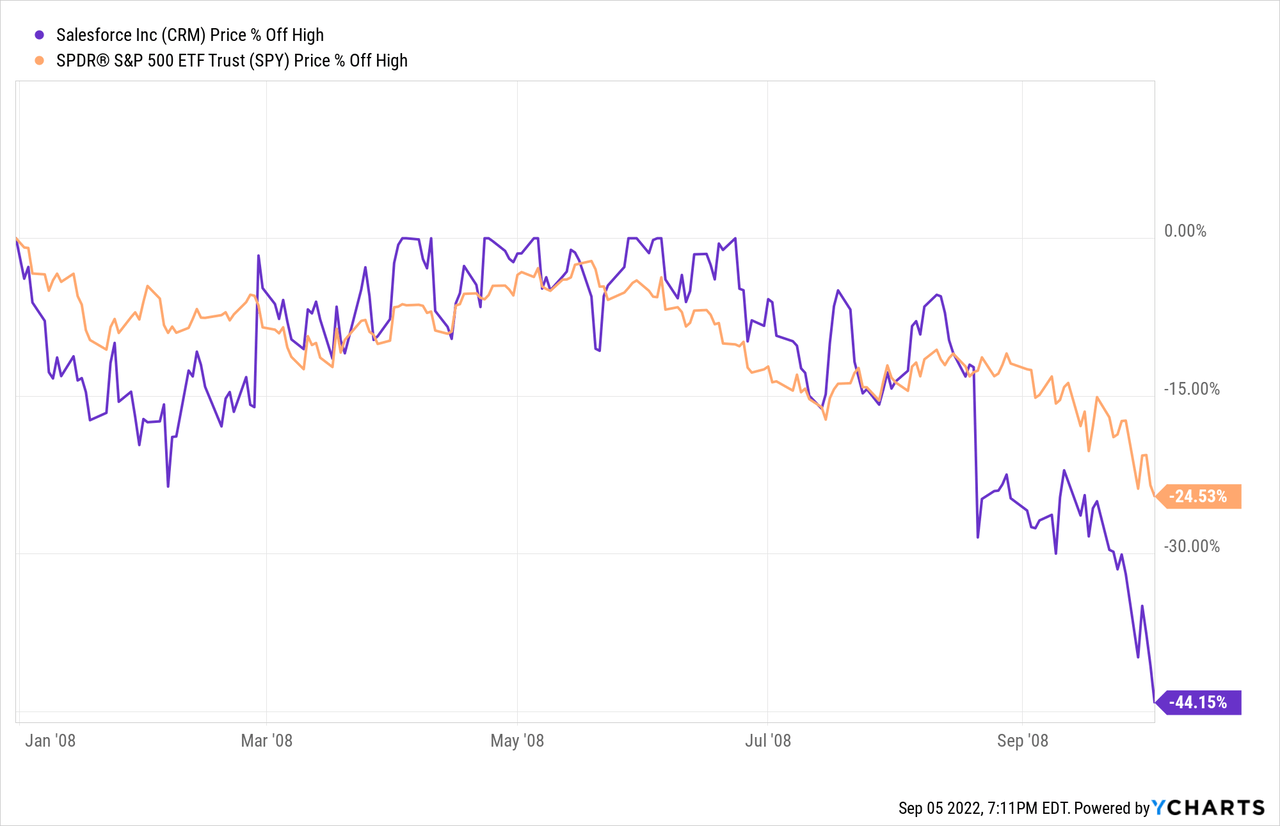
First, we must highlight that the S&P 500 dropped 48% from its previous high by March 2009. So we were far from the bottom.
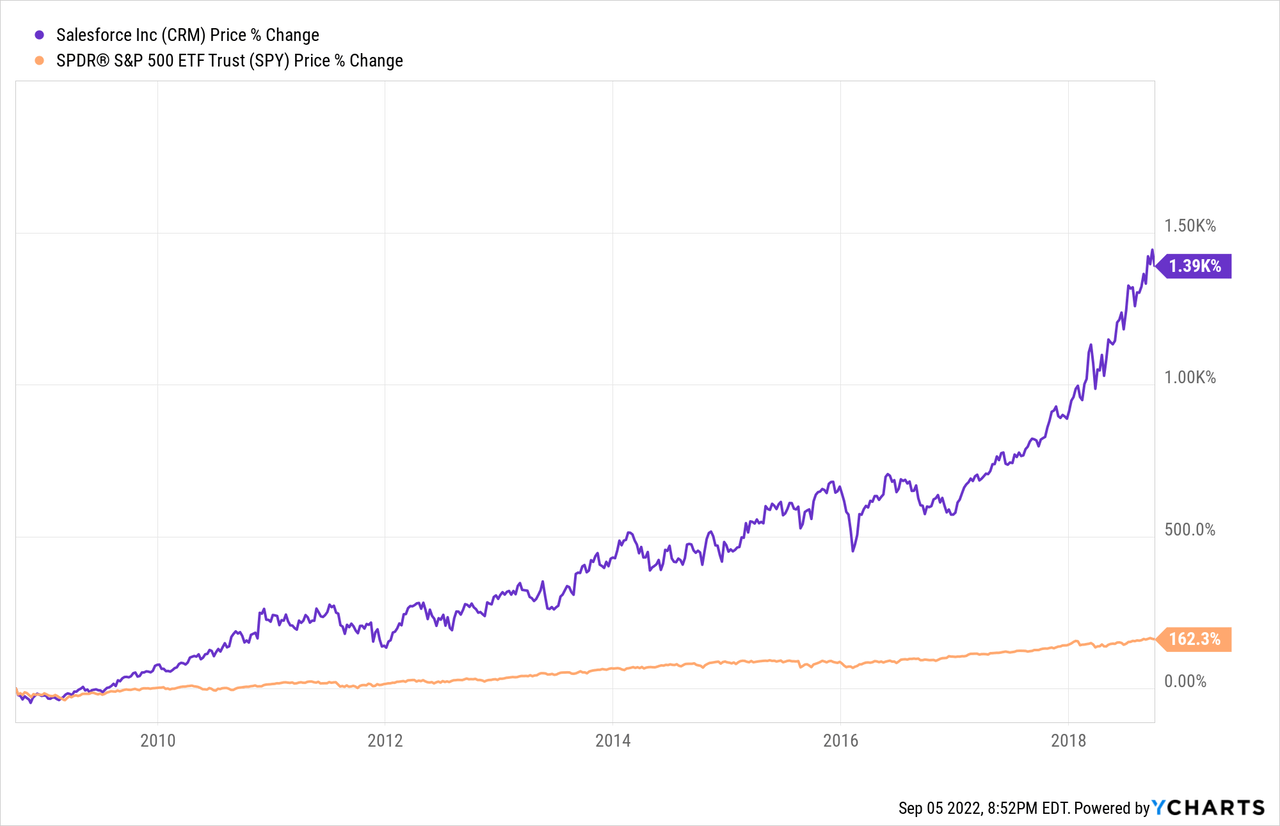
Second, since there was no way to time the bottom back then (just like today), let’s look at returns assuming we bought the S&P and CRM in October 2008, when the sell-off was comparable to what we are seeing today.
So what happened in the following 10 years?
- The S&P 500 rebounded and rose 162% from October 2008 to 2018.
- Meanwhile, CRM turned out to be a 15-bagger (up 15X).
I know, I know. I’m cherry picking. Not all stocks ended up performing like CRM. Far from it. And many stocks currently down 50% or more from their previous high will never recover.
My point is that we shouldn’t judge stocks based on how far they have fallen from their previous high as a reason to ditch them, even if they may have more to fall in the near term.
Investors who continued to accumulate shares of great businesses while the world was collapsing at the end of 2008 did very well in the following decade, even when there was further pain in the near term.
Bottom Line
The near-term outlook is bleak, and we are going through an uncertain time. However, what appears risky in the short term could turn out to be a fantastic opportunity in the long term.
While most investors look the other way, many great cloud businesses currently offer multi-year-low entry points for those willing to build up their position in the face of negative sentiment.
My favorite approach is to invest slowly in great businesses when they appear fairly valued, one month at a time. I borrow from Warren Buffett, who said:
“Lethargy, bordering on sloth should remain the cornerstone of an investment style.”
What about you?
- Are you cautiously buying shares of great businesses during this sell-off?
- Are you avoiding high-growth companies, given the uncertainty of the macro environment?
Let me know in the comments!
Be the first to comment