

BBuilder/iStock via Getty Images
There is a little of everything this week for readers.
First, be careful about using S&P 500 EPS information as a timing tool. Jeff Miller and I used to talk about this frequently, and this past week, I happened to catch Josh Brown on The Halftime Show (one of his CNBC appearances) and he made a good point (I thought) about using S&P 500 earnings as a timing tool. Jeff Miller and Ed Yardeni used to show their “recession” graphs and overlay S&P 500 earnings on the graph, and while there is a “coincident” relationship between economic downturns and the S&P 500 EPS results, I’ve wondered how much “forecasting ability” the forward S&P 500 estimates capture.
In my opinion, the “forward 4-quarter” S&P 500 EPS estimate is still one of the best indicators the Street has, but it’s hardly perfect.
As has been written on this blog before, the Q4, 2018 S&P 500 correction of 20% coincided almost perfectly with the weekly decline or “rate-of-change” in the forward 4-quarter S&P 500 EPS estimate. That’s one of the few times though. Despite the magnitude of the 2008 correction, the forward 4-quarter S&P 500 estimate didn’t peak until July 2008, after the market had topped in October 2007 right at its March 2000 high.
The other complicating factor is that of the March 2009 low, for the first half of the 2010-2019 decade, the S&P 500 forward estimate would weaken for a few months, and then strengthen again to new highs as the quarter gets reported. Without getting too technical, there is a particular earnings pattern that seems to repeat itself in good markets, but it requires a longer explanation than today’s post allows.
S&P 500 data: (all data sourced from IBES data by Refinitiv’s This Week in Earnings and Earnings Scorecard. All spreadsheets and tables are my own.)
- The forward 4-quarter estimate this week is $227.46 vs last week’s $227.28. The maddening aspect about this is that with roll into the April ’22 quarter, the forward estimate should be somewhere between $230 and $233 or the typical “bump” as we move into the new quarter, but IBES IBES data won’t publish the quarterly bottom-up estimates for 2023 until the first full week of April (and they do this every year), so the forward estimate – which is now Q2 ’22 to Q1 ’23 – is missing the Q1 ’23 quarterly estimate. Hence, I’ll estimate it for readers and say that by next Friday, April 8, the forward estimate will probably read between $230 and $233, maybe even a little higher.
- The P/E ratio is 19.99x, but if the $233 forward estimate was used, it would be about 19.5x.
- The S&P 500 earnings yield is 5% even, just like last week.
- If the $233 forward estimate were used, the earnings yield would be 5.15%.
Expected S&P 500 Quarterly Growth Rates for 2022 and 2023:
Author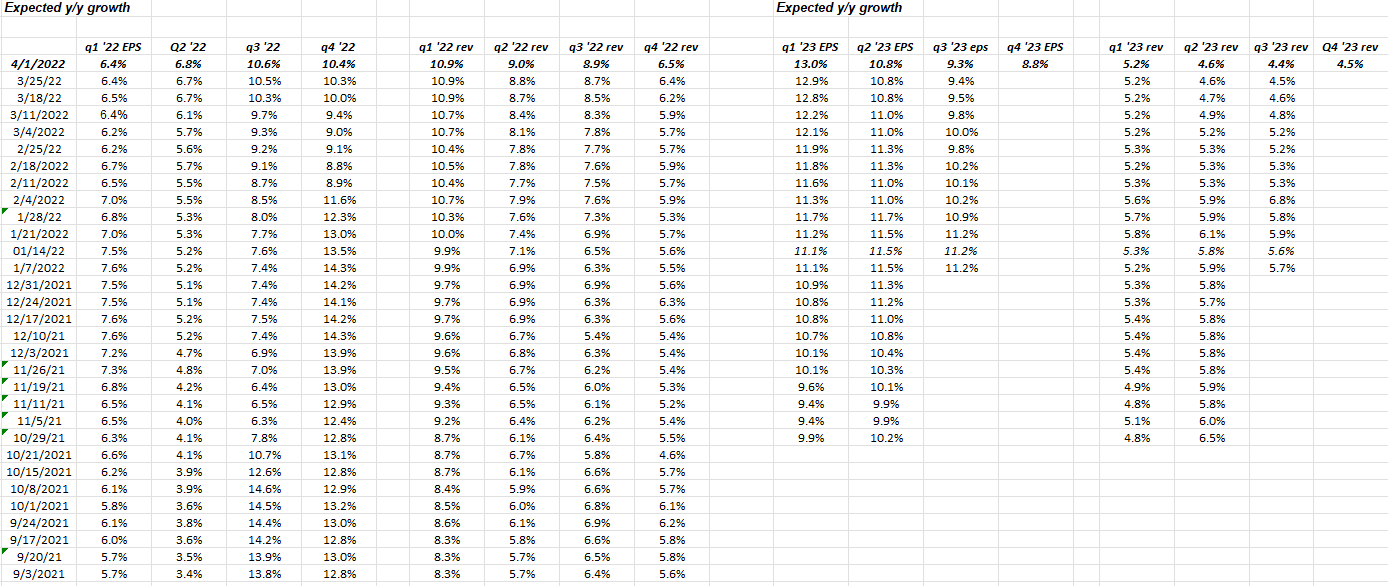
This is one of my favorite spreadsheets: note how 2022 expected revenue growth by quarter is seeing higher revisions since late in ’21, but EPS growth for the overall S&P 500 is still not being taken higher. Analyst reluctance or red flag? I’d be more worried if revenue were declining.
It’s one opinion but I do think Q1 ’22 earnings and revenue will be fine and we should see positive revisions to Q2 ’22.
S&P 500 average, annual return:
Author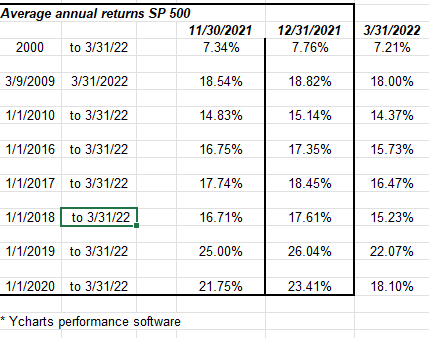
Just because it’s a small table, don’t underestimate its importance.
A flat year for the S&P 500 would work wonders in terms of taking some of the froth from the 100% gain in the S&P 500 from March 2020, to March 2022.
The summer of 2020 felt a little like 1999, early 2000, but then Tech peaked on September 1, ’20, and there was a lot of damage done in the Russell 1000 growth names after March ’21. Gaming, online gambling, cannabis, and SPACs, all had a tough time after late 2020. The indices actually held up fairly well in 2021.
S&P 500 Top 10 Market Cap Weights (as of 3/31/22):
- Apple (AAPL): 7% market cap weight, returned -.154% in Q1 ’22;
- Microsoft (MSFT): 6% market cap weight, returned -8.19% in Q1 ’22;
- Amazon (AMZN): 3.8% market cap weight, returned -2.23% in Q1 ’22;
- Tesla (TSLA): 2.36% market cap weight, returned +1.97% in Q1 ’22;
- Alphabet (GOOG) (GOOGL): 4.5% market cap weight, returned -3.99% in Q1 ’22;
- Nvidia (NVDA): 1.82% market cap weight, returned -7.21% in Q1 ’22;
- Berkshire (B) (BRK.B): 1.7% market cap weight, returned +18% in Q1 ’22
- Facebook (FB): 1.33% market cap weight, returned 33.89% in Q1 ’22;
- United Health: 1.25% market cap weight, returned +1.85% in Q1 ’22;
(Return data from Morningstar)
- The S&P 500 returned -4.62% in Q1 ’22 and the QQQ returned -8.94% in Q1 ’22.
- Apple and Microsoft still comprise 13% of the S&P 500’s total market cap as of 3/31/22.
- Only Tesla, Berkshire, and United Healthcare had a positive return in Q1 ’22.
Summary/conclusion: Tesla reported their Q1 ’22 deliveries either after the bell on Friday, April 1 or over the weekend, and the preliminary indication is that the 310, 000 deliveries were a “slight miss” from the 312,000 estimates although, in this market, that may not matter. Tesla continues to deliver (so to speak) and the spike in gas prices over the last 90 days had to help the fundamental story around owning the car, but supply chain issues still seem to be circulating around the edges of Tesla and the closing of one of their China plants thanks to a new Covid outbreak is supposedly a negative.
The only reason Tesla is mentioned is that it’s a major market cap weight (along with Amazon) in the consumer discretionary sector.
Housing and autos you’d think would have to start seeing some pullback from higher interest rates and higher gas prices. GM (GM) reported a y.y decline of 20% in auto sales mainly due to supply chain issues on Friday, April 1. GM finished the day down 1.75% to $42.96 but volume wasn’t even average.
S&P 500 earnings start the week of April 11th, and – while there could be some earnings weakness (there always is), I still think the Fed, Jay Powell, and the prospects for 50 basis point tightening in May and quantitative tightening in May / June, will be a bigger market disruption than earnings. So far, the weekly earnings data and revisions look ok. Analysts typically update their models monthly, so we’ve had two months of Ukraine, two months of much higher oil prices, 2 weeks of a higher fed funds rate, and negative pre-announcements have been quiet. Some think that starting April 4, 2022, the negative news will start to rollout and we’ll hear S&P 500 companies guiding lower on earnings, but even as retail bullish sentiment has risen sharply since early March, institutional investors are still quite tempered.
We’ll know more this week and next in terms of negative pre-announcements. We could see more negative pre-announcements than we have in the last 8- 12 quarters, but watch how the stocks trade following the preannouncement.
I do think the second quarter will be another rocky quarter, not from S&P 500 earnings issues, but likely from the monetary policy.
Take all this with substantial skepticism and a grain of salt. The worries for 2022 were the long outperformance of growth coming into the year, and the “average, annual” return of the S&P 500 as of 12/31/21. (See above table.) The S&P 500 needs a year where it’s flat to +10% and the “megacap” outperformance subsides. This could all be wrong too, but the 100% gain in the S&P 500 from late March ’20 to late March ’22 is too much, too fast.
Thanks for reading.
Editor’s Note: The summary bullets for this article were chosen by Seeking Alpha editors.
Be the first to comment