

onurdongel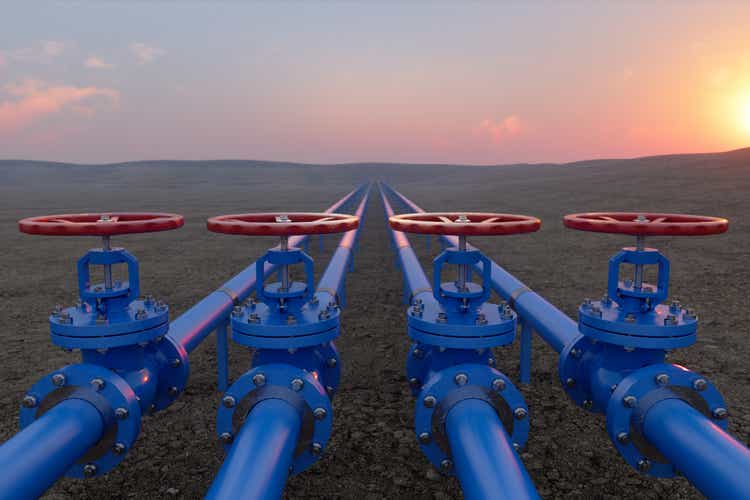
Russia announced indefinite suspension of gas flows to Europe through the Nordstream 1 pipeline, perhaps as a response to the potential oil price cap proposed by G7 or maybe the Europeans seemed like they were going to stockpile enough gas for winter. Given that natural gas prices are already at stratospheric levels, now might be the time to take a step back, take in the big picture and see how to best position oneself for the future. This article will cover both the sector specific implications as well as potential macro implications for consideration.
Units of measurement:
For the reader to compare more easily with whichever unit he is using
1 cubic meter (‘CM’) = 35.31 cubic feet (‘CF’)
1000 cubic feet = 1.036 million Btu or MMBtu (which is the unit traded on the US exchanges for natural gas)
1 ton = 1470 cubic meters
M=million, b= billion, t=trillion
(I won’t use mm for million and m for thousand, unless in the context of MMBtu per convention) because that’s just confusing)
To set a baseline: Russia annual exports to EU of natural gas in 2021 = 6.55 tcf a year (roughly equal to 1854 bcm or 126 million tons).
Natural gas exports from Russia 2021 (EIA)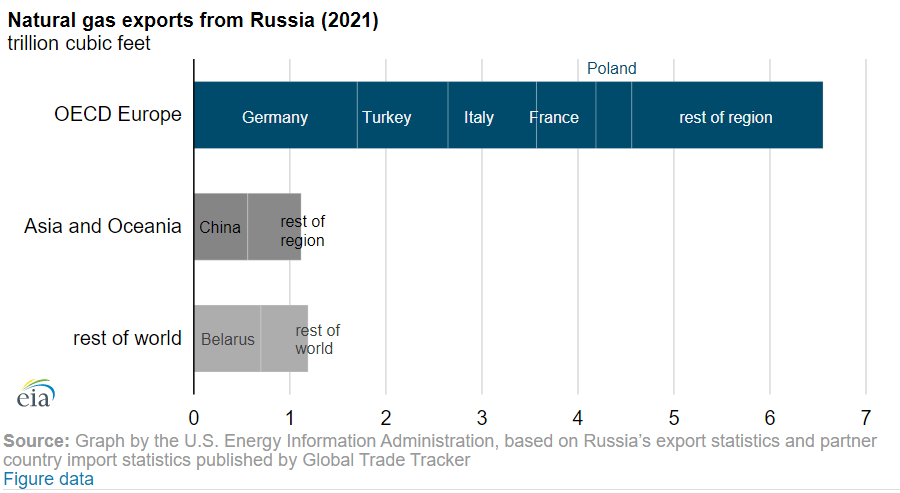
Part I: How long will the natural gas crisis endure: (and why Europe does have alternatives)
The main highlight from this section is that, the natural gas crisis will probably be enduring (the market has priced that in already) but also there are sufficient alternative sources to tap into if push comes to shove, and this will have implications for which natural gas opportunities to invest in.
That the current natural gas crisis will be enduring for a year or two or three is probably quite priced in by the market (see European 2025 winter natural gas futures) and has been written many times before. Suffice it to say, it’s hard to see any of the players (US, Europe, Russia) backing down in their current tit-for-tat retaliations as there appears to be a lack of common ground for compromise.
But this doesn’t mean Europe is entirely out of options: the below chart shows the electricity production by source for the EU:
- The total amount of electricity produced using natural gas in the EU is roughly equivalent to the natural gas imported from Russia. Obviously not all natural gas imported from Russia would be used for electricity. But it is easier to visualize – in order for the EU to cut its Russian gas imports to 0, it would be equal to cutting all of its gas generation of electricity to 0.
- There’s a lot of numbers so in short, the reduction in coal (350GW) and nuclear (120GW) power generation in the past 10 years is roughly equivalent to 80% amount of natural gas (586GW) power generated.
Electricity generation by source (Eurostat)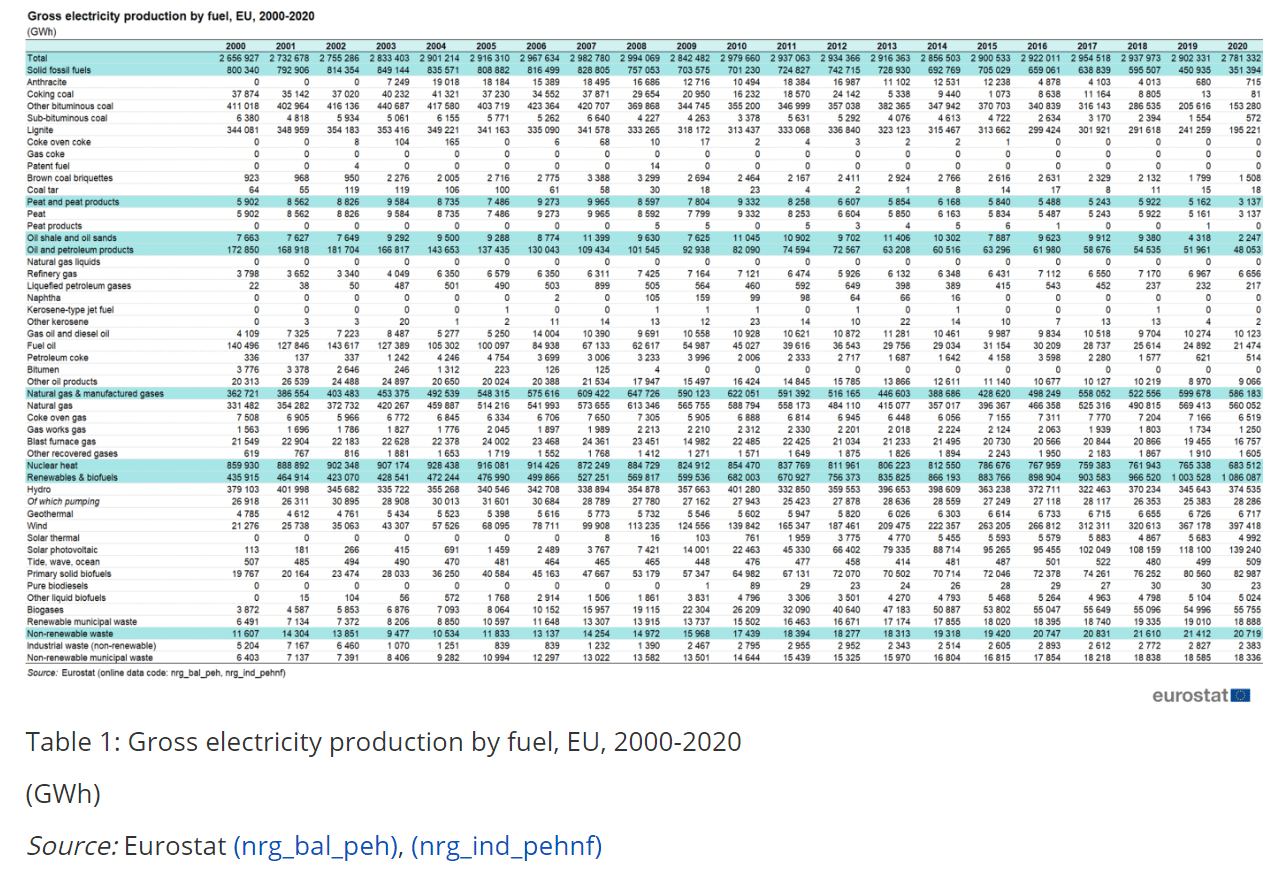
- This implies if Europe wanted to, even temporarily for a few years, to restart its coal and nuclear power generation, then this would put a cap on the length and depth of the crisis:
- Right now there appears to be a lack of political will to go full speed with coal/nuclear, but Germany is already re-starting more “traditional” power plants.
- Case in point, UK household energy price cap was GBP 1200 in 2020, it is was recently hiked to GBP 3549 and is forecast to increase to GBP 6000 by next January (which would be a 5-fold increase compared to 2020). For the average household, if energy costs a few hundred dollars/euros extra, they might just live with it, but electricity bills are now costing thousands extra per capita. At these ruinous prices, even the most ardent green energy supporter might think twice and the average voter will lean towards cheaper energy however.
- With last resort alternatives in hand, Europe is unlikely to agree to super high long term prices to secure LNG, but might agree to a small premium for long term prices to reflect the urgency and incentivize construction.
What does this mean for appraisal of natural gas investment opportunities?
Part II: Natural gas related sector opportunities
Natural gas prices have been rising for over a year and the war in Ukraine has gone on for over half a year. So analysis of any opportunities needs to have a margin of safety in mind, i.e. what happens if margins for players in those industries revert to a more normal level in a year or two or three? It’s hard to believe that LNG production and terminals will generate huge margins forever (and it probably won’t), in fact the concern over LNG in most of the past decade has been “supply glut”.
The value chain of natural gas can be divided into upstream (exploration), midstream (pipelines and LNG), downstream (distribution via utilities etc). Of these value chain segments, only a few chains in the link have the potential to be enormously profitable, and over the long run (and this might come sooner than expected), I think only the upstream section in the US currently offers undervalued potential.
Why do I make this assessment? I see several risks when it comes to the natural gas and LNG market that are often not mentioned or addressed:
First is the issue of substitution.
- The Russian gas that is no longer exported to Europe won’t melt into thin air. It generated $50-60 billion a year pre-war for Russia. It’s probably likely that at least part of that will be sold to other countries like China, Pakistan, India (which are all importing copious amounts of LNG, including from the US). Even if the infrastructure is not there right now, it will be in a few years. So US increased export volumes to Europe may be met with a decrease in export volumes elsewhere. Overall it will probably still end up in a net export increase.
- Also, supply to developing countries has been diverted to the more lucrative European market. With no gas to buy and not being able to afford any that they could buy, these developing nations would probably switch to alternatives such as coal and gas, at least until the LNG market comes back to normal. As shown below, US LNG exports to Europe in first half of 2022 have surged compared to first half 2021, but this has come at the expense of India and Pakistan etc. It seems they are likely to make up the energy shortfall with oil or coal etc.
US shifts LNG exports to Europe (Reuters)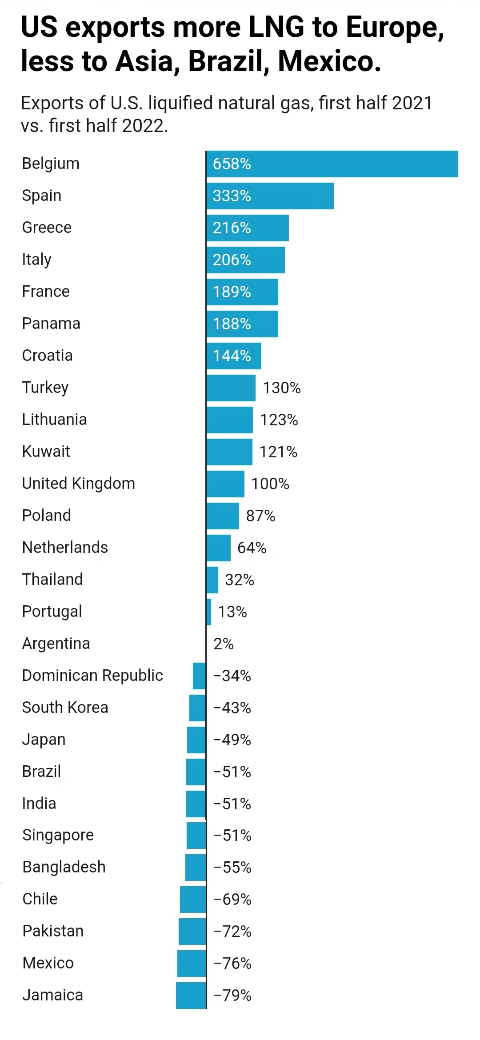
Source: Reuters
- Furthermore, these are not small amounts – total 2021 exports to Brazil and Chile (428 bcf) were close to those of the largest customers (South Korea and China), while India and Pakistan were a total of c.240 bcf. If volumes for the full year 2022 for these four countries are 50% lower than 2021, this would be 350 bcf (50% of roughly 700bcf), which is about 5% of the gas supplied to Europe by Russia.
Second, there is the issue of additional supply:
Qatar and Australia both currently export more LNG than the US, and Qatar is expecting large capacity increases.
Qatar Annual LNG exports
|
2022 |
2025 |
2027 |
|
|
Million tons |
77 |
110 |
126 |
|
Tcf |
4.0 |
5.7 |
6.5 |
Source: Public info
The US will also add additional supply:
US Annual LNG export capacity (nameplate, baseload)
|
Current |
Total By 2025 |
Other approved but not begun construction |
|
|
Bcf/day |
10.78 |
15 |
6.1 |
|
Tcf annually |
3.9 |
5.5 |
2.2 |
|
Million tons annually |
81.8 |
114.4 |
46 |
Source: EIA
Russia is also building Arctic LNG 2 which is forecast to increase to 20 million ton per year (1 tcf annual) capacity by 2025.
Assuming all approved (but not begun construction) and under construction projects are completed, US will add 3.7 tcf annual capacity, Qatar will add 2.5 tcf annual capacity and Russia will add 1 tcf, which is 7.2 tcf combined, which exceeds the total gas Russia exported to Europe in 2021 (6.55 tcf). Given the sky high prices, construction may be quickened.
Third, LNG historically has not been particularly profitable, the export price for US LNG exports has been between low single digits for most of the past 30 years except a small period of imbalance in 2011-2014 which promptly ended up in a glut post the shale oil boom.
US LNG export prices (EIA)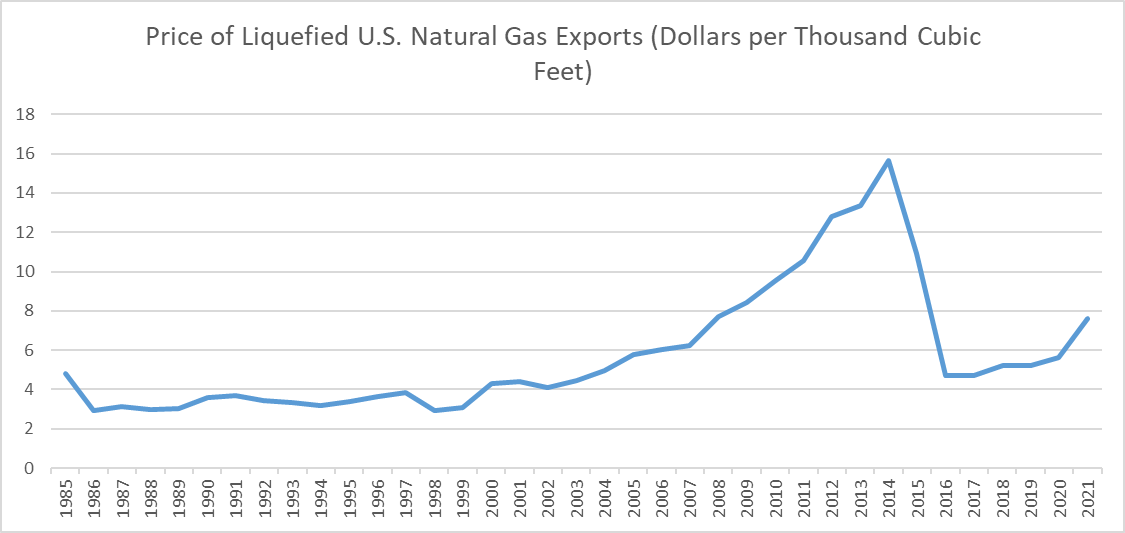
The cost benefit analysis usually looks something like this with a 10% or 15% discount rate used by producers.
Cost profile of LNG (WoodMackenzie)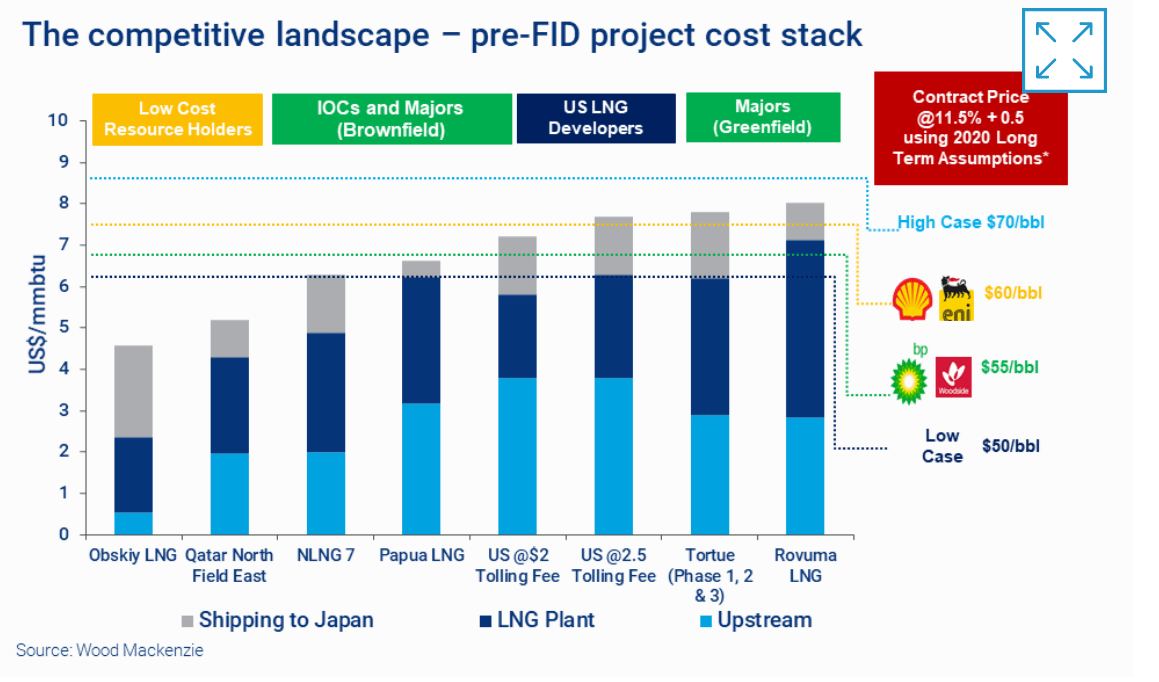
In a nutshell, LNG exporters have not been extremely profitable in the past and are only immensely profitable right now due to capacity bottlenecks. Given the expanding capacity and the historical tendency towards expanding capacity until it is barely profitable, the industry at its current status probably will not generate exceedingly high returns.
So the above is really the case against the midstream:
- while those that have LNG and those that can make LNG will make a bundle this year, next year and maybe the year after that, in just a few years, their profitability will come back to earth, so if they can’t make their market cap back in 2-3 years and then be worth a 10% perpetual return, then even though I would not bet against them, they likely don’t have a margin of safety.
- For example, Cheniere Energy (LNG) has a $40.5 bn market cap (EV of $70 bn due to the large debt) now, it has 45 million ton per year (2.25 tcf) LNG production capacity and had a great H1-2022 ($4 billion in free cash flow (using operating minus investing cash flow as a proxy here), which is more than double that of full year 2021). However earnings have been spotty over the past few years and kudos to them for sticking to invest in this sector through thick and thin, while I would not want to bet against them, I don’t see a margin of safety in there. Even if you see 3 more years of $8bn of free cash flow a year and $2bn a year henceforth, it would still not provide too much of a margin of safety against the $70 bn EV.
Upstream is where the value isn’t fully appreciated yet
What all this LNG exporting does, is massively reduce the glut in US natural gas supply. Natural gas, like real estate, is very regional. It’s easier to ship around oil barrels compared to natural gas, which means Russia could end up with a glut they are having trouble disposing of, while the US could finally get rid of its supply glut.
US natural gas supply demand (EIA)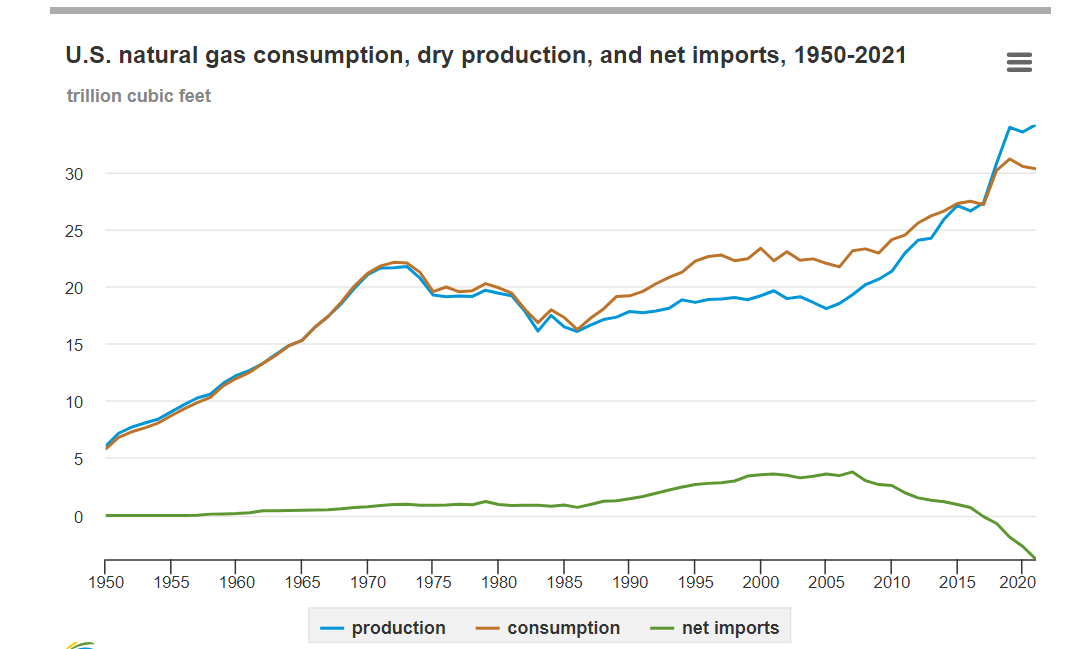
After the shale oil boom, natural gas production increased from ~20 tcf annually to around 33 tcf, which turned the US into a net exporter (previously it was a net importer). Demand of this very cheap fuel has increased (mainly in electricity production) but has stagnated since 2018 at around 30-31 tcf a year. As some readers have pointed out, the COVID-19 pandemic only saw a 2% decline in US natural gas usage in 2020 which illustrates how critical a fuel it is and how stable the demand is, compared to oil and other commodities.
US use of natural gas by sector
| Amounts in tcf | residential | commercial | industrial | electric power | transportation | Total |
| 2010 | 4.78 | 3.1 | 8.11 | 7.39 | 0.7 | 24.08 |
| 2011 | 4.71 | 3.16 | 8.32 | 7.57 | 0.72 | 24.48 |
| 2012 | 4.15 | 2.89 | 8.62 | 9.11 | 0.76 | 25.53 |
| 2013 | 4.9 | 3.3 | 8.91 | 8.19 | 0.86 | 26.16 |
| 2014 | 5.09 | 3.47 | 9.16 | 8.15 | 0.74 | 26.61 |
| 2015 | 4.61 | 3.2 | 9.1 | 9.61 | 0.72 | 27.24 |
| 2016 | 4.35 | 3.11 | 9.27 | 9.99 | 0.73 | 27.45 |
| 2017 | 4.41 | 3.16 | 9.53 | 9.27 | 0.77 | 27.14 |
| 2018 | 5 | 3.51 | 10.11 | 10.59 | 0.93 | 30.14 |
| 2019 | 5.02 | 3.51 | 10.24 | 11.29 | 1.07 | 31.13 |
| 2020 | 4.67 | 3.17 | 9.96 | 11.62 | 1.06 | 30.48 |
| 2021 | 4.65 | 3.26 | 10.04 | 11.27 | 1.05 | 30.27 |
Source: EIA
- The demand factor: Current LNG export facilities enable the US to export its surplus natural gas. Given that Europe requires 6.5 tcf annually of natural gas to make up for the loss of Russian supply, even if just 30% or 50% comes from the US (which seems likely given that US is expanding LNG facilities and the Europeans probably want to diversify their supply rather than rely on another source that is not their steadfast ally), then that’s 2-3 tcf of extra demand which may keep natural gas prices in the US at higher but still relatively cheap levels.
- The supply factor: given gas is largely a byproduct of oil and oil production is not expected to pick up, I don’t see large gas supply increases on the horizon.
- Given the above, prices in the mid to high single-digits does not appear to be too outlandish, given they were about $2-4/MMBtu during the shale boom, $5 or $6/MMBtu now that supply has flattened out and demand is increasing does not seem outlandish.
Gas spot price (EIA)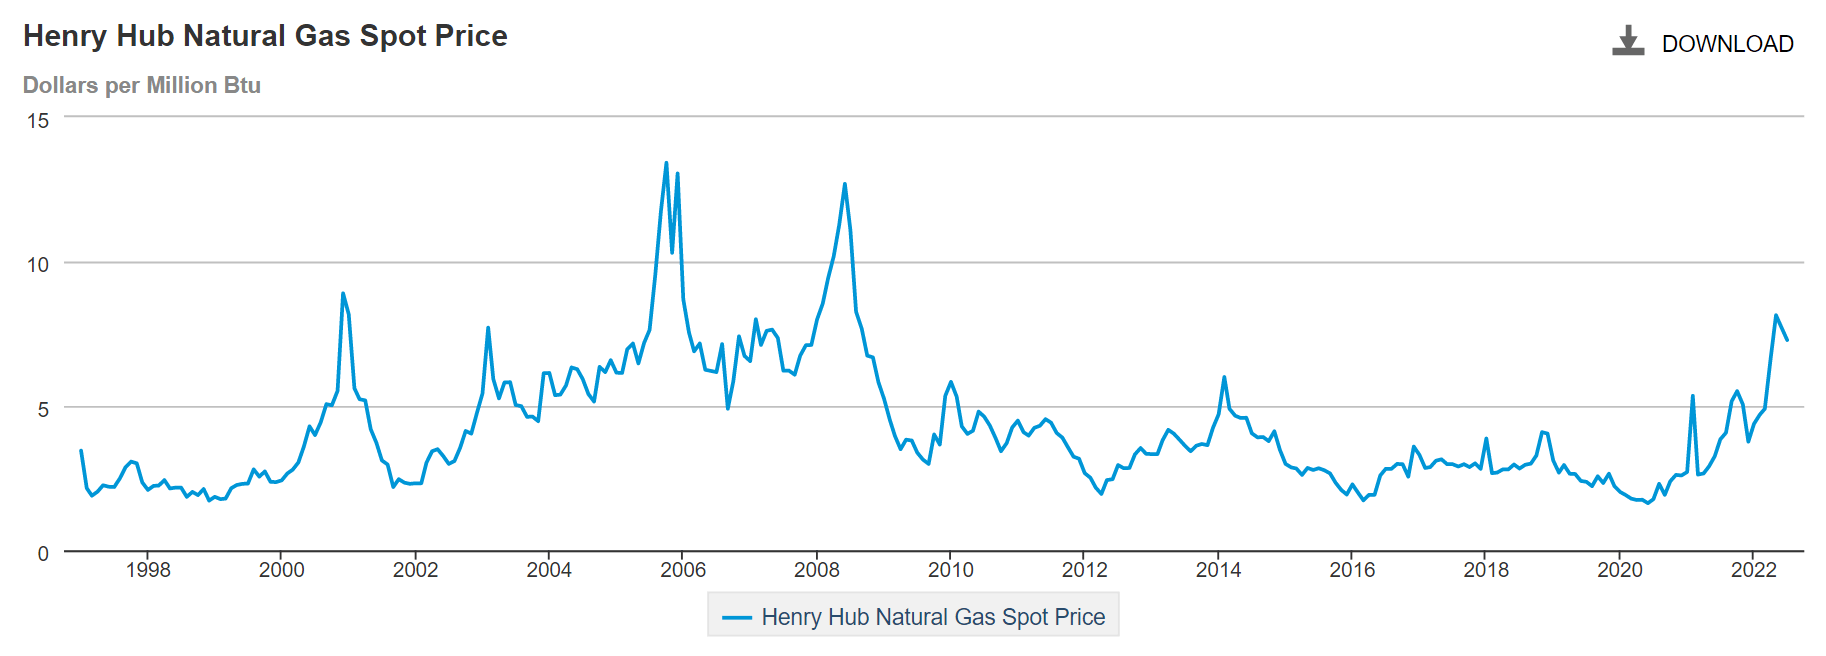
Most natural gas is produced by oil producers and related revenues are a small portion of total revenues (for example, for Buffett’s favorite oil stock Occidental Petroleum (OXY), natural gas comprised roughly 10% of 2021 total sales. For giants like Exxon Mobil (XOM), this is at similar levels too). Revenues from gas is almost an afterthought, a byproduct of the far more profitable oil production, so if you want more exposure to natural gas, then it’s pure play US (and maybe Canada) natural gas upstream producers, Canadian stocks are also interesting given that Canada exports directly into the US market, so if US spot prices increase, the marginal Canadian price should benefit as well (eventually).
Natural gas producers have been accustomed to low prices in the US, using EQT as an example, which is as close as you can get to a large, almost pureplay US based natural gas supplier:
EQT realized prices:
|
Amounts in $ per MMBtu |
2021 |
2020 |
2019 |
… |
2014 |
2013 |
2012 |
|
Realized natural gas prices |
2.38 |
2.37 |
2.65 |
4.57 |
4.18 |
3.58 |
Source: EQT annual report
- EQT on average sold natural gas at $2.38/mmBTU in 2021 and its earnings in 2022 and part of 2023 have and will be lackluster due to its hedging practices.
- EQT has gotten so efficient that as another author recently pointed out, Management stated that “at $3 per mmBtu, it would generate a free cashflow of $1.6bn, if natural gas averaged $7 per mmBTU, they would generate $6bn of free cash flow.”
- It also has 23.5 tcf in natural gas reserves (at year-end 2021) compared with a production of 1.86 tcf in 2021, so 12.6 years of production in reserve.
- All this for a market cap of $17bn (EV of $22bn, give or take a few if you want to add derivative liabilities or not).
- As mentioned above, $5-$6/MMBtu long run does not seem to be outlandish (in fact, the futures market for June 2026 delivery is at $4.7/MMBtu) given the above dynamics. Clearly, this offers an opportunity with a margin of safety as supply/demand dynamics just have to work out and even if US natural gas prices are way below international levels and if Europe resolves its crisis sooner than expected (whether through more use of coal or nuclear, or doing a backdoor deal with Russia or whatever), EQT will still earn a nice return.
Part III: Macro implications and opportunities
There are going to be widespread economic implications from the turbulence in gas prices on the wider economy.
Just a simple example, electricity:
- electricity prices in Germany briefly jumped above 1,000 euros per megawatt hour on August 29 2022.
- Total net electricity generation was around 2664 TwH in 2020 in the EU, 1,000 euros per megawatt hour is equal to $2.6 trillion for electricity alone this year (on a run-rate basis)
- Electricity prices have since fallen by half, which still implies $1.3 trillion for electricity on a run-rate, given the 10 fold increase in prices (compared to the good old days), this means the EU pays $1 trillion more for electricity alone, compared to an annual GDP of about $17 trillion in 2021 (which has further shrunk with the Euro’s fall). And this would just be electricity alone – given that 30-40% of gas is used as a fuel for industrial production, pricier and lower absolute volumes of natural gas would have secondary impacts on production and eventually GDP.
- This should be caveated that many of these prices are “marginal” prices based off thinly traded futures, so the actual impact might be a bit smaller than these headline figures suggest.
- However, the actual impact is still likely a multifold increase in energy bills for consumers and probably even more for corporates. As mentioned above, UK household energy price cap was GBP 1200 in 2020, it is was recently hiked to GBP 3549 and is forecast to increase to GBP 6000 by next January, which is a 5-fold increase compared to 2020.
- Given the general European malaise since 2008 (comparing European debt to GDP levels with the US, you can see that European debt to GDP barely changed while the US had a more thorough deleveraging), this is quite damaging as (i) energy prices are higher, “siphoning away” disposable income and (ii) incomes are lower due to lower production and consumption.
- Even if EU governments try to intervene, it might reduce the bill for households and corporates but eventually will end up with higher government debt. Given the Euro’s overall malaise, the room for further monetizing debt is probably quite limited.
But other than higher energy prices being a very large burden on European consumers and producers, there will be a huge spillover impact. The main macro impact (especially for the US economy and US equities, but also relevant globally), is that inflation is likely to appear to be an “untameable” beast for the foreseeable future and this will throw a curveball at the Fed.
This is reminiscent of the 1970s in that inflation increases while supply decreases, but the Fed is still fixated in the paradigm of inflation being caused by too much demand (i.e. fighting the battle of 2021). When input prices are up 1000% because of supply decreasing by 30% and high levels of uncertainty, reducing demand by 5% will create a recession without curing the inflation problem. Unfortunately, the Fed will not likely veer away from its current trajectory until there is widespread social consensus and even then, it may take the legislative and executive branch to enact policies conducive to massively increasing supply (either traditional or renewable) for it to work out. As mentioned above, it may take until 2025 for Europe to replace most of the displaced LNG from US and Qatar so this may take months if not years to work out.
If you look at it from the Fed’s perspective, even if they foresee higher inflation and a recession, they are not going to be more dovish because:
- if they are more dovish, they will be blamed for the inflation;
- and if a recession with high inflation is coming anyway, why get the blame for it,
- especially given that so much effort has been invested in communicating the restrictive monetary policy, doing an about face now will just result in public confusion and blame. Hence it is likely the Fed will stay the course until public consensus congregates on increasing energy supply as the way forward – that could take years and a lot of politicking.
If the Fed moves rates to what FOMC members have considered neutral (3%) or somewhat restrictive (4%), keeps it there hoping for inflation to decline but inflation keeps increasing, then what are they going to do? Currently that nightmarish scenario is not discussed as the hope is that the high rates will cure inflation. If it doesn’t, market expectations may cascade into prolonged high inflation and high rates and recession which will heavily weigh on equities. But this is exactly the scenario the Bank of England foresaw (to much public ire and consternation) with high inflation and zero growth for the next two years. This may be create a “surprisingly” hawkish Fed for longer than expected periods, which will weigh on equities and bonds.
However, there is a silver lining to all of this. With prices at these nonsensical levels and even the most ardent green environmentalist not finding enough wood for the fireplace, eventually supply will increase from somewhere. It will be a tough transition period of 2-3 years but this too will pass. Remember when the 2008 financial crisis felt like forever? Turns out the following years were a great time to buy a house or many equities. After the inflation genie is put back into the bottle, the Fed may enter another secular dovish cycle to try to “heal” the economy with more money as they tried for the 14 years after 2008. The subprime crisis was driven by a surplus of only a few million extra houses which after a decade has turned into a housing shortage. In hindsight, there was no reason to panic except for everyone trying to avoid a loss in that particular year.
Other observations include:
- European stocks may face a sell-off if there are persistent widespread black-outs and production cuts. If this happens, this may be a great time to buy certain leading European companies. European giants like BASF have survived 2 world wars and a cold war, they are not going to cease to exist just because there is a shortage of energy for two or three years and there is the added bonus of a 20-30% “discount” due to the lower Euro.
- American industrials might outperform given the US has plentiful cheap energy and can sell into Europe and increase their market share while Europe shuts down. Production transfers to South East Asia may also be accelerated.
- Industrial commodities such as base metals might face reduced supply coupled with reduced demand. Europe is a big producer of zinc and aluminum etc and production cuts have driven up prices in the past few weeks but prices have receded again as recession fears outweighed production cuts. However, if European production comes to a standstill and commodities hit COVID-19 pandemic or 2008 financial crisis lows, then it would be a great time to buy.
- EV and renewables adoption might slow down as Europe focuses on fossil fuels first. This may give existing auto giants more time to catch up with Tesla (TSLA) etc. Tesla might unexpectedly end up as collateral damage from the high energy prices.
- Unfortunately, I don’t see a case for gold and silver until the next Fed easing cycle, which may be disappointing to gold and silver bulls. Silver has solar energy demand going for it but this is only a small percentage of total silver demand. Given 50% of silver demand comes from industrial related applications, in an economic downturn silver probably won’t fare too well. Gold and silver have not performed well in the past decade except when there was easy money and some catalyst (e.g. trade war) and I would not bet against the Fed.
Summary
Upstream US natural gas producers such as EQT appear to be valued with a margin of safety and perfectly perched to benefit from the increase in US exports of LNG to Europe. Midstream operators are making the most money now due to LNG capacity shortages but may be richly valued already, so less margin of safety.
Macro-wise, this is likely to create a persistently hawkish Fed until there is widespread consensus and action that increasing energy supply is the way out.
Be the first to comment