

NicoElNino
Thesis
My last article on the SPDR S&P 500 Trust ETF (NYSEARCA:SPY) was co-produced with Envision Research. That article focused on comparing SPY to the Vanguard Total Stock Market ETF (VTI). In particular, we compared SPY against VTI to show the valuation implications due to VTI’s inclusions of mid-cap and small-cap holdings. In this article, I wanted to compare SPY to the Invesco S&P 500 Equal Weight ETF (NYSEARCA:RSP) to examine another fundamental aspect of indexing: equal weight indexing vs. market-cap-based indexing.
In particular, I will compare RSP against SPY in detail to illustrate the subtleties in terms of performance, valuation metrics, and risks. You will see that the idea of equal weight indexing can be appealing when the valuations of the largest companies (such as the FAANG stocks) are elevated like during the beginning of this year. You can clearly see the benefits of holding RSP under those conditions from the chart below. Both RSP and SPY stock prices have suffered corrections YTD. However, as you can see from the following chart, RSP suffered “only” a total loss of 12.9% and outperformed SPY by more than 3%.
However, you will see next that such benefits are situation-dependent. And the thesis of this article is to argue that RSP does not make as much as it did in earlier 2022. The underlying reason is that many of the mega-caps have suffered large valuation contraction YTD and are actually selling below the market average valuation.
Seeking Alpha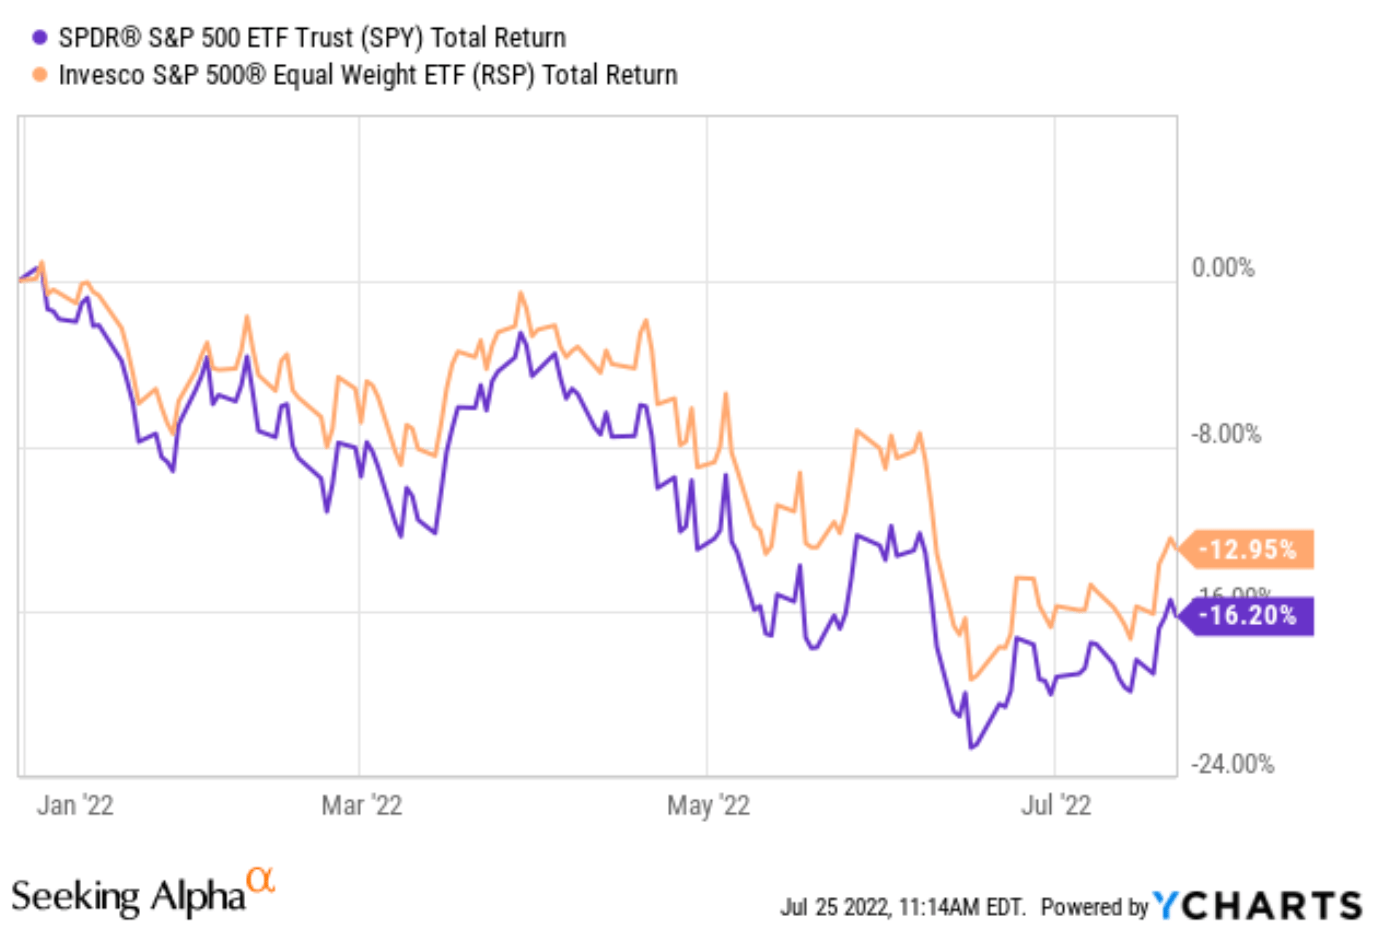
RSP and SPY: Basic information
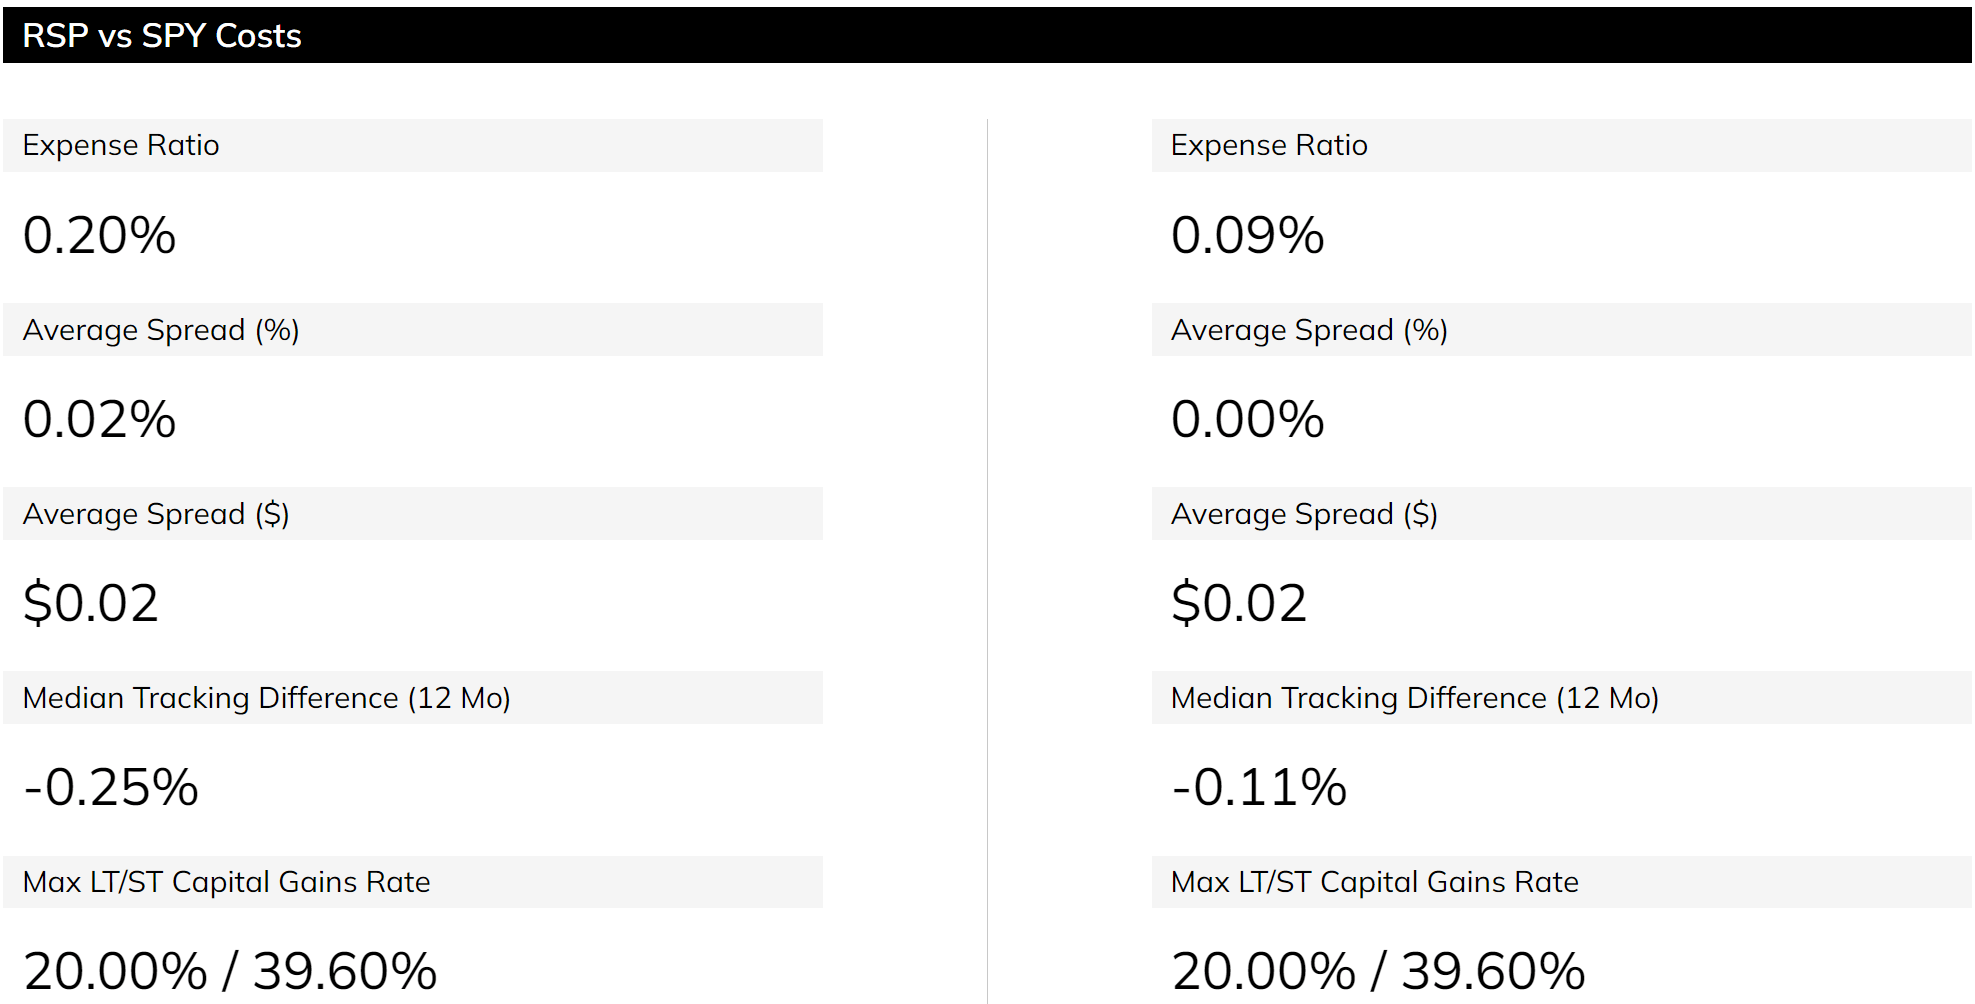
Before we dive into the details, let’s take a look at the funds themselves more closely. SPY needs little introduction, and I will just point out a few details regarding RSP. It is one of the Invesco funds with a sizable total asset of over $30B (although only about 1/10 the size of SPY). It charges a 0.2% expense ratio, higher than SPY’s 0.09% by 0.11% (and we will contextualize this difference later).
Due to the difference in their sizes, SPY offers far superior tradability and liquidity. As you can see from the following chart, SPY trades with essentially zero trading spread, while RSP trades with an average spread of 0.02%. For readers who are not active traders like myself, both funds are sufficiently liquid and the trading spread is a truly negligible issue compared with the differences in their fees.
The more fundamental differences are in their indexing method and actual holdings, as you will see next.
Source: ETF.com Source: ETF.com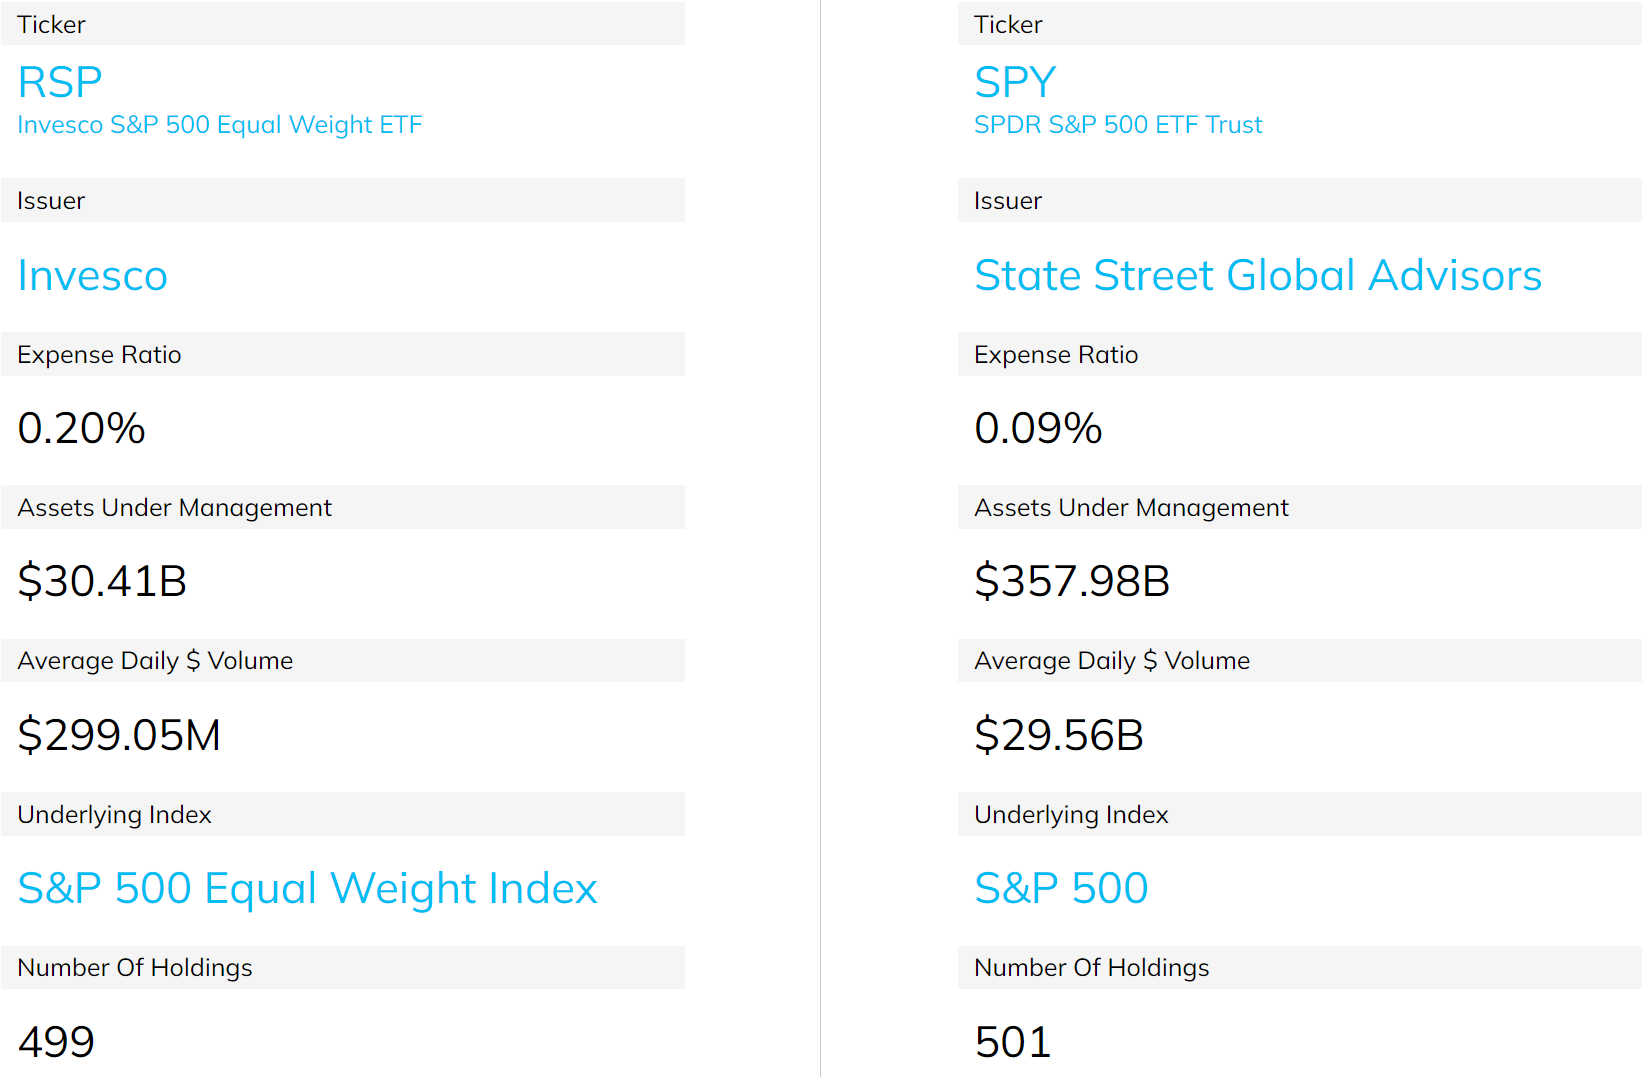
RSP vs. SPY: Indexing methods
RSP applies an equal weight indexing approach. In contrast, SPY is indexed by market capitalization. As a result, even though they hold the same ~500 stocks, their allocations are dramatically different. SPY is top-heavy and dominated by a few large companies. As can be seen from the following chart, the top 10 stocks represent more than 27% of its total assets, more than ¼. In contrast, each of RSP’s holdings on average represents about 0.2% of its total assets (1/500 = 0.2%). And you can see, its top 10 holding represents only 2.36% of its total assets (so on average 0.23% per stock).
Furthermore, you can that the current SPY indexing is heavily dominated by technology sectors such as the FAAMG stocks, and we will discuss the exposure and valuation implications below.
Source: ETF.com.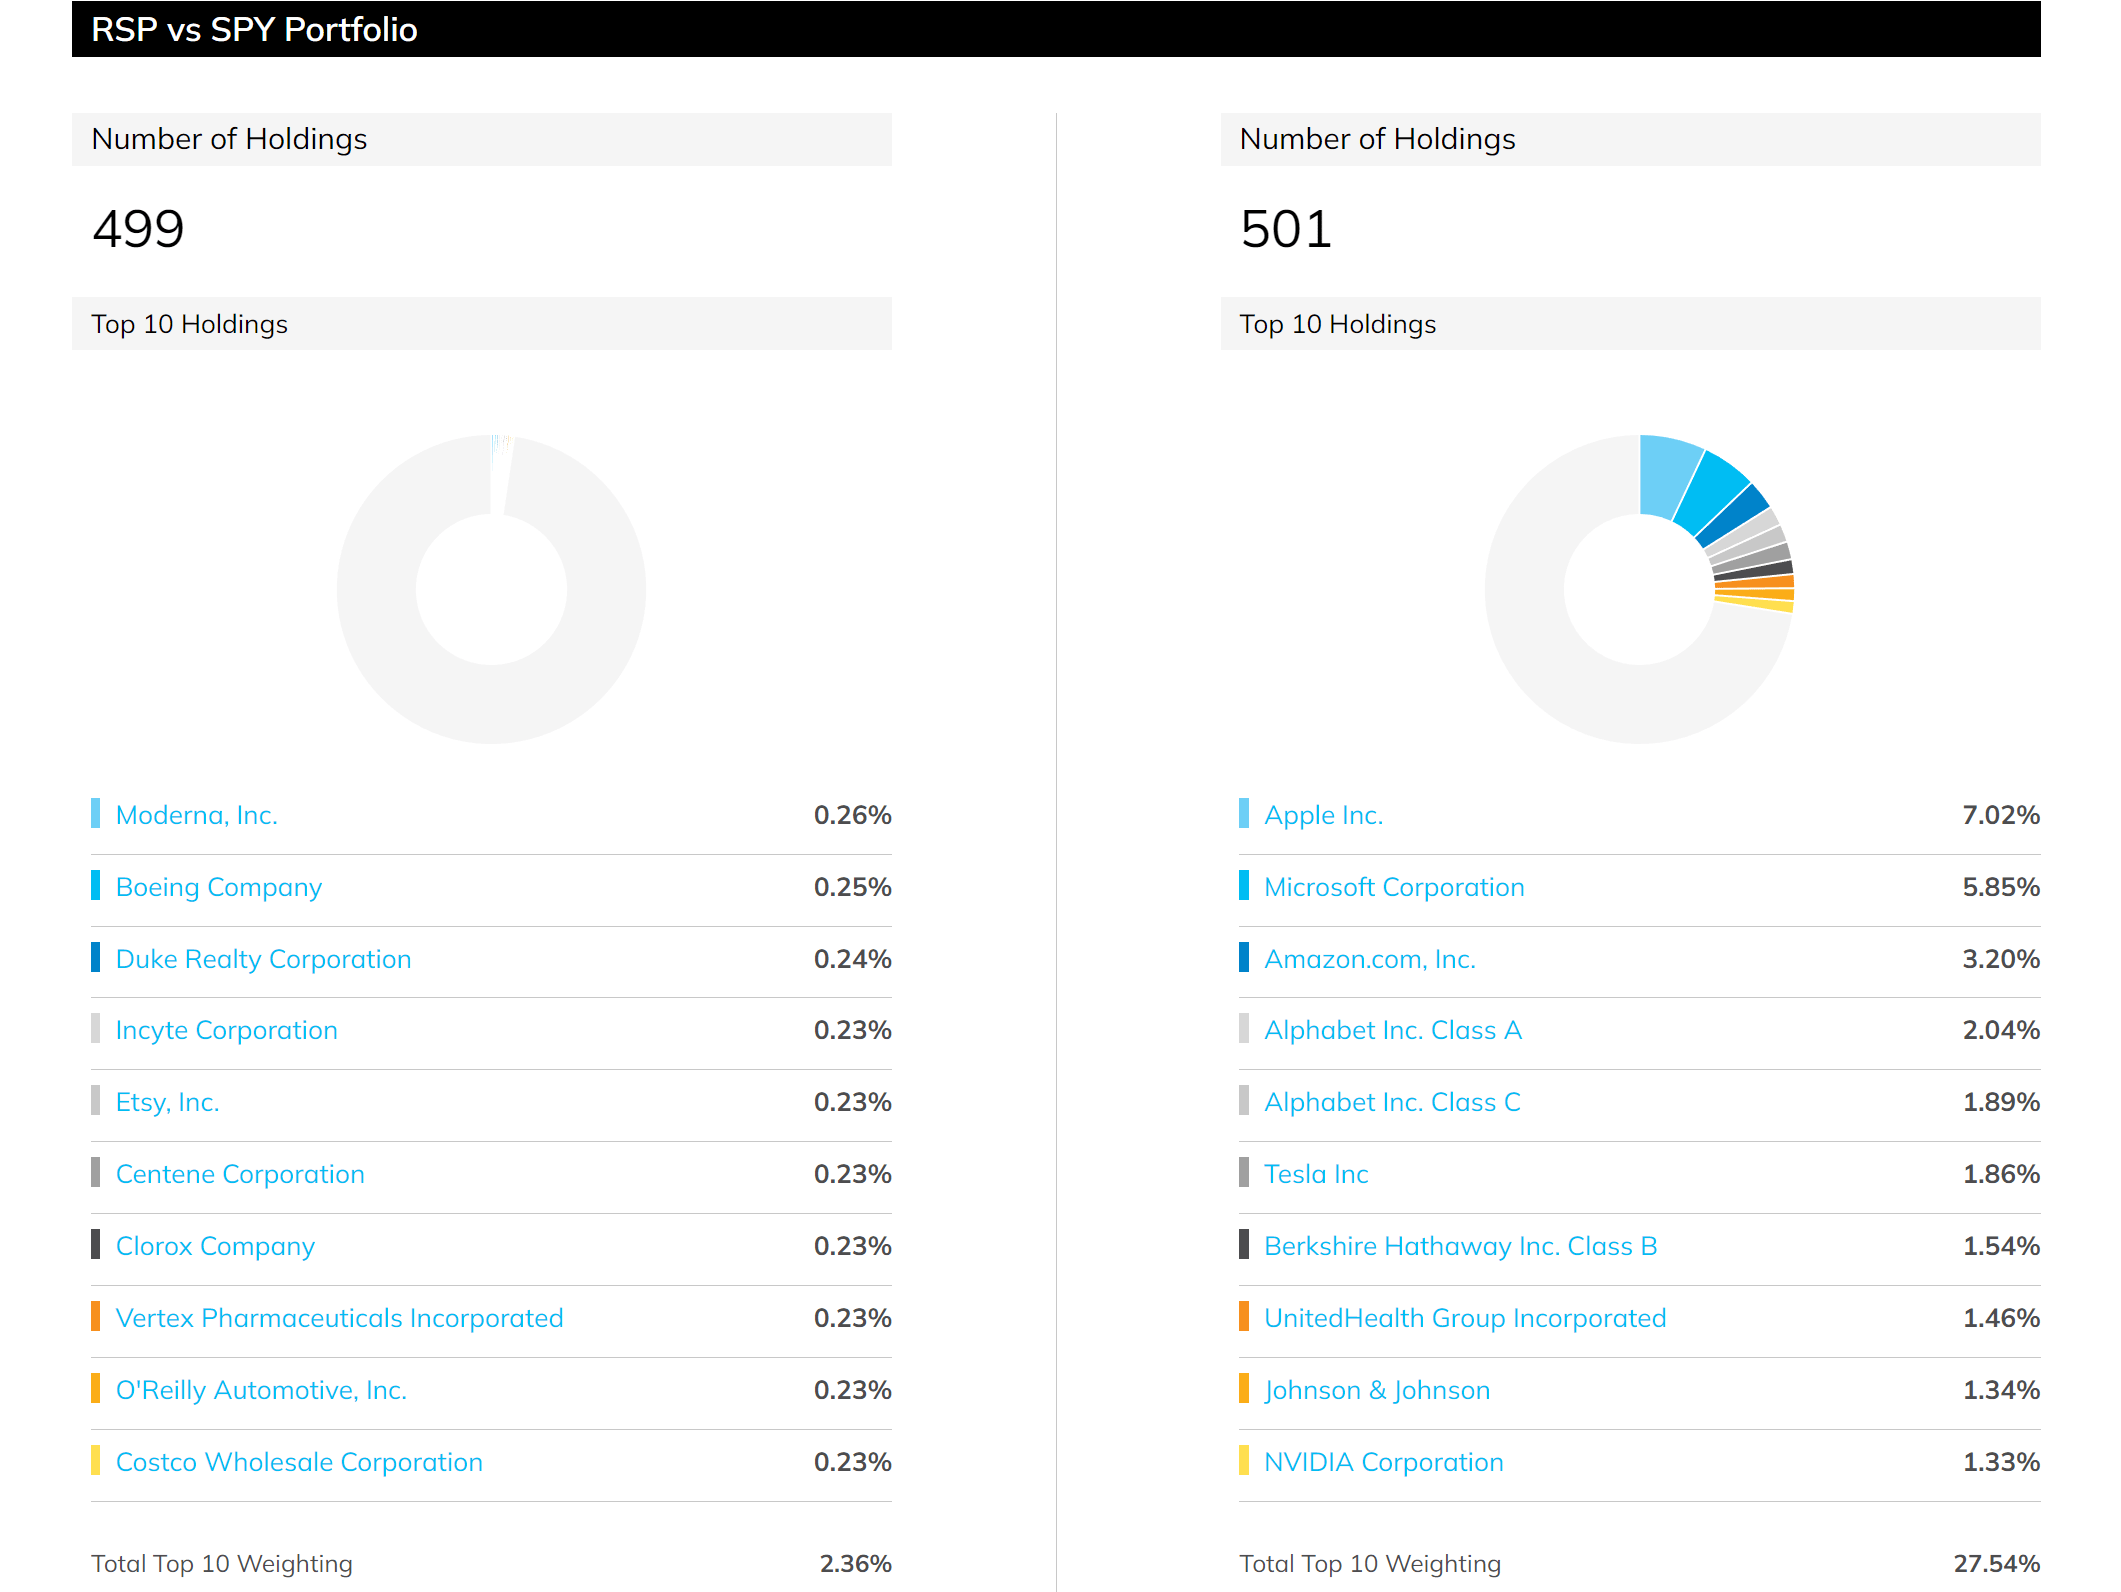
RSP vs. SPY: Valuation
As aforementioned, equal weight indexing can be an appealing idea when the largest companies in the S&P 500 index are at an elevated valuation like the beginning of 2022. Under those situations, an equal weight indexing could help you better diversify and avoid concentration risks in a few mega-caps. However, the correction YTD has been uneven, and the correction in some of the mega-caps has been more severe than the market average. As a result, many of the mega-caps are currently trading with valuation multiples below the market average.
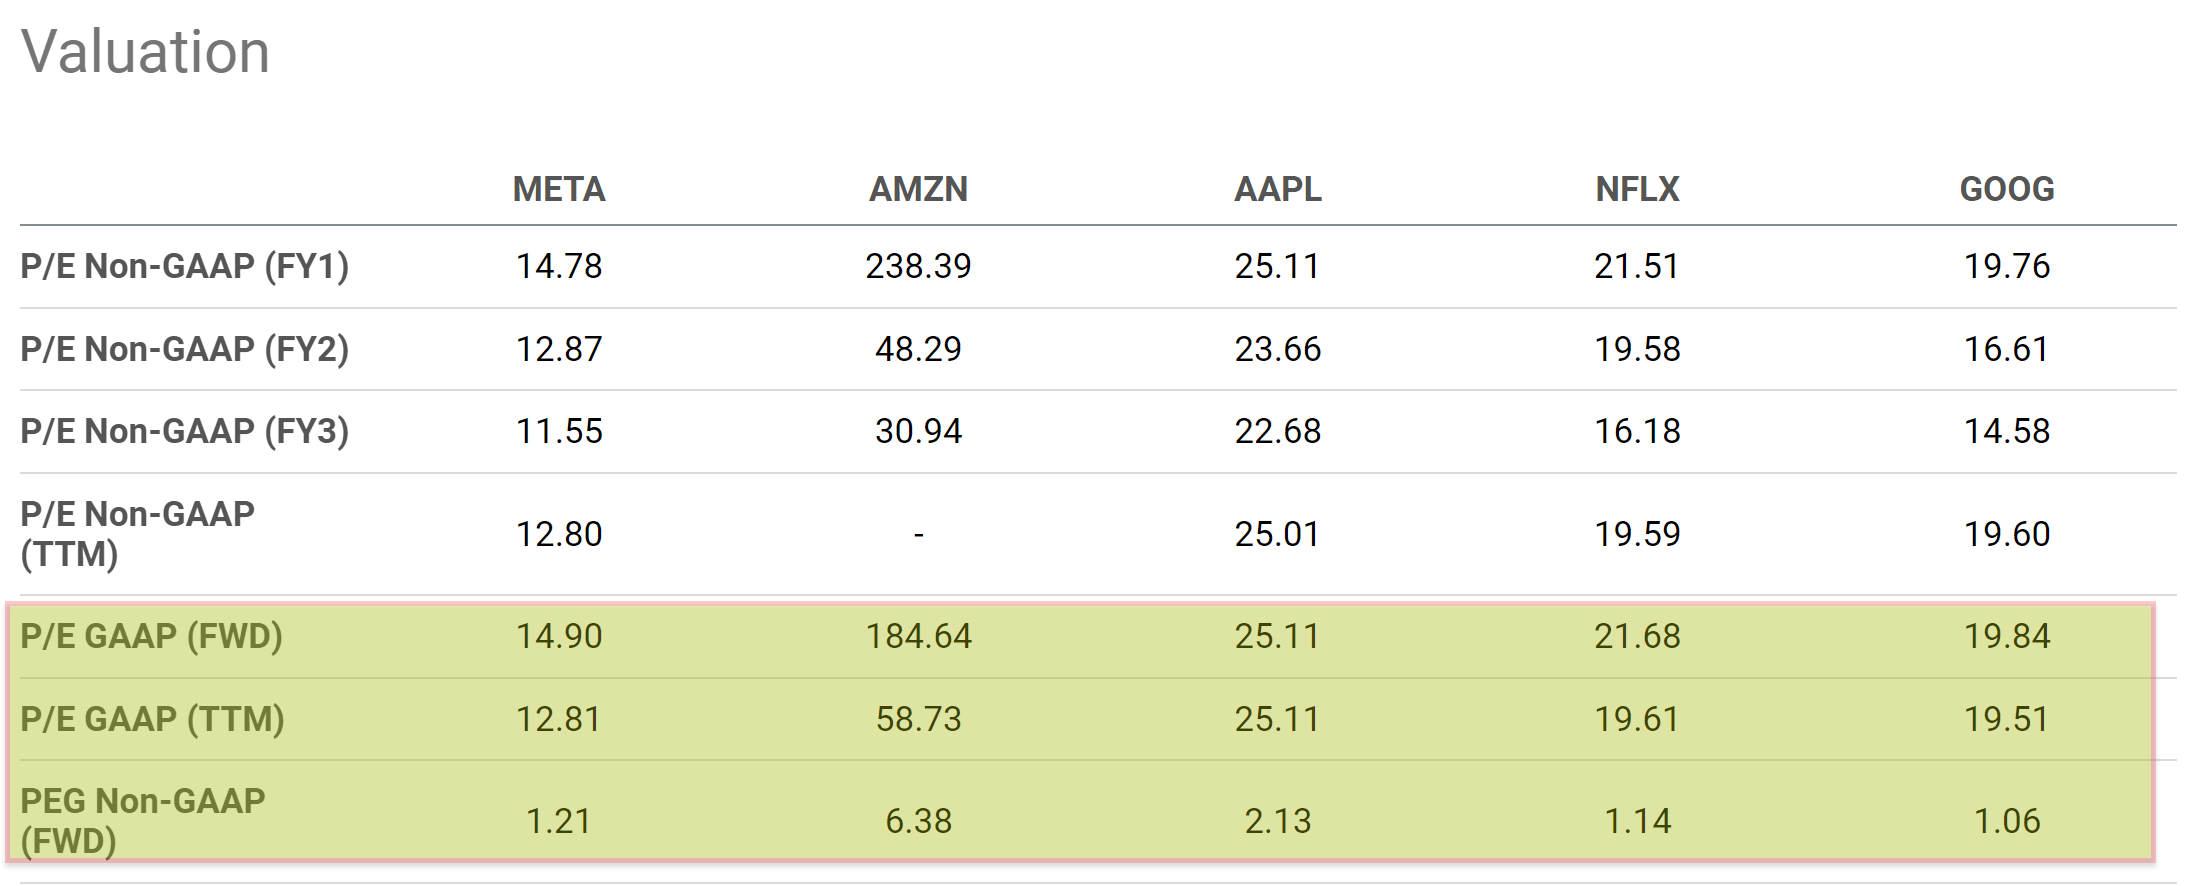
To wit, according to the following Yahoo Finance data, SPY is currently valued at ~26.45x PE and 4.4x book value as you can see from the following chart. And the second chart below shows the current valuation of the FAANG stocks. As you can see, with the exception of Amazon, all the other FAANG stocks are trading below the average market valuation now. Amazon is a unique case and normal valuation metrics such as PE are not that meaningful here (as detailed in my early articles on Amazon). In terms of P/E based on TTM GAAP earnings, META is trading at 12.8x, about 1/2 of the average market valuation. Netflix and Google are trading around a 19x, more than 26% discount from the market average valuation. And the closest one is Apple, whose valuation is at 25x and still below the average market P/E.
In a nutshell, the current market condition is dramatically different from the beginning of the year. At that time, these mega-caps all sat on lofty multiples and tremendous valuation risks. And as such, I see the case of RSP as a lot less compelling now.
Source: Yahoo Finance Seeking Alpha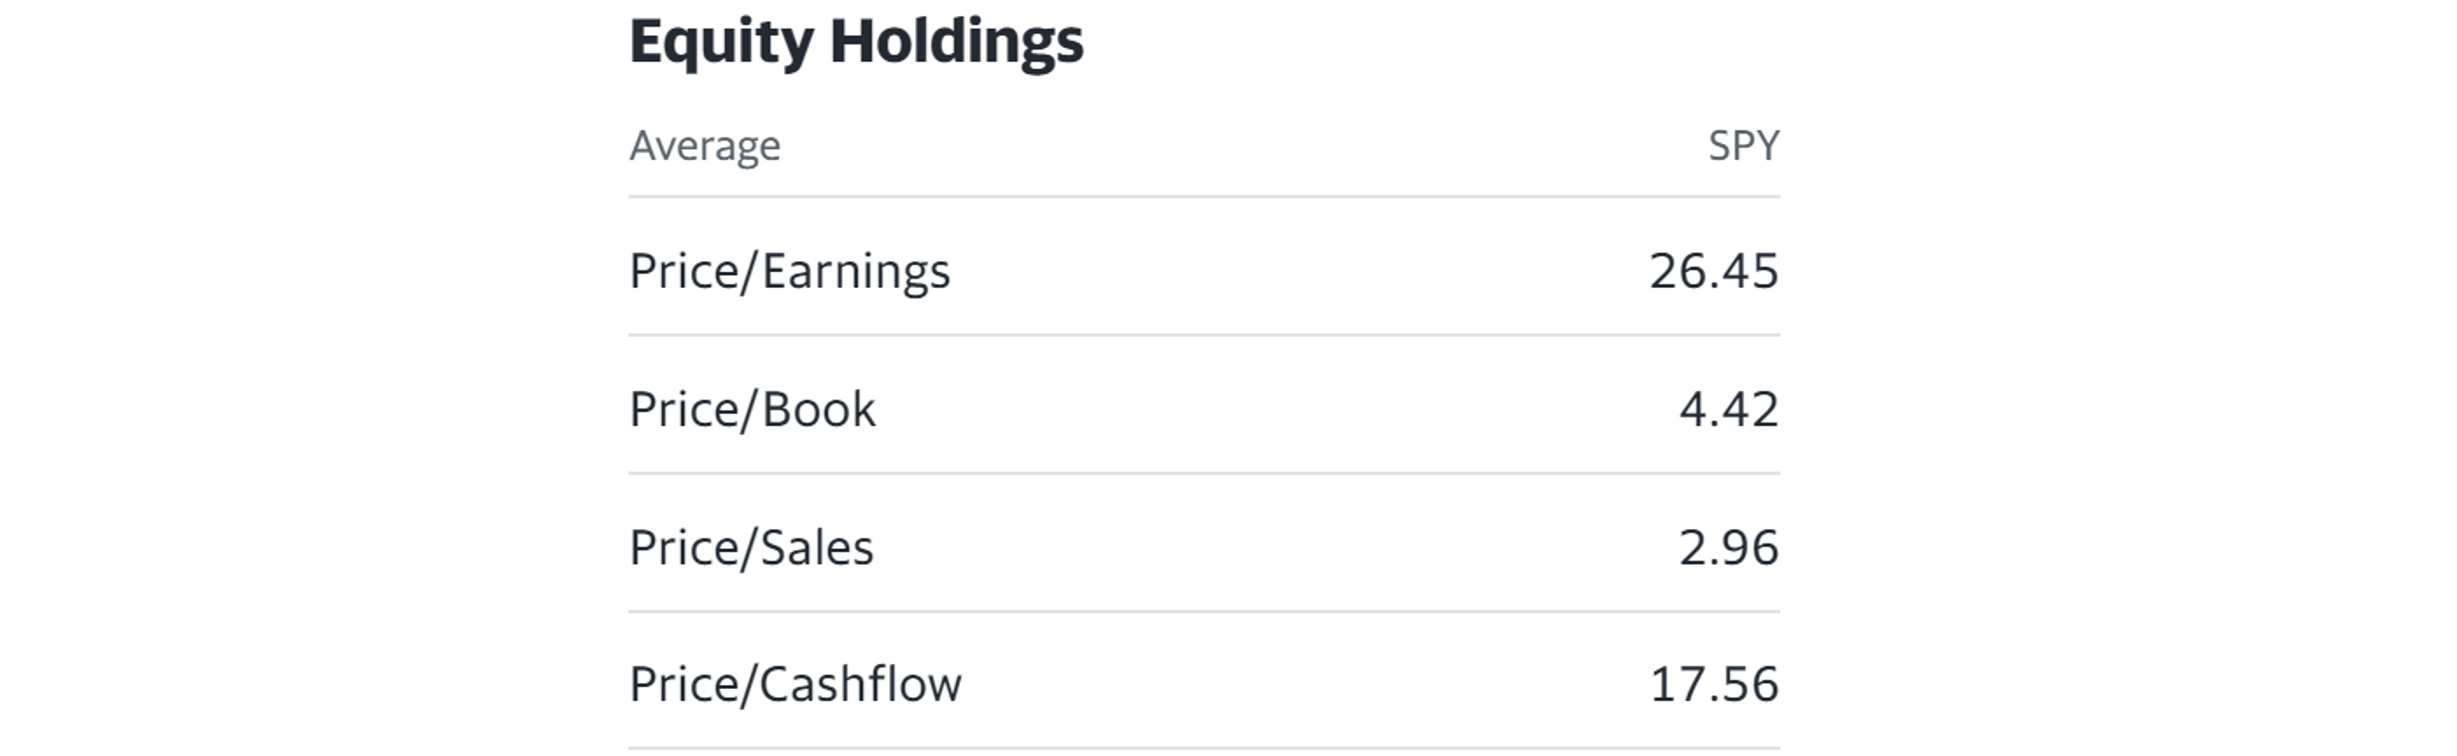
RSP vs. SPY: Performance
The next chart compares the funds’ performance since RSP’s inception. As can be seen, RSP largely tracked the standard SPY. Although it enjoyed a narrow outperformance. It has delivered a 9.4% CAGR, 0.5% above the SPY’s 8.9% CAGR. However, due to the valuation contraction analyzed above, I see unfavorable odds for such outperformance to continue in the future.
This is also a good place to contextualize the differences in their feasts. As mentioned above, RSP charges a fee that is 0.11% above SPY. Such a difference may not seem a lot (and it is not a lot). However, given that the average return is about 8% to 9% in the long term per year, an extra 0.11% fee translates into about 1.4% of the total return potential per year. Still not a huge deal, but it is a lot more than what’s on the surface in absolute terms.
Source: Portfolio Visualizer, Silicon Cloud Technologies LLC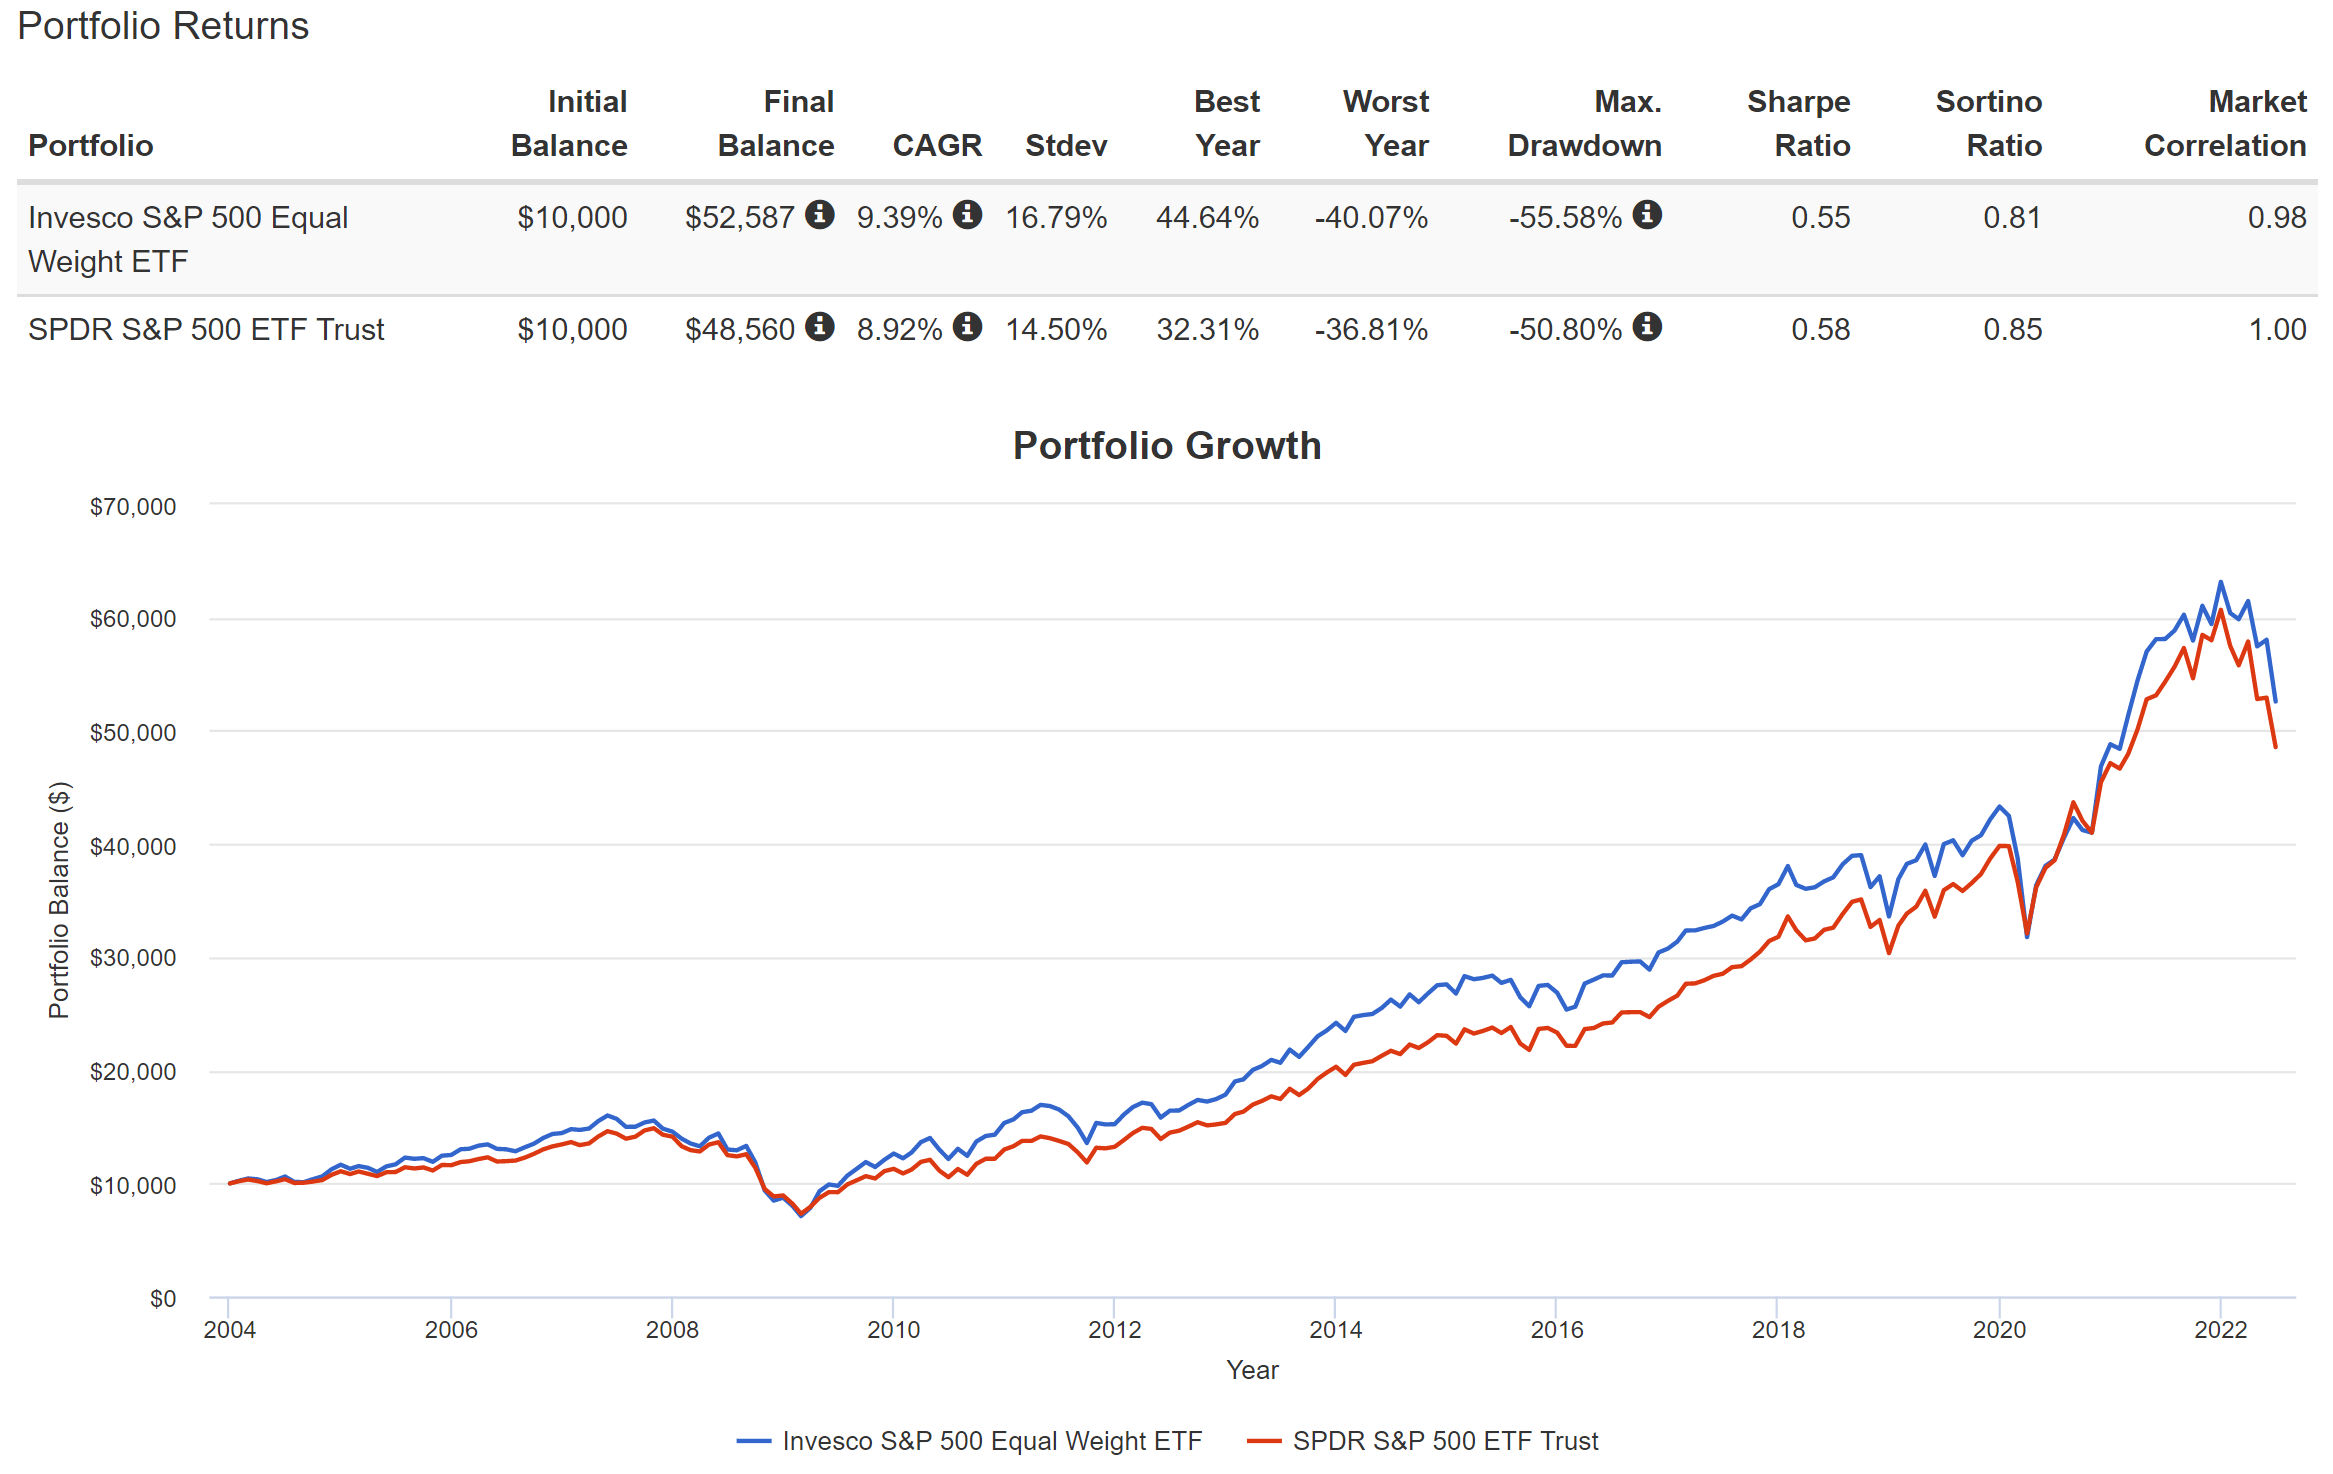
RSP vs. SPY: Risks
Despite the fact that RSP’s holdings are more evenly distributed and less concentrated, RSP actually has displayed larger volatility risks than SPY. As you can see from the data highlighted in the orange boxes in the following chart, RSP suffered a somewhat larger standard deviation (16.8% vs 14.5%), worse maximum drawdown (40% vs 37%), and worst year performance than SPY (56% vs 51%). It is another good illustration of our guiding investing philosophy – more holdings and/or more dilutions do not automatically reduce risks. More often than not, they represent a “diworsification” and actually increase risks.
Source: Portfolio Visualizer, Silicon Cloud Technologies LLC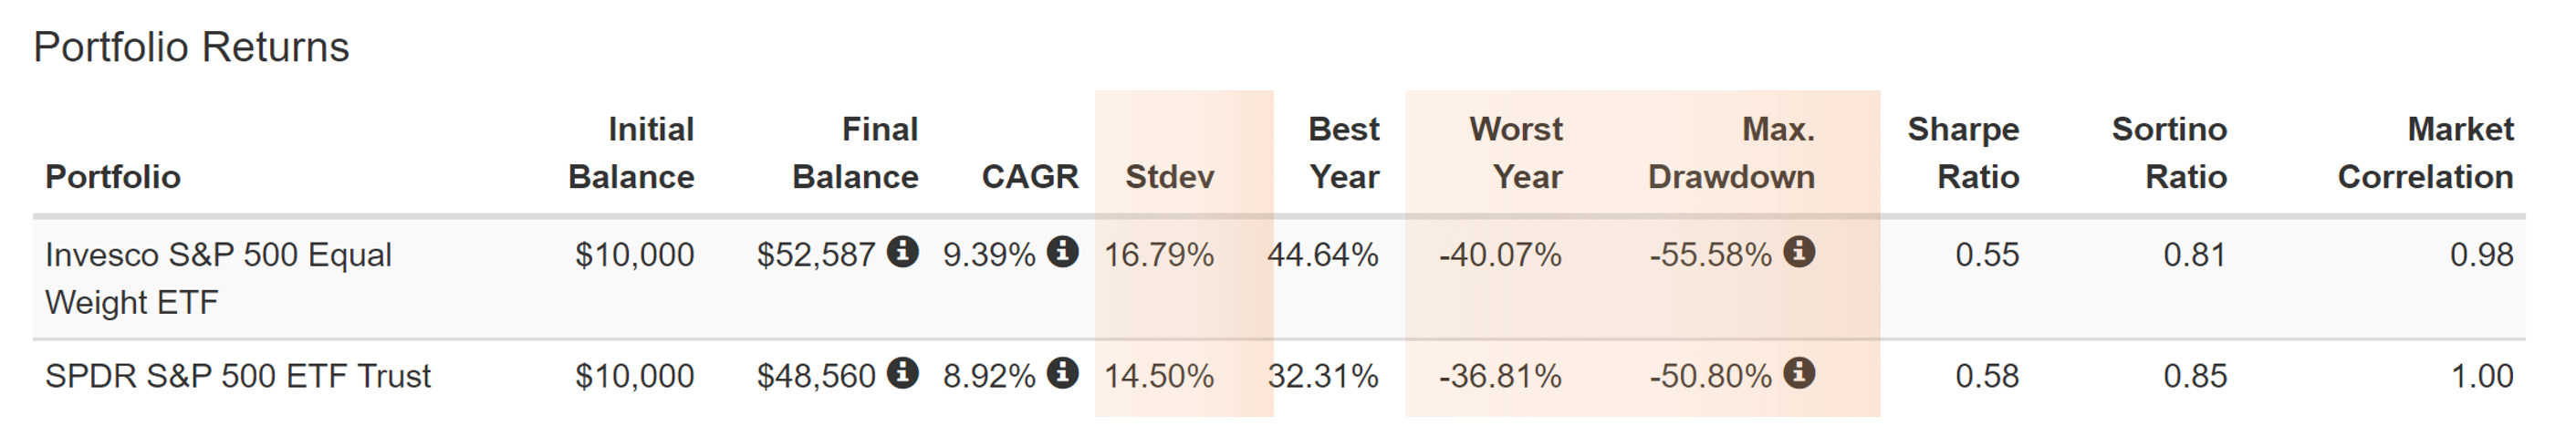
Final thoughts and risks
Fundamentally, investment in RSP is a bet against the largest companies. Like any bet, sometimes it makes more sense and sometimes less. This bet has outperformed SPY in the past 18 years or so by a small margin and outperformed SPY by a large margin of more than 3% YTD. However, due to underlying shifts in valuation dynamics, I see unfavorable odds for such outperformance to continue under current conditions. Many high-quality mega-caps like the FANNG stocks are currently trading below market average valuation. RSP’s higher fee and larger volatility risks are additional concerns.
Although, there are arguments for RSP too. And the one that surprised me the most is that RSP actually pays HIGHER dividends than SPY. Before doing the research in this article, my pre-assumption was that RSP pays lower dividends than SPY because it puts less weight on large- and meg-caps, which are the more mature businesses that tend to pay higher dividends. But the data below show the exact opposite. RSP actually pays higher dividends than SPY, as you can see. As of this writing, RSP yields 1.69% on a TTM basis and SPY yields 1.52%, a difference of 17 basis points or more than 11% in relative terms. For investors who need the current income, an 11% difference in current income is sizable and should be part of the investment decision.
Source: Portfolio Visualizer, Silicon Cloud Technologies LLC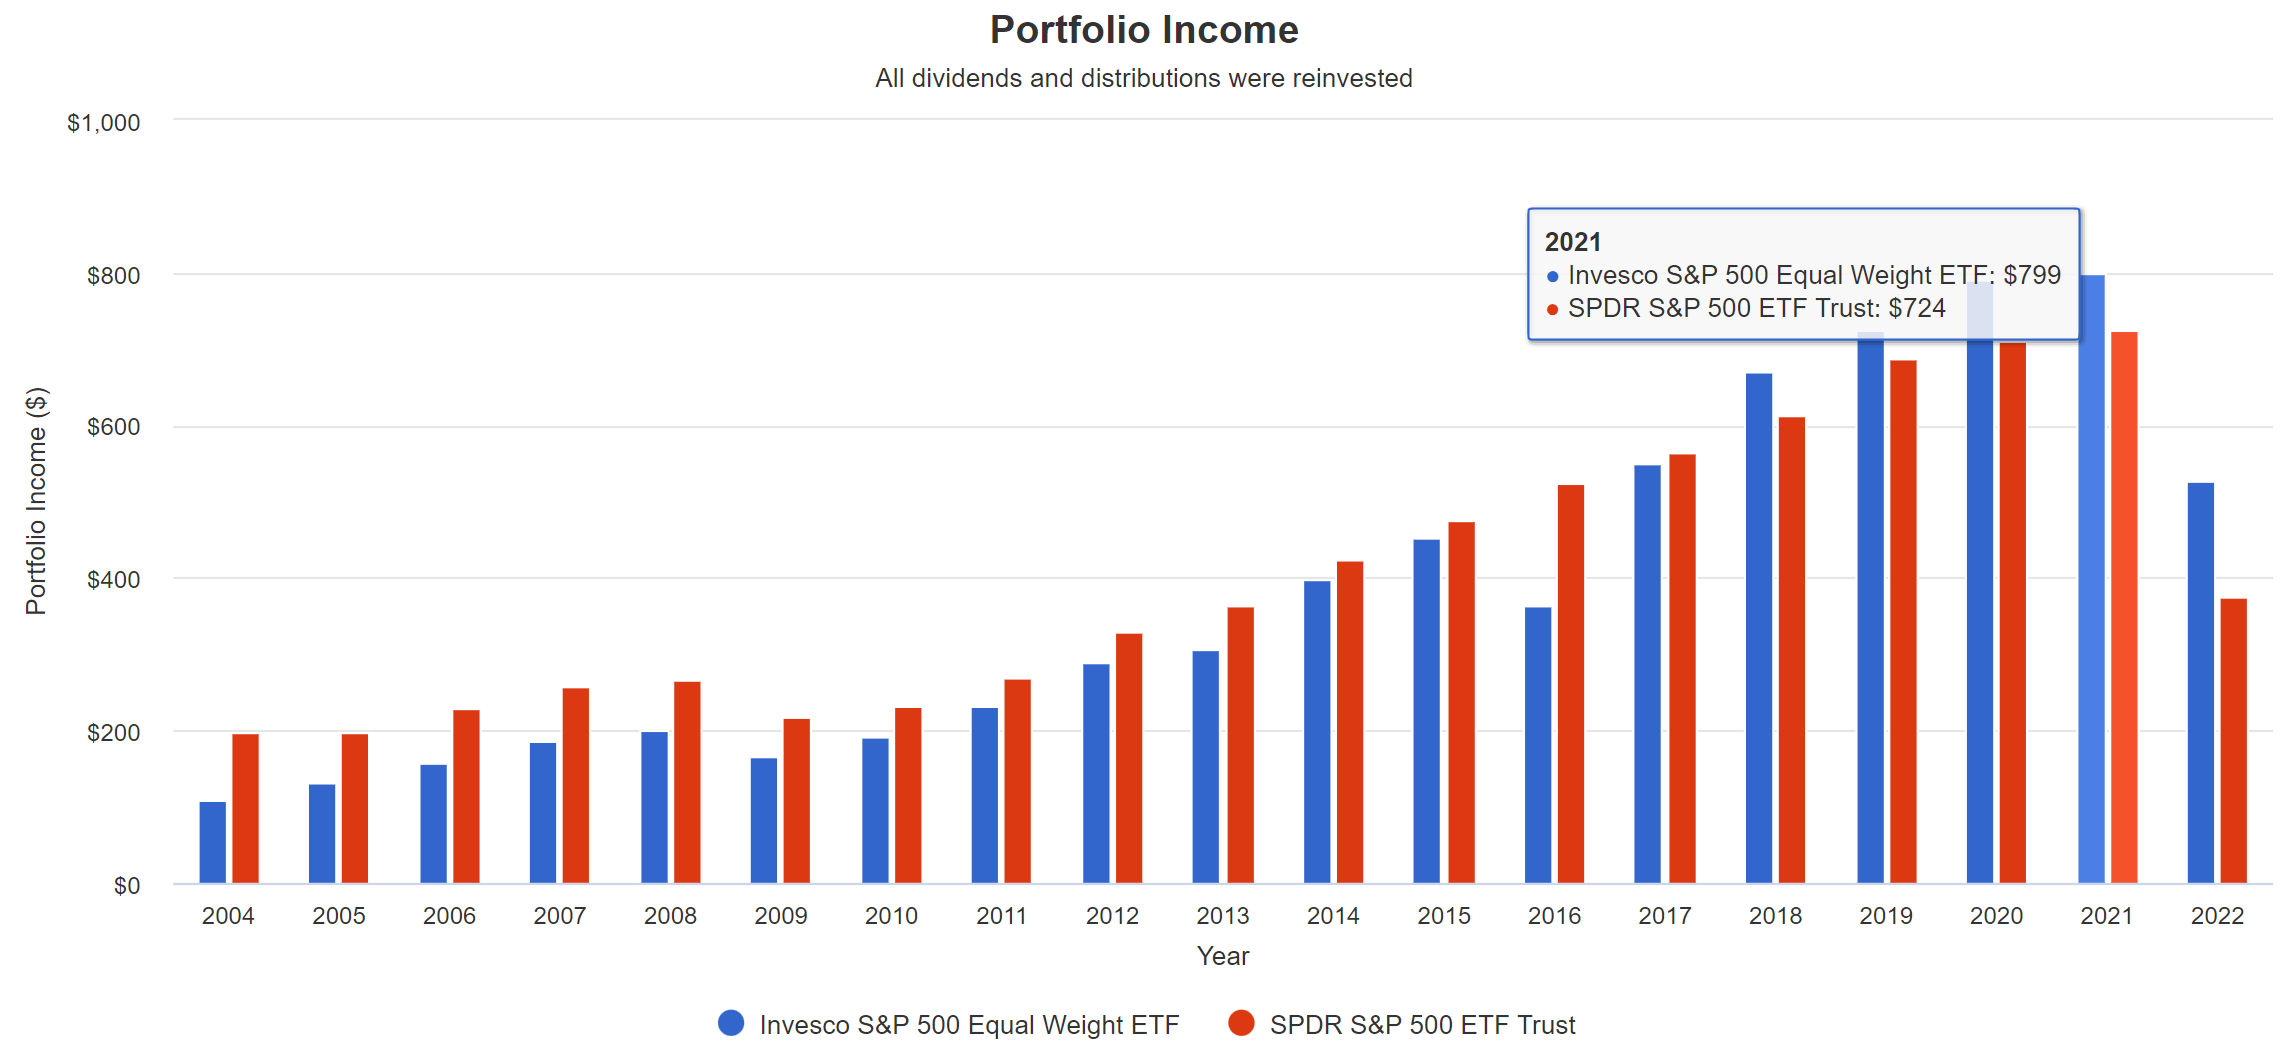
Be the first to comment