


William_Potter
2022 has been a bad year for the traditional 60/40 portfolio, as both equities and bonds are down.
An alternative is to look for hedge fund-like strategies. We previously discussed trend following, and today we take a look at risk parity. Risk parity portfolios are often called all-weather portfolios because they are supposed to work in all environments. This isn’t the case in 2022. The asset classes that are supposed to hedge against inflation, TIPS and the commodity exposure, have disappointed so far this year. The rising real yields negatively impacted TIPS and gold. The gold allocation is completed by commodity-producing stocks and by commodities as such. Commodities and energy in particular performed better than the commodity stocks in the portfolio of the RPAR Risk Parity ETF (NYSEARCA:RPAR).
We prefer RPAR above a traditional 60/40 portfolio due to the higher exposure to energy and metals & mining stocks, which are in an uptrend. But the bond exposure is too big for us to buy RPAR right now.
All-weather portfolios
Traditional 60/40 portfolio invest 60% in stocks and 40% in bonds. When you look at the volatility of such a portfolio, something like 90% of the portfolio’s risk is due to the stocks. A risk parity portfolio looks first at the risk allocation and the final asset allocation is the result of this equally weighted risk allocation.
RPAR, e.g., divides the risk allocation equally to stocks, bonds, TIPS and commodities.
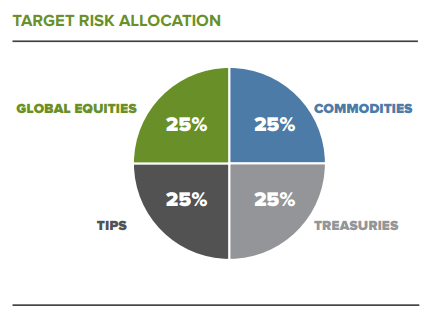
Figure 1: Risk allocation (Evoke Advisors)
This results in the below target asset allocation.
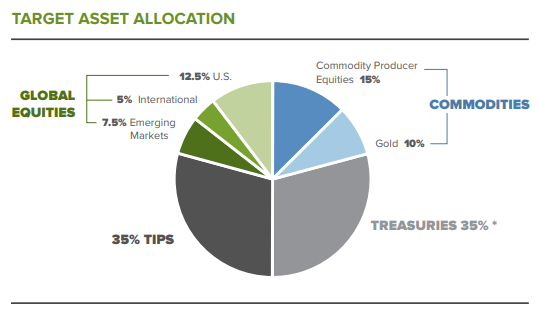
Figure 2: Asset allocation (Evoke Advisors)
Since stocks are more volatile than bonds, they receive a smaller percentage of the ETF’s asset allocation, even though they account for 25% of its risk allocation. Treasuries and TIPS account both for 35% of the portfolio, stocks and commodities are each 25%—for a total of 120%. The total is bigger than 100% because risk parity funds use leverage to equalize the volatility levels between asset classes.
RPAR invests across four diverse asset classes that are biased to perform well in very different economic environments.
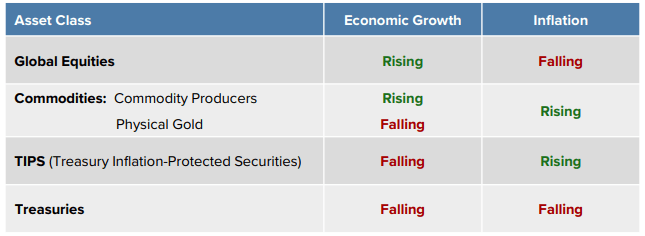
Figure 3: Asset class performance (Evoke Advisors)
The most famous risk parity portfolio is Bridgewater’s “All Weather Strategy.” Whatever the weather, there would always be a part of the portfolio that is performing well. That’s the promise of risk parity: the ability to “weather” all market environments with relatively low volatility and drawdowns.
That’s also the aim of RPAR: to seek an equity-like return with less risk over the long run by diversifying across four asset classes, each with “unique environmental biases.”
In a stylized graphical way, this should look like this:
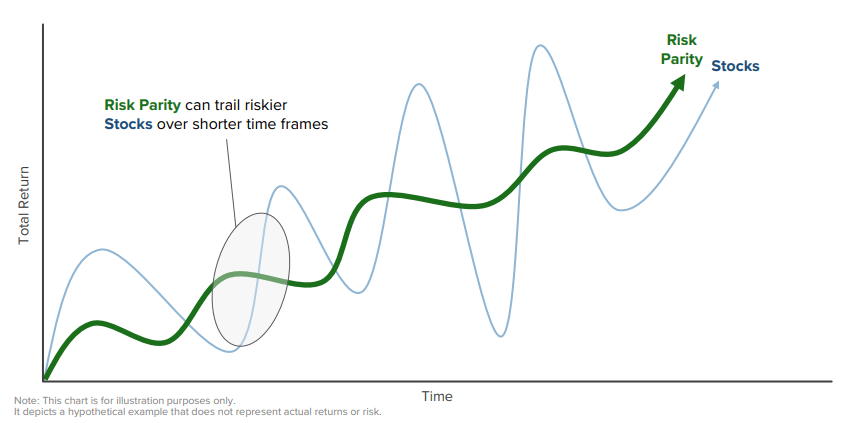
Figure 4: Equity-like return with less risk (Evoke Advisors)
Bad-weather correlations
Risk parity isn’t really performing as expected. Normally, equities tend to do well in a strong economy, while treasuries tend to outperform in a weak economy. Both equities and treasuries tend to underperform when inflation spikes, so inflation-hedging assets, such as commodities and TIPS, are included to further improve diversification.
RPAR even underperformed the iShares Core Moderate Allocation ETF (AOM), that’s invested 60% in equities and 40% in bonds.
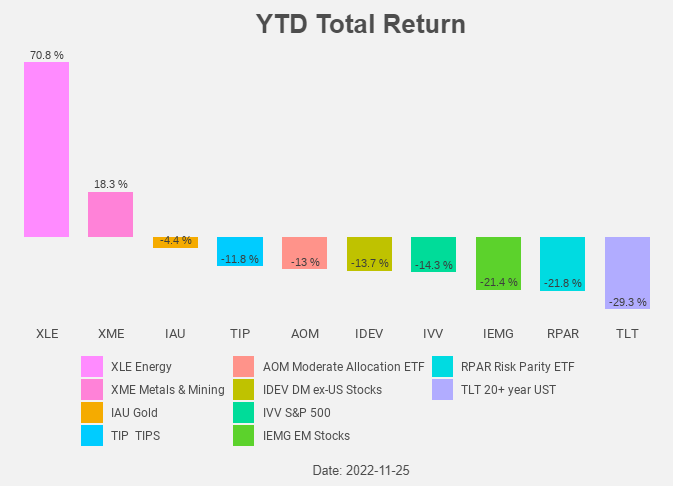
Figure 5: Total return chart (Yahoo! Finance, Author)
This year’s bad performance is due to both bonds and equities. Because they both went down at the same time, the correlation between them is positive.
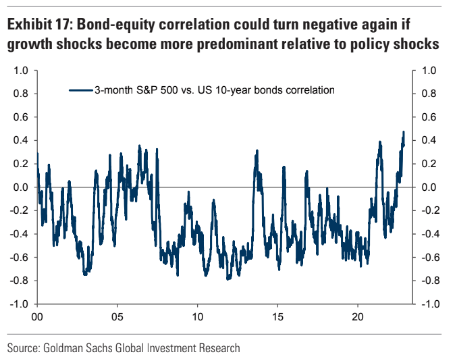
Figure 6: Bond–equity correlation (Goldman Sachs)
In “normal” circumstances, equities perform well when the economy is performing well, and this leads to higher interest rates and lower bond prices. In this environment, the correlation between stocks and bonds is negative and there are diversification benefits.
Now we have higher inflation that leads to higher interest rates. This drags down stock prices and bond prices. This means a positive correlation and fewer diversification benefits.
During the Volcker era, inflation was also the dominant factor, and we had also positive correlations. Afterwards, growth became the dominant driver and correlations were negative. And now we are again in an inflationary period with positive correlations.

Figure 7: Correlation (Evoke Advisors)
Research by AQR showed the same: bonds and stocks are positively correlated when inflation is the dominant driver and negatively correlated when growth is the dominant driver. They also looked at commodities. And commodities are negatively correlated with both bonds and equities in inflationary environments. That’s what we saw also this year: bonds and equities are down and commodities are up. Commodities proved to be a great diversifier.
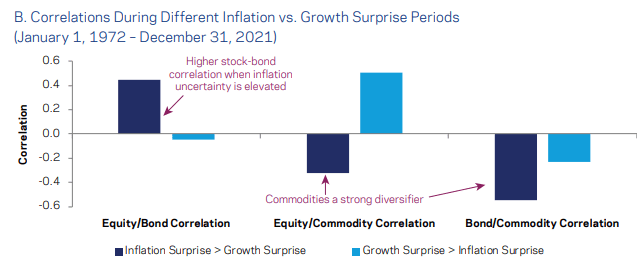
Figure 8: Correlations ((AQR))
It’s a bit unfortunate that RPAR doesn’t use commodity futures to get commodity exposure, but gold and commodity producers. They are underperforming commodity futures and, like bonds and equities, down in the current tightening cycle.

Figure 9: Performance in tightening period (Evoke Advisors)
And what about TIPS? Normally they are added to the risk parity mix because of their inflation-hedging capabilities, but due to the rising real yields TIPS are down this year.
RPAR
The RPAR Risk Parity ETF is managed by Evoke Advisors. The co-CIO is Damien Bisserier, who spent nearly a decade at Bridgewater Associates and hence knows the ins and outs of risk parity portfolios. The gross expense ratio is 0.53% and the dividend yield is 5.25%.
The asset allocation is in line with the target asset allocation.
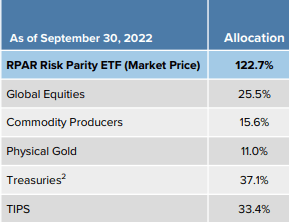
Figure 10: Portfolio composition (Evoke Advisors)
What’s next?
Will we get a recession? That would be bad for equities and commodities and good for treasuries and TIPS. Will inflation stay higher for longer? In this case, the inflation hedges like commodity producer equities and gold would benefit. And even TIPS could start to act (again) as an inflation hedge. So far, they were heavily impacted by the rising real yields. We do not think that real yields will rise much further from the current levels. Rising real yields also were a headwind for gold. As was the rising dollar.
The current bad performance of risk parity portfolios is reminiscent of the Volcker-era tightening period in the 80’s. When that tightening ended, the performance improved markedly.
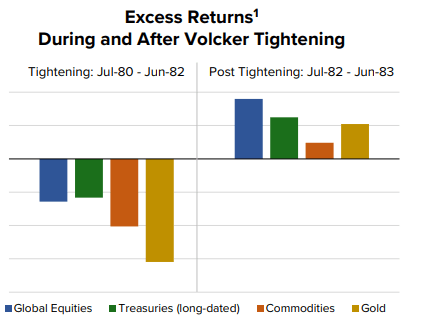
Figure 11: Performance in Volcker tightening (Evoke Advisors)
This might happen again when the Powell tightening is over. The question is now: when will the FED end the rate hikes? It is expected that the FED will add another 50 bp to the fed funds rate in December. What comes after that meeting?
The 2-year Treasury note yield might give us a clue. As the chart below from John Hussman shows, there is a close relationship between the 2-year yield and the average fed funds rate over the following 6 months.
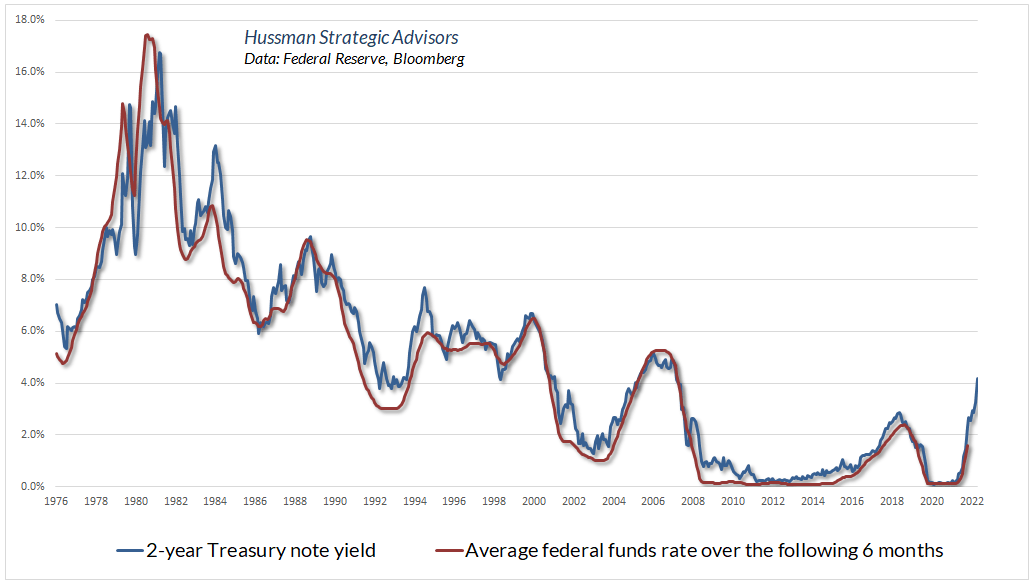
Figure 12: 2-year yield vs average fed funds rate (Hussman)
The 2-year yield is now 4.48%. In order for the average fed funds to be in line, we need a 25 bp rate increase at the February and March meetings. This translates into a range of 4.75 to 5.00% in March. The peak rate that can be deducted from the fed funds futures is still doubting if there will be a 25 or a 50 bp rate increase in February. For sure, the end of the rate hikes will not be tomorrow.

Figure 13: March 2023 target rate probabilities (CME Group)
When we look at the long term trends, we can only conclude that it might indeed be a good idea to postpone an investment in RPAR.
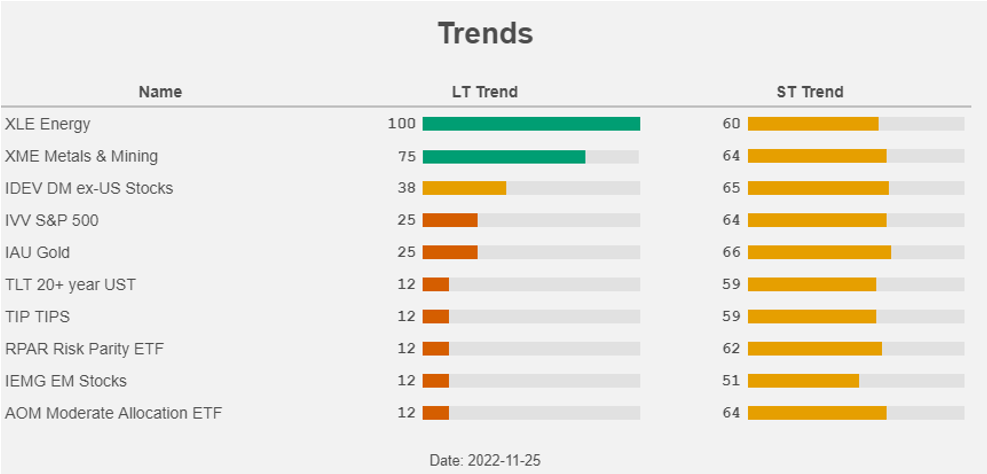
Figure 14: Trends (Yahoo! Finance, Author)
Commodity producer equities and developed markets ex-U.S. equities are the only building blocks that are not in a downtrend. RPAR is itself still in a downtrend, as is the case for a 60/40 portfolio like AOM.
Conclusion
We prefer a portfolio that’s tilted away from stocks and bonds towards commodities, energy, metals & mining, and other alternatives like trend following. Risk parity is also a hedge fund-like alternative, but still contains a lot of bonds. If we get a recession, bonds will play their safe haven status and perform well, but inflation won’t come down fast and we do not expect a year-long bond bull market like the one we had. For sure, both the nominal and real yields are much higher and interesting now.
While RPAR is certainly an improvement compared to a traditional 60/40 portfolio due to the higher exposure to energy and metals & mining stocks, the bond exposure is still too big for us to buy RPAR Risk Parity ETF right now.
Be the first to comment