

Mario13
Shoulda Coulda Woulda
“Two things are infinite: the universe and human stupidity; and I’m not sure about the universe.” ~ Albert Einstein
9.1%. There is not a single person in the financial world who does not know this number. 2% is the other one. There is a lot of space between these two numbers, and many correctly hold the Federal Reserve (aka Team Transitory) accountable as they sat idly by last year watching inflation pressures mount. Had they started reducing their monthly $120 billion bond purchases and calmly raising the Federal Funds rate during the 2021 window of economic recovery, fiscal support and robust financial markets, we would not be facing an economic recession and financial market instability as the US Central Bank hits the panic button.
For context, let’s look at two numbers. We will not dwell on the past for too long. It is far more interesting to puzzle out the future.
CPI YoY Index 1960-2022 (US CPI Urban Consumers YoY, NSA)
Source: Bloomberg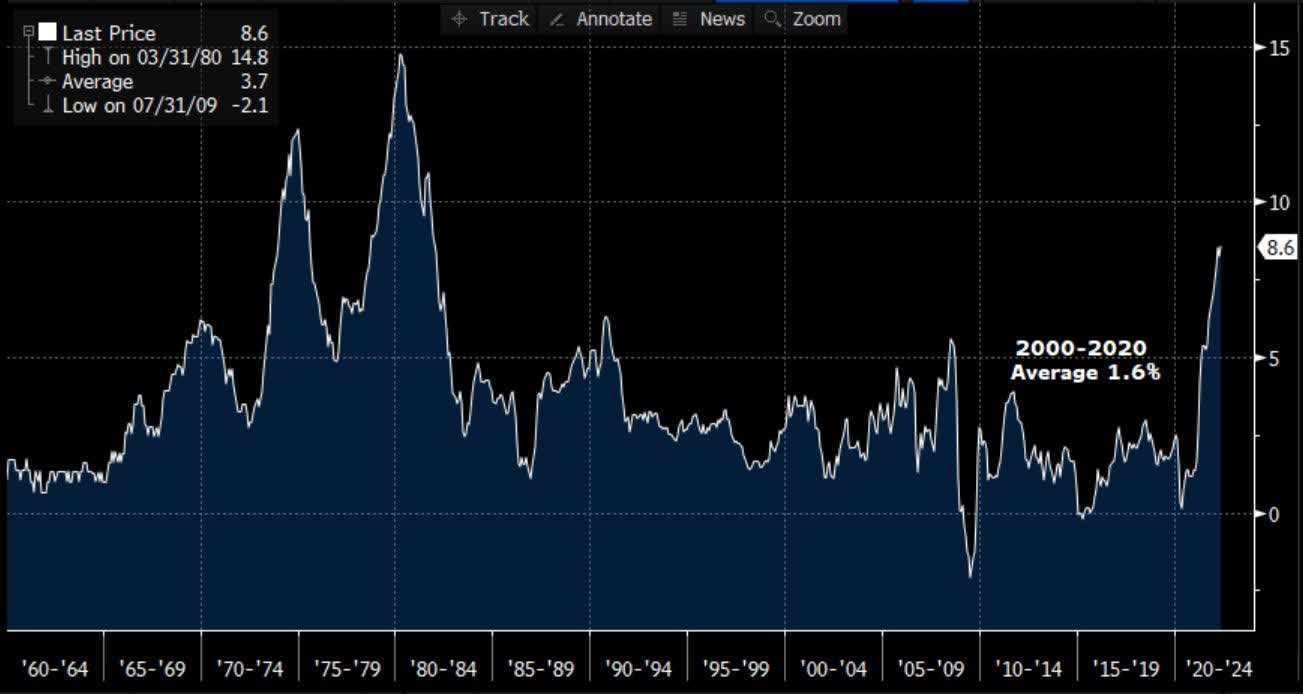
During the period post-Global Financial Crisis or GFC (March 2009) to the Covid pandemic (January 2020) inflation averaged 1.6%, comfortably under the Fed’s 2% target. In 2021 inflation rose from 1.4% in January to 7.0% by December. As of May 2022, it stands at a 41 year high of 8.6%.
The drivers are well-known. The common global denominator is the massive and ongoing postGFC injections of liquidity by Central Banks which became even more intense during the pandemic. Also, persistent Covid-induced supply bottlenecks, structural supply chain reorganization, the Russian-Ukraine war and consequent impact on commodity prices are major contributors. Combined with Central Bank lethargy, investors are left wondering just how entrenched inflation is…it is really the only question that matters.
US Government 10 YR Sovereign Bond Yield
Source: Bloomberg 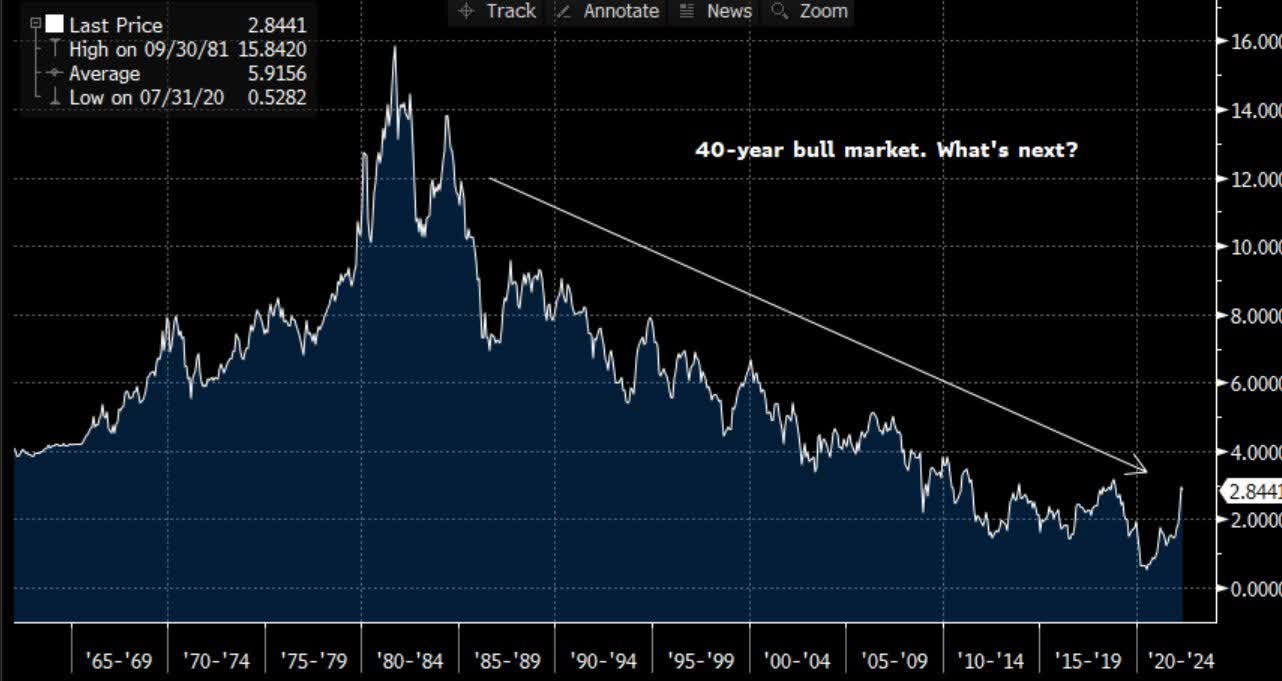
Since Paul Volcker broke the back of inflation in the late 70’s/early 80’s, the US 10-year sovereign bond has essentially been a one-way bet. Any investment professional with less than 40+ years in the financial markets knows nothing but the Fed put. Their neural pathways are deeply entrenched. And since US Treasuries, specifically the 10-year bond, is considered the risk-free rate against which all other risk assets in the global financial system are priced, this “perma-put” has reverberated around the world; stocks, corporate/sovereign bonds, commodities, property prices globally have all been supported by US Central Bank policy. SPACs, or blank check companies, are perhaps the epitome of the absurdity that accompanies persistent ultra-loose monetary policy.
One thing has made Central Bank actions and the bond bull market possible: Low inflation. Between 1983 and 2020, inflation averaged 2.6%, not too far above the Fed’s 2% target rate. This gave them cover to lower rates and keep them low which fueled the technology bubble (19962000) and the housing bubble (2003-2008) that ended in tears with the GFC in 2008. Since 2008, The Federal Reserve put has been in overdrive. No need to go into detail on this, it is a widely covered subject.
The point is most investors are wired to expect monetary policy to bail them out. Thank goodness for neuroplasticity. Anyone under the age of 70 in the financial world will need to create new neural connections in order to break old ways of thinking. Until inflation is under control, the Fed must remain restrictive, like a boa constrictor around its prey, tightening until it’s over. This has basic mathematical implications for us financial analysts. Higher discount rate equates to lower valuations.
Thus, looking to the prior 10 years of valuation history for context on a given stock is an exercise in myopia. The embedded discount rate is too low. We are looking back pre-GFC for insight. Multiples are much lower. It makes sense: The rate at which we must discount future cash flow rises with the 10-yr US bond yield.
Turning to Europe, they are in a different position than the United States. They have a war in their backyard, and they are dependent on the aggressor for hydrocarbons, especially natural gas. Russia is the most important natural gas supplier to the EU, at ~45% of gas imports in 2021. This is over twice the size of the second largest exporter to the EU, Norway. Natural gas dependence has become an albatross for Europe since Russia invaded Ukraine in February 2022.
Condemnation and economic sanctions imposed by EU members have been met with threats of supply cutoffs and actual curtailments, making diversification of supply even more imperative. Russia has cut supply through Nord Stream 1, a major pipeline into Europe, by 60%. Dependency on Russian gas will decline gradually and be replaced with regional supplies (Norway, Algeria) and LNG (US, Qatar, Australia).
In the meantime, the war has exacerbated the inflation problem in the Eurozone that has accelerated to an all-time high in June, up 8.6% year-over-year, mainly driven by food and energy prices but also broadening and intensifying into other goods and services. Clearly the war is slowing growth, disrupting trade, causing shortages in various goods and pushing up prices of food and energy.
The potential for a long and deep recession makes monetary policy normalization tricky, which is why the European Central Bank (ECB) is reluctant to tighten aggressively. As well, the ECB has been very clear that the pandemic emergency purchase program (PEPP) will reinvest principal payments from maturing securities, asymmetrically across countries if required, to avoid “fragmentation” aka a revenge of the PIIGS (Portugal, Italy, Ireland, Greece, and Spain, which all had too much debt going into the GFC).
A decade after the European debt crisis, it is astounding that peripheral Eurozone economies are still so fragile that they are a potential source of destabilization as rates rise. The ECB has guided to an initial 25bps hike in July and another, size unknown, in September. The euro has sunk toward parity with the dollar, a function of the war and relatively faster rate hikes in the US. Unfortunately, euro weakness only exacerbates Eurozone inflation by making imports more expensive.
If the Eurozone is cautious with respect to the pace of tightening, Japan is downright adamant about holding the 10-year JGB yield at 25 bps. Shockingly, Shinzo Abe, Japan’s longest serving Prime Minister (2012-2020) and champion of Abenomics, was assassinated on July 7, 2022. His economic policies were based on the “three arrows” of monetary easing, fiscal stimulus, and structural reform. The aim was to galvanize the Japanese economy that had suffered years of deflation and sluggish economic growth post the 1991 bursting of the asset bubble.
While the first two arrows were implemented quickly and with some success, the third arrow unsurprisingly has proved more difficult to implement. The headline issue in Japan today is the Bank of Japan’s (BOJ) seemingly unshakeable adherence to Abenomics-borne yield curve control (YCC) and the consequent extraordinary weakness in the yen that has depreciated over 30% versus the dollar since the onset of the Covid-19 to the weakest level in almost a quarter of a century.
While the rest of the world (ex-China) raises interest rates to combat inflation, the BOJ continues to defend a 0.25% cap on their 10-yr JGB with unlimited bond purchases. As in Europe, currency weakness is a function of widening interest rate differentials and the increasingly attractive carry trade. Abe was hugely influential behind the scenes (“shadow shotgun”) and a major proponent of YCC as a means to stimulate growth. There is some question now as to policy direction and the durability of the BOJ’s current monetary stance now that Abe has passed and inflation is rising, although not yet to levels in the US and Europe.
Regarding China, Premier Li Keqiang summed it up nicely: “China’s economy is recovering but the foundation of that recovery is not solid, and more efforts are still needed.” Indeed, achieving their GDP growth target of 5.5% in 2022 will require an acceleration in growth in the second half of the year and many doubt this is possible. Supporting economic growth heading into the 20th Party Congress in November is crucial for Xi Jinping who wants to further consolidate his power.
The two-month Shanghai lockdown is over however, the Zero-Covid policy is still in place, making further lockdowns a material risk to recovery. In the meantime, with inflation in check, infrastructure spend is accelerating as local governments issue bonds and rapidly deploy funds. Total government spend has increased 12.4% in the first five months of 2022, the highest on record for a comparable period and many other monetary and fiscal stimulus measures are being implemented to revive growth. For now, optimism reigns and the stock market is outperforming other major markets around the world.
The Road Ahead
There is only question that matters: How sticky will inflation prove to be as the global economy slows? Answer this question and all else follows. If we view the future as a spectrum of outcomes, we can start by describing the opposite ends. On one end inflation is persistent and the Fed has no choice but to continue to tighten and induce a recession, depth and duration unknown. On the other end, inflation peaks fairly quickly and moves toward their 2% mandate with little economic damage.
For those of us thinking about portfolio positioning in the coming quarters and years, this broad range of outcomes keeps us up at night. Positioning for a Fed going back to loose monetary policy is quite different from if they continue to tighten and rates remain high for years to come. The former implies a growthier tilt to the portfolio, the latter leans more toward value. While we are bottom-up stock pickers at Rondure, this stuff still matters…a lot.
It is clear that the global economy is slowing and financial conditions are tightening. Price and availability of credit has changed significantly over the past couple of months. Commodity prices, with the exception of natural gas in Europe, have retreated over the last month or so, discounting recession fears. Transportation costs are coming back to earth as softening demand works its way through the supply chain.
If this continues, falling input prices will support corporate margins, an obvious positive, but the risk is now top line growth to the extent rising interest rates choke demand. We think it is safe to say that earnings are still at risk, even if input costs pressure is abating. It is important to carefully assess the risks to top line growth.
It is well-established that offshoring contributed to the long-term disinflationary trend as high paying blue and white-collar jobs migrated to low-cost countries. Thus, the reshoring trend we are seeing because of Covid has the potential to do the opposite i.e., create structurally higher levels of inflation based on higher labor costs. The pandemic has caused a wholesale rethink of foreign based manufacturing and supply chains, particularly after the strict lockdowns in China and elsewhere in Asia that were (and still are) extremely disruptive to the production and movement of goods.
The construction of new manufacturing facilities in the US has picked up: Intel, TSMC, US Steel and Nucor, to name a few, have announced capital reallocation to the US. As well, many companies are moving their supply chains closer to home. The consequent creation of well-paying manufacturing and white-collar jobs is a major plus for US economic growth. (Potentially Mexico too, benefiting from “nearshoring.”) However, structurally higher inflation may also be a result.
Yogi Berra once said, “You can observe a lot by just watching.” Indeed. The amount of uncertainty in the market has got to be one of the highest in recent years. Are we witnessing the end of the 40year bond bull market, or will we be back to status quo easy monetary policy before too long? The former requires forging new neural pathways that don’t involve justifying FAANG stock multiples. (Not that we ever did.) To make sense of the world and the torrent of information coming at us every day, we need to watch closely and listen carefully in order to make the most accurate observations that will guide in our stock picking.
New World Commentary
Emerging markets (EM) were the first markets to enter a bear market, starting with China, in early 2021. This market correction was led by stringent Covid policy in China and other regions in Asia and a strict and unpredictable regulatory regime in China. Part of the correction was also just the biggest weight in the index—China—hitting tough Covid comps first, leading to earnings deceleration. Fresh Covid lockdowns this year amplified that deceleration, but it also means help in the form of more stimulus is likely on its way—tightening conditions are closer to an end in China than the early innings we are seeing in the developed world.
We believe valuations in high quality companies became attractive in China during the past quarter. China was a world leading market in the quarter. Perhaps, it is leading EM improvement, and the relative outperformance of China over most developed markets is a signal we are getting closer to the end of the long dry spell?
As the news on the Chinese economy got worse and stocks corrected on stringent Covid policies, we finally saw an opportunity to buy some of our favorite follow list names and add to a number of our existing positions. We were particularly excited about stocks that will benefit from an eventual reopening of China.
We remain underweight with diversified holdings, but we have closed a bit of the gap on the index. China is one of the few countries in the world not fighting inflation with the potential for more stimulus on the horizon. The team continues to pick our spots in great quality businesses. Our main bias is to domestic demand driven companies and reopening stories, where we see quality with a margin of safety in price.
We remain overweight periphery countries such as Indonesia, Thailand, Malaysia, and the Philippines. Each remains a beneficiary of reopening. We also have continued to invest heavily in Mexican companies. All of the above regions will likely ride the tide of supply chains diversifying away from China.
We remain overweight India for its depth and breadth of high-quality businesses combined with its long duration growth story. We are cognizant that long duration growth equals higher multiples in India, and hence our stocks might struggle for a bit longer in a rising rate environment.
We are cautious around businesses and countries that export high-end consumer goods to the US, as the US tries to unwind its inflation problem. This primarily impacts the countries of Taiwan and South Korea, where we have an underweight position. Both countries are large exporters of technology to the United States consumer and have benefitted from years of easy money and hence demand from the developed world. These countries got an additional kicker from the consumer sitting at home during Covid. We are cautious on semiconductor stocks, specifically, as we believe earnings are at cyclical peaks.
However, we are aware that the market is already discounting some of this future contraction in growth—we just don’t think it is all in the price of these stocks yet. In addition, we think earnings have the potential to take a bigger step down than the market is assuming.
We do not own the Chinese internet giants. We still think they are subject to the regulatory whims of the government. China is a big place with lots of good companies. There are plenty of other fish in the sea outside of these constituents in the heavily concentrated MSCI EM Index. We love to farm the portfolio outside of the names you can own through a simple passive structure. We are different not for the sake of being different, but because we believe this should lead to good stock opportunities for the long run with less correlated performance and hopefully better downside capture.
There are certainly fewer eyeballs on the more differentiated stocks. While the internet giants had a big comeback in the quarter and we were underweight China, we still managed to keep up with good stock-picking—but we aren’t stomping in the ground where the herd stomps in EM.
Overseas Commentary
Many of the same factors that apply to New World apply to Overseas. We think China became attractive during the quarter. We still think the growth bucket of stocks looks expensive, but we also think the deep value stocks that have been so popular since inflation heated up look dangerous as well.
Deep value stocks, like energy, are part of the inflation problem not part of the solution. The US Federal Reserve needs oil prices to come down. They also need discretionary consumption to slow. They can control the demand side of the equation, and if I look at today’s numbers, 9.1% CPI, they still have not curtailed enough demand.
We are positioned in Overseas in a way that assumes the Fed needs to slow the US economy, and because the US economy has global implications, we are cautious around businesses that rely too much on an economic boom. Thus, essentially, from our bottom-up analysis, we are positioned in what we believe are good, simple businesses that we think are reasonably priced.
When we look at the number of technology stocks around the world, we believe the multiples have contracted (optically these stocks now look cheap on trailing results), but we also believe that in order to get inflation under control demand for the “stuff” that technology like semiconductors goes into needs to slow and fall. We are still seeing high levels of growth at these businesses, which we do not think is sustainable. We are being patient. We have more cash than normal, and we are just waiting for the time to strike.
In essence, we are in a waiting game right now. We like what we own for the long haul. We are biding our time on the names that were expensive (but high quality) going into this inflationary cycle. The margin of safety is still not obvious in these spaces to us yet.
When analysis by EV/S (enterprise value to sales) dies, it will be time. In a higher interest rate environment, profit today, tomorrow, and long term, matters. Profitless prosperity is no longer acceptable. When consolidation accelerates, job losses ramp up, and operating profit becomes a focus of money losing companies, it will be time. These are the lessons of the 99/00 tech bubble— a bubble we know well. We aren’t there yet. Waiting was so instrumental to portfolio success coming out of both the technology bubble and the GFC. We remind ourselves daily of those lessons of the past.
We shoulda woulda coulda sold more expensive stocks going into this year in Overseas, but we are glad we didn’t chase deep value, which is now rolling over, as a forced recession becomes a higher probability outcome to get inflation under control. Hence, we are positioned for a slowing global economy, which we feel is a likely outcome, with good companies at reasonable valuations. In essence, we are doing what we always do from the bottom up.
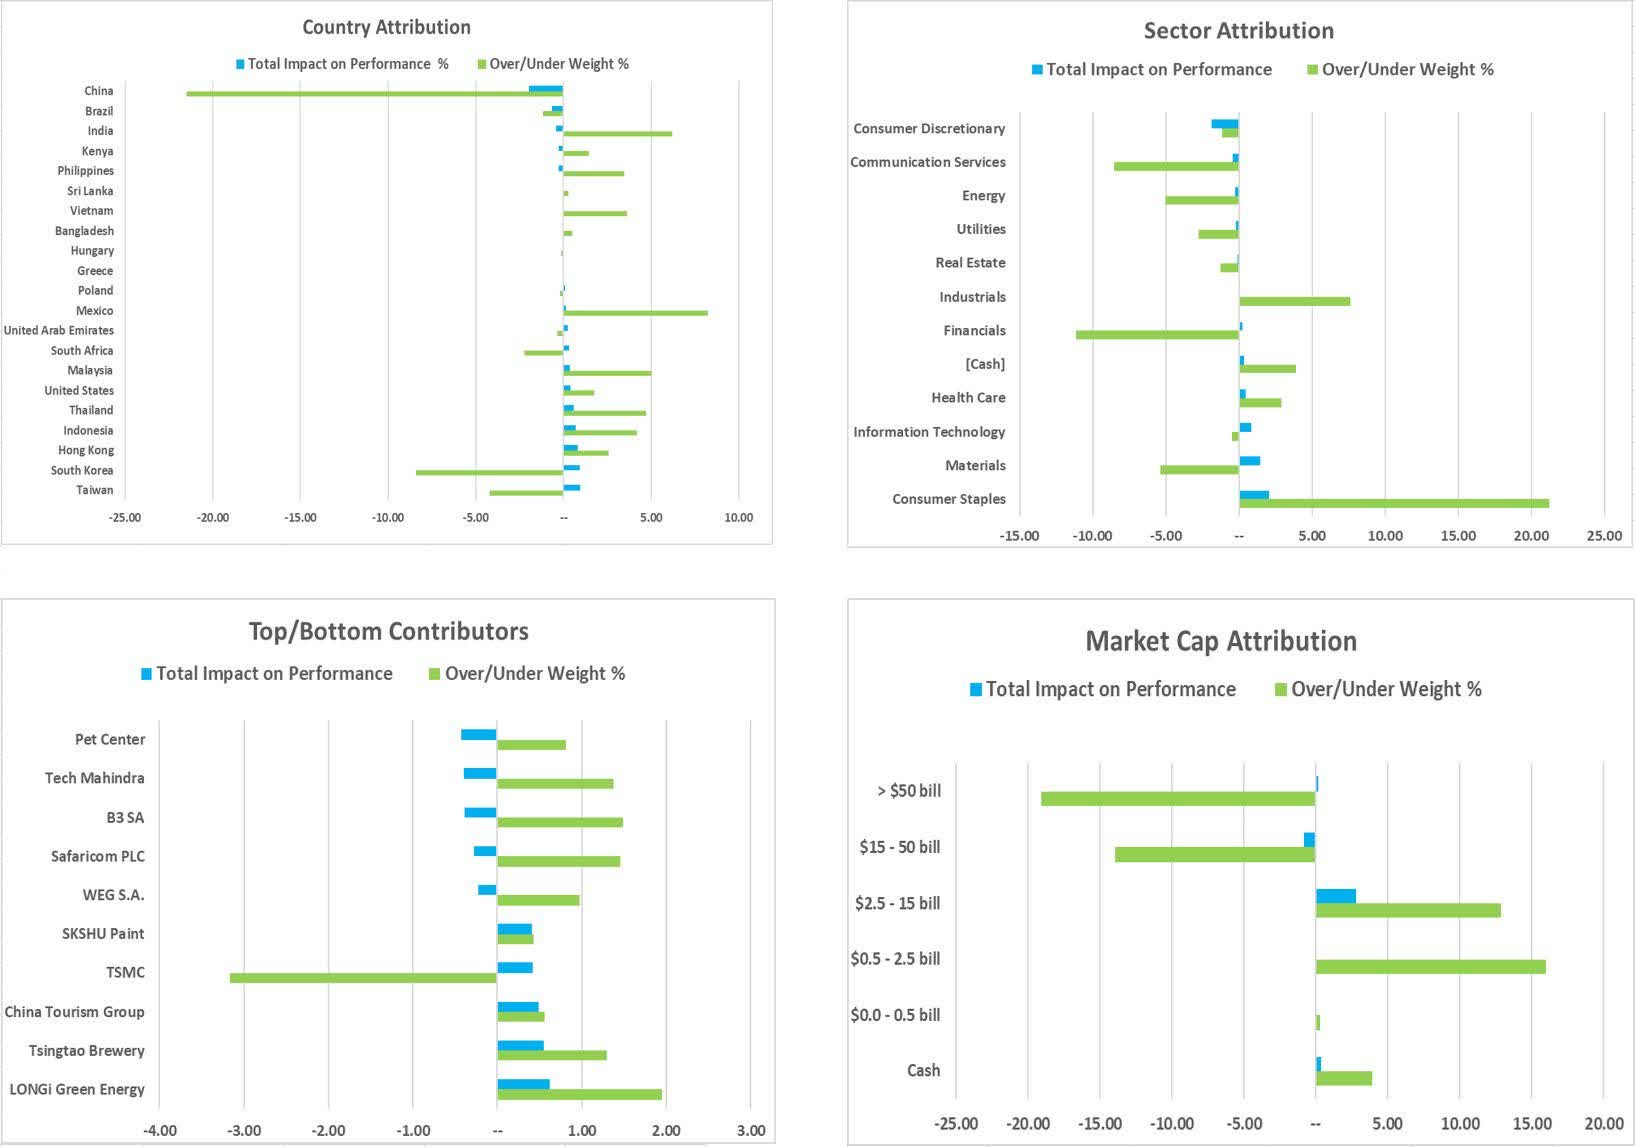
NEW WORLD ATTRIBUTION DASHBOARD 2Q 2022
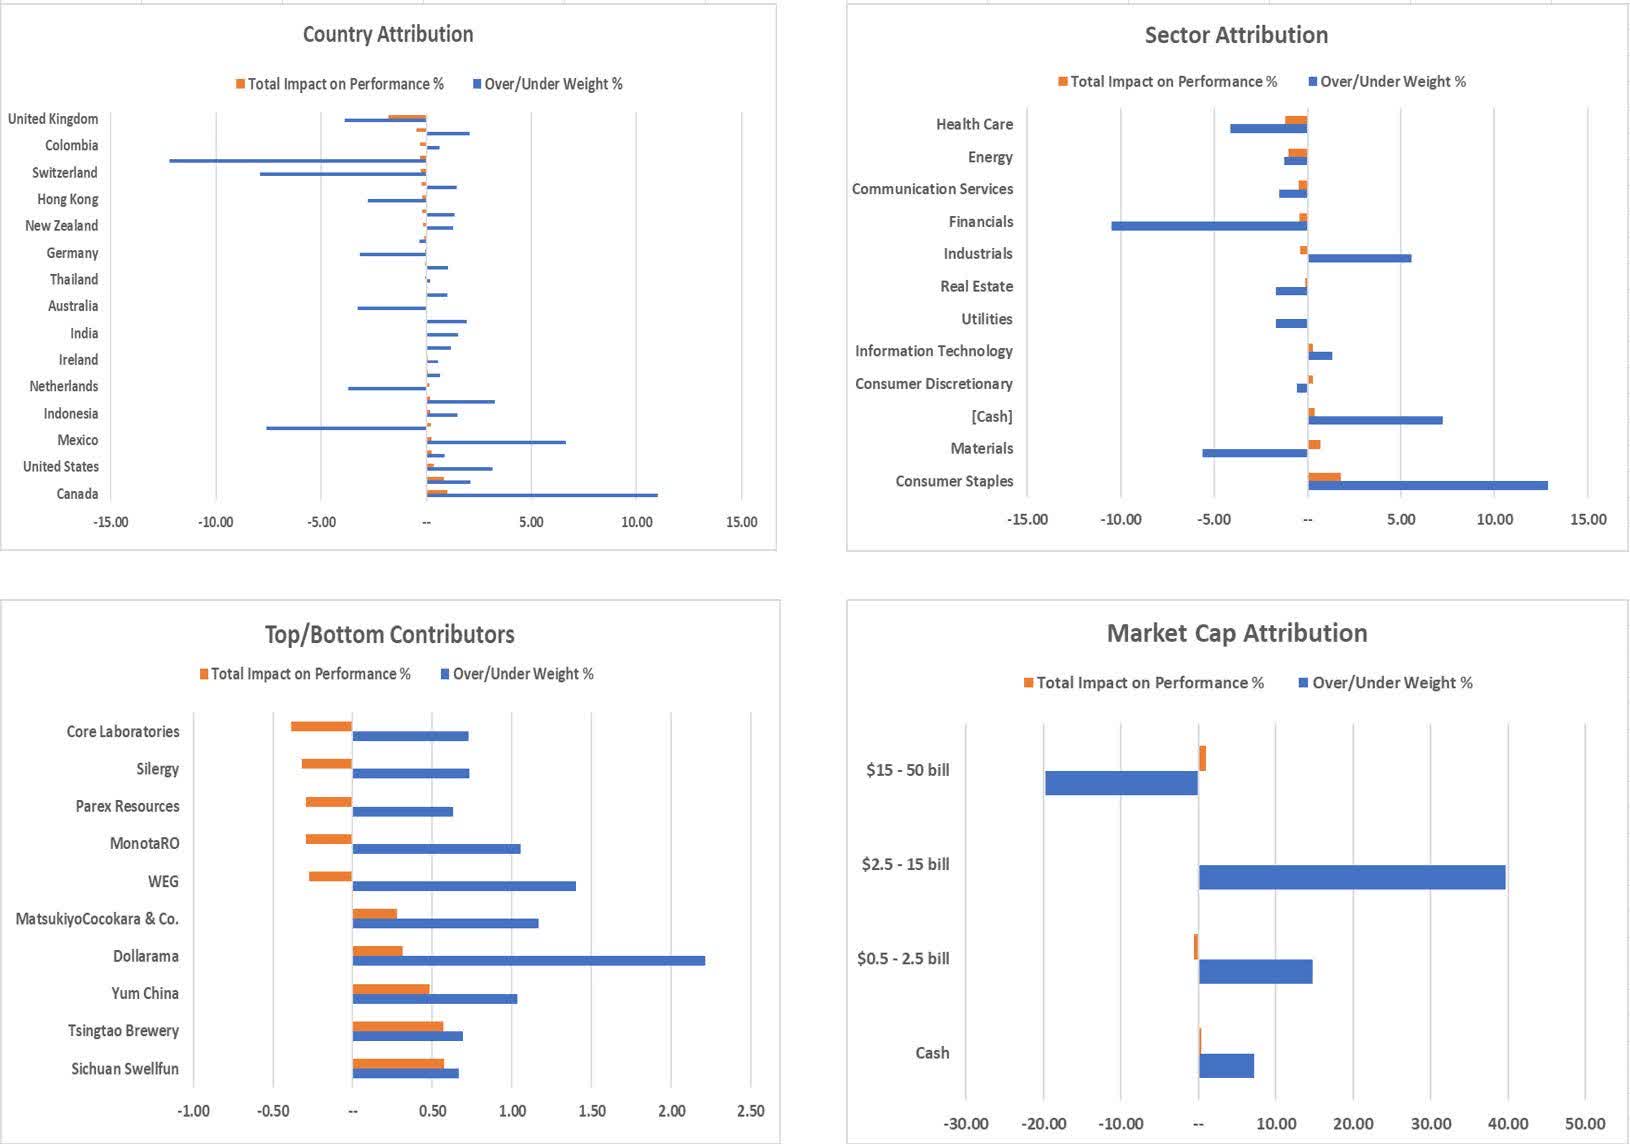
OVERSEAS ATTRIBUTION DASHBOARD 2Q 2022
Rondure Funds Performance as of 06/30/22
|
Rondure New World Fund |
QTR |
YTD |
1 Year |
3 Year |
Since Inception |
|
Institutional |
-8.81% |
-15.40% |
-17.17% |
3.02% |
20.39% |
|
Investor |
-8.82% |
-15.47% |
-17.39% |
2.75% |
18.82% |
|
MSCI Emerging Markets Total Return USD1 |
-11.34% |
-17.47% |
-25.00% |
0.92% |
17.83% |
|
Rondure Overseas Fund |
QTR |
YTD |
1 Year |
3 Year |
Since Inception |
|
Institution |
-14.44% |
-26.01% |
-23.07% |
0.15% |
17.14% |
|
Investor |
-14.55% |
-26.11% |
-23.24% |
-0.11% |
15.69% |
|
MSCI EAFE TR USD2 |
-14.29% |
-19.25% |
-17.33% |
1.54% |
18.05% |
|
Data shows past performance, which is not indicative of future performance. Current performance may be lower or higher than the data quoted. To obtain the most recent performance data available, please visit www.rondureglobal.com. The Advisor may absorb certain Fund expenses, without which total return would have been lower. Investment returns and principal value will fluctuate and shares, when redeemed, may be worth more or less than their original cost. Rondure New World Fund (RNWOX/RNWIX) – Inception date of 05/01/2017. Expense ratios as of prospectus dated 08/31/2021 are: RNWOX: 1.63% Gross / 1.35% Net, RNWIX: 1.32% Gross / 1.10% Net Rondure Overseas Fund (ROSOX/ROSIX) – Inception date of 05/01/201 Expense ratios as of prospectus dated 08/31/2021 are: ROSOX: 2.01% Gross / 1.10% Net, ROSIX: 1.70% Gross / 0.85% Net The Advisor has contractually agreed to waive and/or reimburse fees or expenses through at least August 31, 2022. 1The MSCI Emerging Markets Total Return USD Index is an unmanaged total return index, reported in U.S. Dollars, based on share prices and reinvested dividends of approximately 1,383 companies from 26 emerging market countries. You cannot invest directly in an index. 2The MSCI EAFE Total Return USD Index is an unmanaged total return index, reported in U.S. dollars, based on share prices and reinvested net dividends of approximately 900 companies from 21 developed market countries excluding the US and Canada. You cannot invest directly in an index.
|
Editor’s Note: The summary bullets for this article were chosen by Seeking Alpha editors.
Be the first to comment