


ribeirorocha/iStock via Getty Images
Produced by Jason Appel of Stockwaves
Vale S.A. (NYSE:VALE) is off to a superb start in 2022. Year to date, shares are up 42% as of the March 25 close. This is amidst a pretty broad risk-off environment in stocks in the first quarter of this year.
The steel industry rebounded strongly last year compared to the start of the pandemic. Additionally, with expansions in infrastructure investment, producers of basic materials in particular iron ore are set to benefit. Given their extensive logistical network, VALE has some cost advantages in bringing products to market.
Lastly, considering the current inflationary regime, particularly in commodities and basic materials, producers have good conditions for a very successful year ahead.
Regarding the technical backdrop on VALE:
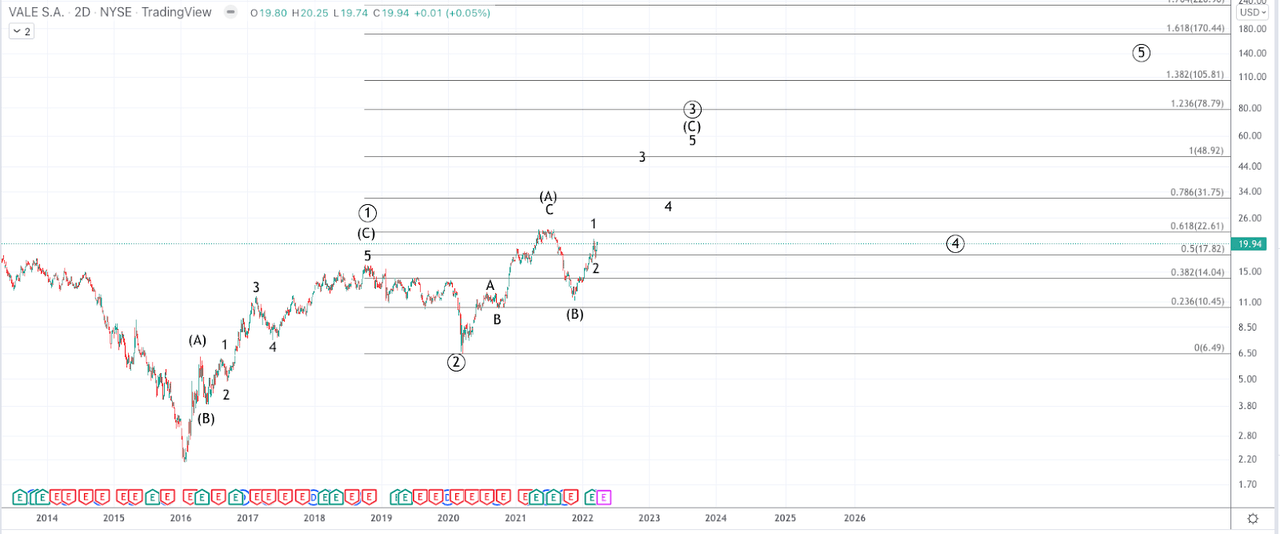
VALE struck a significant long-term low along with the broader equity market in early 2016. Since 2016, shares have appreciated by almost 1,000% into the June 2021 high. The pullback into November found strong support in the low $11s and price has ascended steeply since then, and our expectations are for the highs to be challenged.
Elliott Wave Analysis:
VALE is in the early-middle stages of a Primary wave 3 of an expected large pattern, forming 5 waves from the 2016 low. The initial rally from January 2016 that topped in October 2018 is interpreted as wave 1 and the subsequent corrective pullback into the March 2020 lows, wave 2. Considering the wave 2 came down only to just beneath the 38.2% Fibonacci retrace of wave 1 and price trended strongly higher, easily exceeding the October 2017 peak, we clearly have an uptrend.
The benefit of Elliott Wave Analysis: A simple glance at any trending chart allows any viewer to easily see a trend. That’s easily visible in VALE’s case. However, what’s not known is where price may be within that larger trend. How can one gain any insight into whether price is in the early stages of a bigger move where some risk taking is more warranted vs. the latter stages where becoming risk averse is more beneficial? With Elliott Wave analysis, we have a context with which to view price.
The gold standard of trades offered by Elliott Wave analysis is the 1-2 setup. That means an initial wave 1 and a corrective pullback in wave 2, which successfully maintains support to set up the next move, the wave 3. Wave 3s are observed to typically be the strongest portion of a trend in which price makes its largest gains and does so with greater speed than the other portions of the entire move. Since the waves are fractal in nature, these can be found at all degrees and timeframes.
The pattern on VALE tracks best as a diagonal. This is a 5 wave trending move in which each of the individual waves is composed of 3 waves with particular characteristics.
So after the initial waves 1-2 have completed into the March 2020 low, the move into the June 2021 high is our first wave, (A) of 3. As can be seen on the smaller time frame chart the (A) is itself composed of 3 subwaves: A, B, and C. The C is a 5 wave move at all degrees.
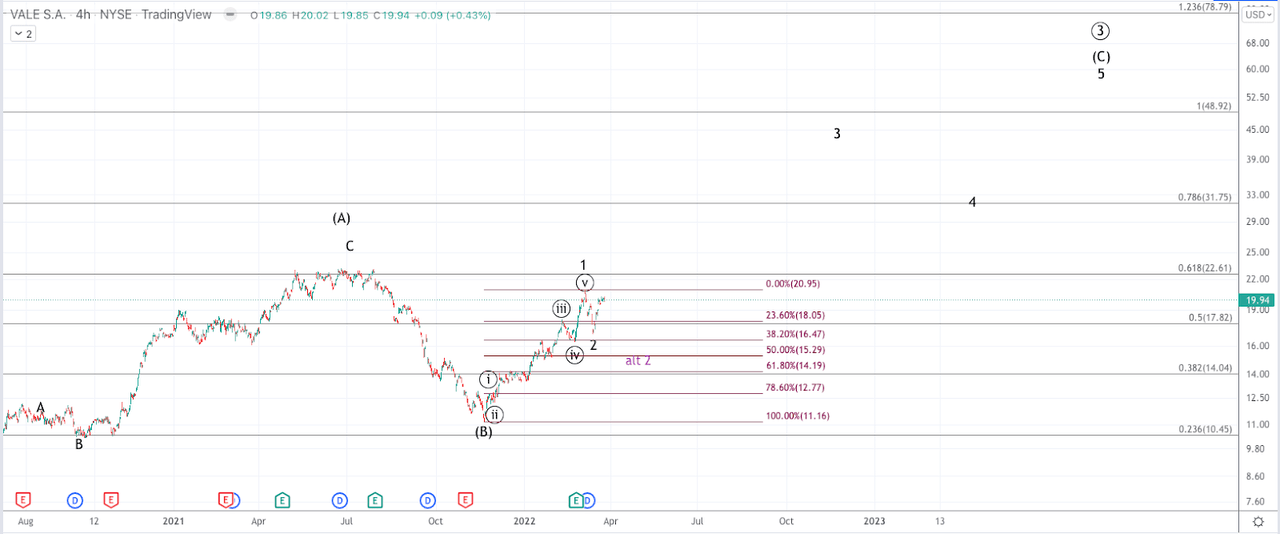
Since the correction into the November 2021 low, price has formed a 5 wave move to the upside indicating a start to wave (C) of 3. (See the attached 4h candlestick chart)
Jason Appel (Stockwaves)
Given a clear 5 wave move since November 2021, our expectations are for the (C) to form as an impulse, which is a strong trending 5 wave move.
With waves 1-2 looking complete, the stage is set for a big breakout in wave 3.
Since the high price printed on 3/7, VALE pulled back sharply into the 3/15 low, but that pullback has been met by strong buyers who have moved price nearly back to the March peak and have done so in 5 waves, thus indicating a high likelihood that the wave 2 of (C) has already completed.
On the basis of that thesis, entries in the coming week with stops below the March low, $16.80 (including after-hours data), offer low-risk long opportunities relative to the movement of this stock.
Should the March low break, it would constitute an invalidation of the most immediate 1-2 setup. However, the larger (C) wave setup ultimately targeting $48+ is intact so long as the November 2021 low is not breached. Below the current March low, the next Fibonacci support level for a deeper wave 2 is the $14.10-$15.30 region.
With our expectation that price appears to be setting up the next portion of the rally targeting the $35+ region over the next few quarters and $48+ in the next 1-3 years, we see a phenomenal risk-to-reward opportunity in VALE.
Jason Appel (Stockwaves)
Be the first to comment