

Richard Bord/Getty Images Entertainment
Rexford Realty (NYSE:REXR) does one thing only, and does it very well. It dominates industrial warehouse space in the lucrative Southern California infill market. That market is worth about as much as the next 5 largest U.S. markets combined.
With 259 properties, comprising about 32 million rentable square feet, Rexford owns about 75% of all the industrial space in the Los Angeles – Long Beach – Anaheim metropolitan statistical area. The current occupancy rate is a near-perfect 99%.
Rexford Realty investor presentation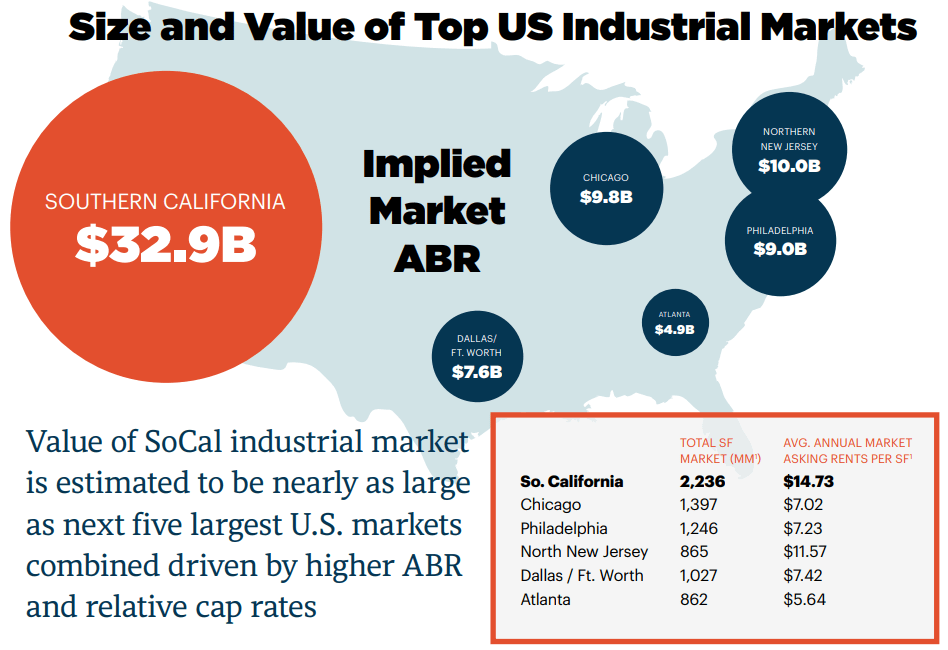
As a result, Rexford is a bona fide FROG (Fast Rate of Growth REIT), with double-digit growth rates in revenues and cash flow unmatched in the Industrial sector. Meanwhile, the highly professional management team maintains a diamond-hard balance sheet.
Rexford Realty investor presentation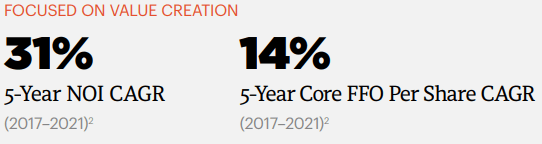
Co-CEO Michael Frankel said it this way in the Q4 earnings call,
Demand continues at an unprecedented level of intensity driven by an exceptionally broad and diverse range of sectors . . . We continue to experience an incurable supply-demand imbalance due to an extremely limited ability to increase in net supply. Consequently, market rent and property values are growing at a substantially higher pace within infill Southern California as compared to all other major markets across the nation.
Co-CEO Howard Schwimmer added:
The lack of availability within our supply constrained infill markets is expected to continue and positions us well to capture strong rent spreads into the foreseeable future.
Overall in 2021, Southern California market rents increased by a stunning 38% over the prior year. Rexford calculates that leases will expire on 4.9 million of their rentable square feet in 2022 (about 15% of the portfolio). The consolidated portfolio-weighted mark-to-market for those expiring leases is now estimated at 48% on a cash basis and 58% on a net effective basis. That is jaw-dropping.
During Q4, Rexford signed approximately 1 million square feet of leases , realizing blended GAAP and cash spreads of about 34% and 22% respectively. The company expects leasing spreads of approximately 40% to persist throughout 2022, with average rent escalators close to 4%.
For the full year 2021, REXR same-property NOI growth exceeded expectations at 9.1% on a GAAP basis and 12.3% on a cash basis. The tenant base is very stable, and REXR had zero bad debt expense for 2021. The company expects bad debt to be 0.35% of revenue in 2022. Last year, the company collected the remainder of all COVID deferrals (about $1 million).
Internal growth prospects for this company are excellent, but external growth also continues apace. Rexford uses a proprietary, research-driven system and deep familiarity with the Southern California market to beat competitors to opportunities. As a result, 86% of their acquisitions in 2021 were acquired through off-market or lightly marketed transactions. Thanks to the lack of competitive bidding for these acquisitions, cap rates came in at about 6%, which is about double what REXR competitors are able to generate.
In the fourth quarter alone, the company completed 19 acquisitions totaling $551 million, including 2 million square feet of buildings and 104 acres of land, at a 5.2% unlevered stabilized yield. For the full year, REXR closed on $1.9 billion worth of investments, and completed nearly 7 million square feet of leasing volume, with enviable average leasing spreads of 43% on a GAAP basis and 29% on a cash basis for the year.
In the first 6 weeks of 2022, Rexford completed $170 million in acquisitions, (predominantly value-add transactions), with an aggregate 3.1% initial yield, expected to earn a combined 4.9% stabilized unlevered yield when all is said and done. Since the February earnings report, the company has added another $126 million in acquisitions in Long Beach, Santa Clarita, and Glassell Park.
In 2021, the company also stabilized six properties representing over $200 million of total investment at a combined unlevered stabilized yield of 6.6%. Rexford currently has over 3 million square feet of value add and redevelopment projects, representing an additional investment of $380 million, expected to deliver an aggregate return of about 6.6%, generating more than $1 billion in estimated value creation.
As for dispositions, in 2021 REXR opportunistically recycled five properties totaling $59.3 million, generating a combined 26.5% unlevered rate of return.
For 2022, management is estimating an expense growth of about 12% (primarily insurance, taxes, and overhead allocation) offsetting same property NOI by about 110 basis points. Increases in insurance and taxes can be passed through to customers, but overhead allocation cannot.
Q4 results were spectacular. Same property NOI growth came in at 10% on a GAAP basis and 6.8% on a cash basis. Consolidated NOI grew by 38%, which drove a 24% increase in FFO per share for the full year, to $1.64 per share . Fourth quarter core FFO per share increased by 32%, to $0.45 per share..
Growth metrics
Rexford boasts 5-year average annual FFO per share growth of 14%, consolidated NOI growth of 31%, dividend growth of 18%, and share price Gain of 29%, all of which continue to lead not only the industrial sector, and place REXR in the top 5 in all of REITdom.
Rexford Realty investor presentation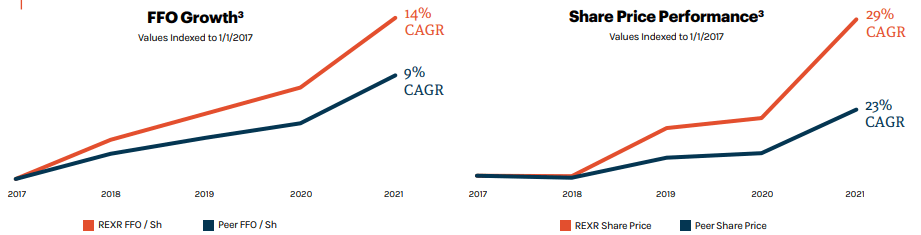
The core FFO guidance range for 2022 is $1.77 to $1.81 per share, representing 9% earnings growth at the midpoint.
| Metric | 2017 | 2018 | 2019 | 2020 | 2021 | 4-yr CAGR |
| FFO (millions) | $77.0 | $109.9 | $146.6 | $182.5 | $253.6 | — |
| FFO growth | — | 42.7% | 33.4% | 24.5% | 39.0% | 34.7% |
| TCO (millions) | $77 | $103 | $140 | $183 | $231 | |
| TCO growth | — | 33.8% | 35.9% | 30.7% | 26.2% | 31.6% |
| Share price Dec. 31 | $29.16 | $29.47 | $45.67 | $49.11 | $81.11 | — |
| Price gain | — | 1.1% | 55.0% | 7.5% | 65.2% | 29.1% |
| Dividend | $0.57 | $0.63 | $0.72 | $0.83 | $0.96 | — |
| Dividend growth | — | 10.5% | 14.3% | 15.3% | 15.7% | 13.9% |
| Market Cap (billions) | 2.26 | 2.85 | 5.19 | 6.41 | 10.51 | — |
| Market Cap growth | — | 26.1% | 82.1% | 23.5% | 64.0% | 47.0% |
Source: TD Ameritrade, MarketWatch, CompaniesMarketCap.com and author’s calculations.
These are utterly spectacular numbers, with revenue and cash flow increasing by 30% per year, and share price growth at 29%. This company posted positive growth in all respects, even during the pandemic. Investors who bought shares at the beginning of 2018 were sitting on annual returns of about 31% at the start of this year.
Balance sheet metrics
Rexford’s net debt to EBITDA is 3.6x, providing plenty of muscle for further acquisition and redevelopment. At year’s end, Rexford’s liquidity was approximately $880 million. With its extremely low debt ratio, extremely high liquidity ratio, and investment-grade bond rating, few REITs have better balance sheets than REXR.
| Company | Liquidity Ratio | Debt Ratio | Debt/EBITDA | Bond Rating |
| REXR | 3.40 | 9% | 4.9 | BBB |
Source: TD Ameritrade and Hoya Capital Income Builder
Dividend metrics
| Company | Div. Yield | Div. Growth | Div. Score | Payout Ratio | Div. Safety |
| REXR | 1.74% | 19.4% | 2.48 | 66% | A |
Source: Hoya Capital Income Builder and author’s calculations
Industrial REITs pay a below-average Yield of 2.16% as a sector, and REXR is the lowest-yielding of all those companies at 1.74%. However, it also sports the highest dividend growth rate at 19.4%, and recently increased the dividend by a whopping 31%.
Shares bought 3 years ago are yielding 3.69% on cost, which is above the REIT average, and the dividend score is only a little shy of the sector average at 2.48%. (Dividend Score projects the Yield 3 years from now, if the dividend growth rate remains unchanged.)
If anything, the dividend is too safe. Sure, this helps Rexford with external acquisitions, but I would like to see the company share more of its extraordinary earnings with shareholders (especially since I am one).
Valuation metrics
The Price/FFO for REXR appears high at 40.0. Is it overpriced? If so, it should underperform the market.
A look at the history of this company will show that despite its “expensive” valuation, it has consistently beaten the market by a wide margin.
| Metric | 2018 | 2019 | 2020 |
| REXR FFO/share | $1.12 | $1.23 | $1.32 |
| REXR Price Dec. 31 | $29.47 | $45.67 | $49.11 |
| REXR Price/FFO Dec. 31 | 26.3 | 37.1 | 37.2 |
| REXR Price gain following year | 55.0% | 7.5% | 65.2% |
| REXR Dividend Yield following year | 2.5% | 1.9% | 2.0% |
| Total return following year | 57.5% | 9.4% | 67.2% |
| VNQ price gain following year | 24.43% | 3.59% | 3.17% |
| VNQ dividend Yield following yr | 3.65% | (-8.47)% | 36.59% |
| VNQ Total return following yr | 28.08 | (-4.88)% | 39.77% |
Source: Hoya Capital Income Builder, Market Watch
From the red line in the table above, we can see that REXR began each of the last 3 years with “expensive” Price/FFO ratios of 26.3, 37.1, and 37.2, respectively. Yet, comparing the yellow lines, we see that REXR has scorched the market, as represented by the Vanguard Real Estate ETF (VNQ), in each of the past 3 years, by huge margins. So Rexford was underpriced at those seemingly lofty valuations, and thanks to the recent sell-off, REXR’s Price/FFO is right in line with the past two years.
| Company | Div. Yield | Div. Growth | Div. Score | Price/FFO | Premium to NAV |
| REXR | 1.74% | 19.4% | 2.48% | 40.0 | 17.0% |
REXR trades at a 17.0% premium to NAV (net asset value), allowing the company to issue shares accretively.
What could go wrong?
REXR has two CEOs. For now, they seem to be working harmoniously in tandem. However, if they ever had a sharp divergence of vision for the direction of the company, the effects would be felt throughout the organization.
Rexford is subject to the same risks as all other supply chain REITs, including blackouts, telecommunication failures, natural disasters, terrorism, war, cyber security attacks, computer viruses, computer hacking, malware or other malicious codes, acts of vandalism or theft, employee error or malfeasance, phishing, or other unauthorized access.
The Southern California market is crowded with competitors. Duke Realty (DRE) has been working for years to increase its presence there, but does not compete directly with Rexford, as Duke tends to grow by building new facilities, whereas Rexford focuses on acquiring infill locations. Nevertheless, Duke’s construction activity increases supply and tends to hold down rent increases. Terreno Realty (TRNO) also specializes in infill, but has been thriving side by side with Rexford for 8 years, and that is likely to continue. In any case, Rexford’s footprint in SoCal dwarfs that of other industrial REITs.
Investor’s bottom line
Rexford enjoys pricing power like no other REIT. Thanks to a shortage of warehouse space nationwide, and strong demand from e-commerce, which is expected to double by 2025, Industrials are among the 7 REIT sectors likely to outperform in 2022. For the long term investor, Rexford Realty is a Strong Buy as far as I’m concerned.
Rexford Realty investor presentation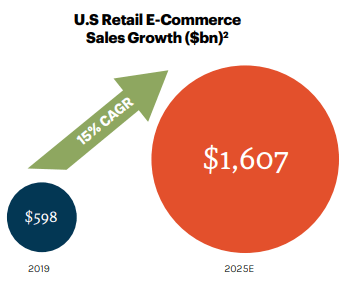
The Seeking Alpha Quant ratings predictably rate REXR as a Hold, hating its valuation. But 7 out of 8 of the Wall Street analysts show it as a Strong Buy. Zacks shows it as a Buy, as do The Street and Ford Equity Research. Wells Fargo rates it Overweight, with a price target of $81, implying 11.7% upside.
Be the first to comment