

Andreyuu/iStock via Getty Images
Background
For those who are interested in John and Jane’s full background, please click the following link here for the last time I published their full story. The details below are updated for 2022.
- This is a real portfolio with actual shares being traded.
- I am not a financial advisor and merely provide guidance based on a relationship that goes back several years.
- John retired in January 2018 and now only collects Social Security income as his regular source of income.
- Jane officially retired at the beginning of 2021, and she is collecting Social Security as her only regular source of income.
- John and Jane have decided to start taking draws from the Taxable Account and John’s Traditional IRA to the tune of $1,000/month each. These draws are currently covered in full by the dividends generated in each account.
- John and Jane have other investments outside of what I manage. These investments primarily consist of minimal-risk bonds and low-yield certificates.
- John and Jane have no debt and no monthly payments other than basic recurring bills such as water, power, property taxes, etc.
I started helping John and Jane with their retirement accounts because I was infuriated by the fees their previous financial advisor was charging them. I do not charge John and Jane for anything that I do, and all I have asked of them is that they allow me to write about their portfolio anonymously in order to help spread knowledge and to make me a better investor in the process.
Generating a stable and growing dividend income is the primary focus of this portfolio, and capital appreciation is the least important characteristic. My primary goal was to give John and Jane as much certainty in their retirement as I possibly can because this has been a constant point of stress over the last decade.
Dividend Decreases
No stocks in Jane’s Traditional or Roth IRA paid a decreased dividend during the month of May.
Dividend And Distribution Increases
One company paid increased dividends/distributions or a special dividend during the month of April in the Traditional and Roth IRAs.
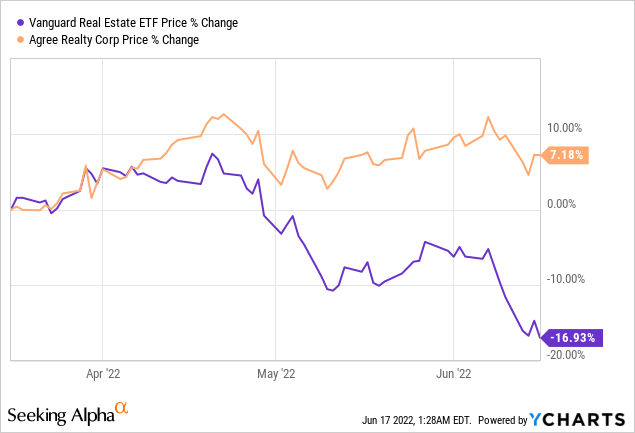
Agree Realty – REITs as a whole have not been spared from the recent market downturn that has pushed the Fed to raise the federal funds rate by a staggering 75 basis points. Even more impressive, ADC has seen its share price recover over the last three months while popular ETFs like Vanguard Real Estate Fund (VNQ) have performed terribly. Part of the benefit of ADC is the ability to combat inflation in the short and medium-term by updating leases and contracts with escalators that will allow them to keep raising the dividend. The dividend growth rate in the last three years is approximately 7.20% which compares to the 10-year growth rate of 5.36%. This implies that the dividend is growing at a faster pace in more recent years, which is a positive indication of the direction ADC is going. ADC will also benefit from its recent public offering of 5 million shares – raising capital now will help because any deals that require the use of debt will now be more expensive and could potentially impact whether or not ADC engages in the transaction altogether.
I still maintain ADC a Buy on shares when they are below $65/share and a Strong Buy at $60/share. ADC is one stock that we would consider accumulating more of in this market.
The dividend was increased from $.227/share per quarter to $.234/share per quarter. This represents an increase of 3.1% and a new full-year payout of $2.808/share compared with the previous $2.724/share. This results in a current yield of 4.08% based on the current share price of $68.68.
Retirement Account Positions
There are currently 38 different positions in Jane’s Traditional IRA and 23 different positions in Jane’s Roth IRA. While this may seem like a lot, it is important to remember that many of these stocks cross over in both accounts and are also held in the Taxable Portfolio.
Below is a list of the trades that took place in the Traditional IRA during the month of May.
Traditional IRA – May – Trades (Charles Schwab)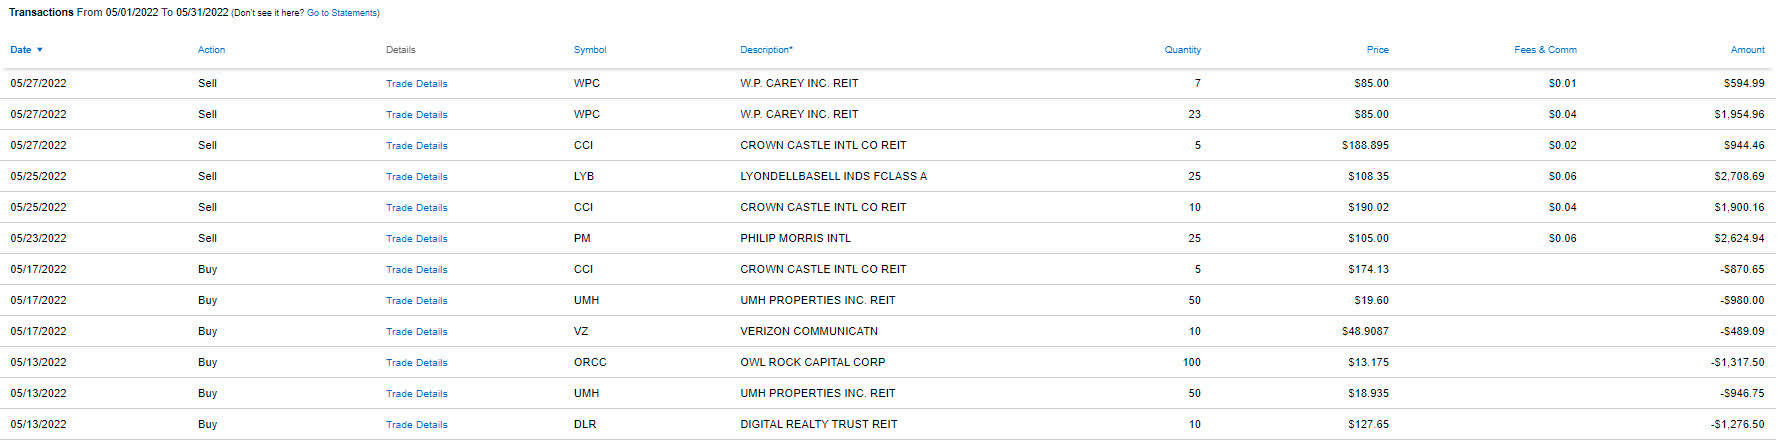
Below is a list of the trades that took place in the Roth IRA during the month of May.
Roth IRA – May – Trades (Charles Schwab)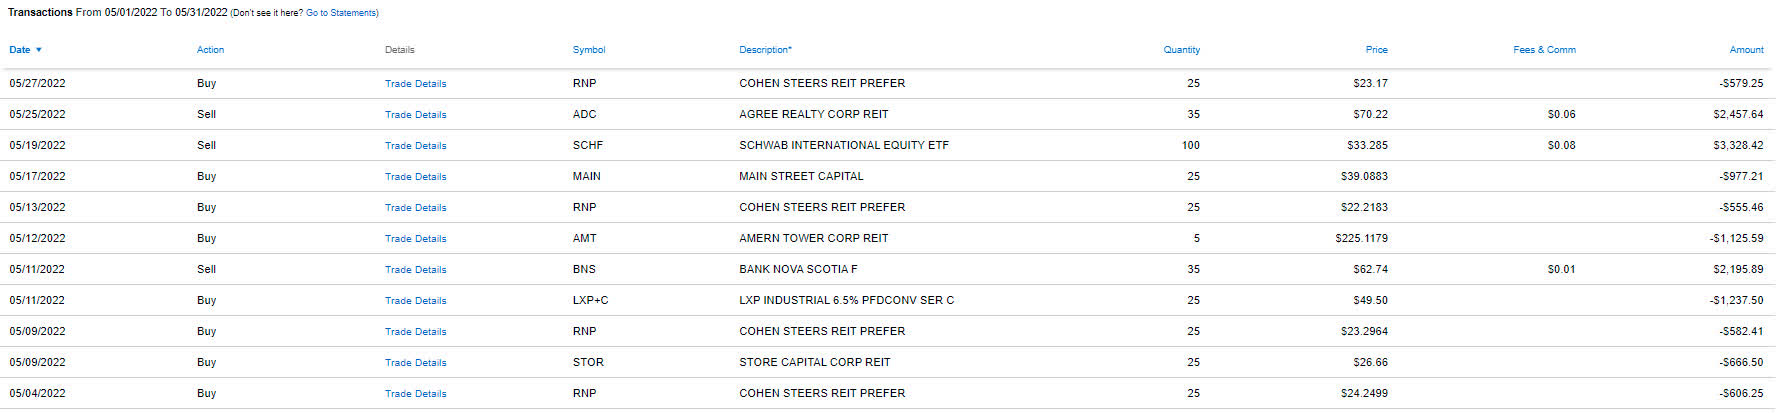
There was a significant amount of activity in Jane’s retirement accounts due to the fact that one position was initiated and multiple positions reached price targets where we were justified in eliminating high-cost shares to replenish cash reserves. On the other hand, several stocks were available at 52-week-lows that justified adding additional shares (further increasing the size of the position that is focused on low-cost shares). I won’t cover every transaction that took place, but I will highlight some of the more important ones.
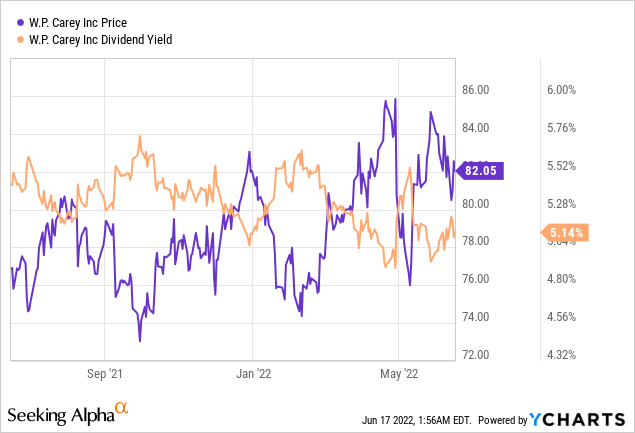
W. P. Carey (WPC) – Back in early May, we set a limit trade to sell a small portion of Jane’s position in WPC that would expire in 60 days if a price target of $85/share was not hit. I find that WPC pushes this price target every so often and it’s a strong indicator that shares have reached their peak. Selling some of the positions of these levels for extra cash on hand is a prudent thing to do.
Crown Castle (CCI) – We sold a small portion of higher-cost shares (ironically, we repurchased these shares in the month of June now that the stock price is pushing its 52-week low. Selling these shares was only because we saw the price was moving lower and allowed us to achieve a lower cost basis.
Philip Morris (PM) – We set a limit trade at $105/share to last for 60 days. Typically, when PM hits this level, shares are fully valued (regardless of what investors think about the Swedish Match (OTCPK:SWMAY) acquisition). We have been using the $105 level to sell small parts of the PM position and then repurchasing shares typically under $95/share.
Owl Rock Capital (ORCC) – Established a position in the BDC. If you are interested to know more about this investment, please check out my article Owl Rock Capital – Build A Position Before Q3 2022 For Maximum Upside for a deeper dive into why we added this to Jane’s portfolio.
Agree Realty – We sold some of the high-cost position at $70/share and would be willing to reinvest these funds into more shares if the price were to drop into the low $60/share range.
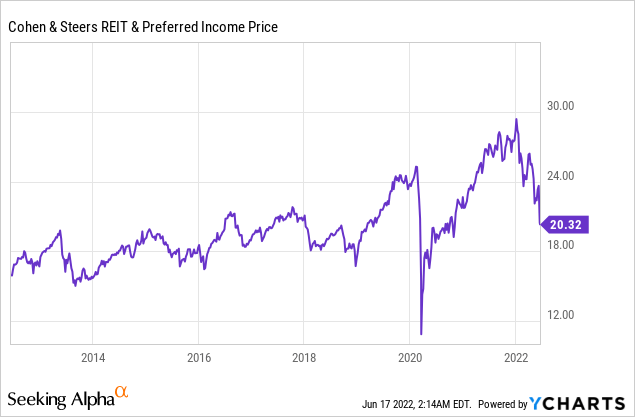
Cohen & Steers REIT & Preferred Income Fund (RNP) – Shares continue to drop and we continue to buy. This is a quality REIT fund and holds many exceptional REITs that offer a great level of diversification. Shares are as attractive now and $18/share has served as a strong support point (with the exception of COVID).
May Income Tracker – 2021 Vs. 2022
Income for the month of May was up significantly year-over-year for Jane’s Traditional IRA and down slightly for the Roth IRA. The average monthly income for the Traditional IRA in 2022 is expected to be up about 5.3% based on current estimates and the Roth IRA is looking to grow by 4.7%. This means the Traditional IRA would generate an average monthly income of $1,459.92/month and the Roth IRA would generate an average income of $620.58/month. This compares with 2021 figures that were $1,386.13 and $592.61, respectively.
SNLH = Stocks No Longer Held – Dividends in this row represent the dividends collected on stocks that are no longer held in that portfolio. We still count the dividend income that comes from stocks no longer held in the portfolio even though it is non-recurring.
All images below come from Consistent Dividend Investor, LLC. (Abbreviated to CDI).
Traditional IRA – 2021 V 2022 – May Dividends (CDI)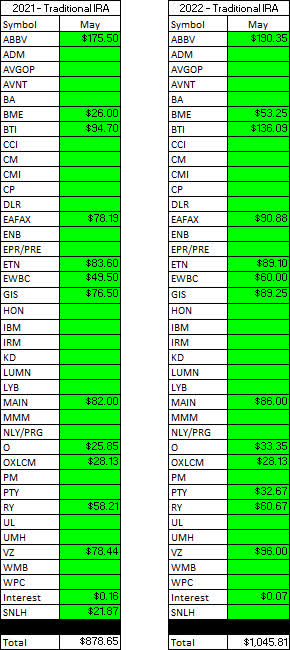
Roth IRA – 2021 V 2022 – May Dividends (CDI)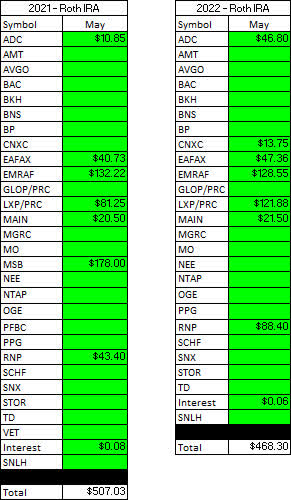
Here is a graphical illustration of the dividends received on a monthly basis for the Traditional and Roth IRAs.
Retirement Projections – 2022 – May – Monthly Dividends (Bar Graph) (CDI)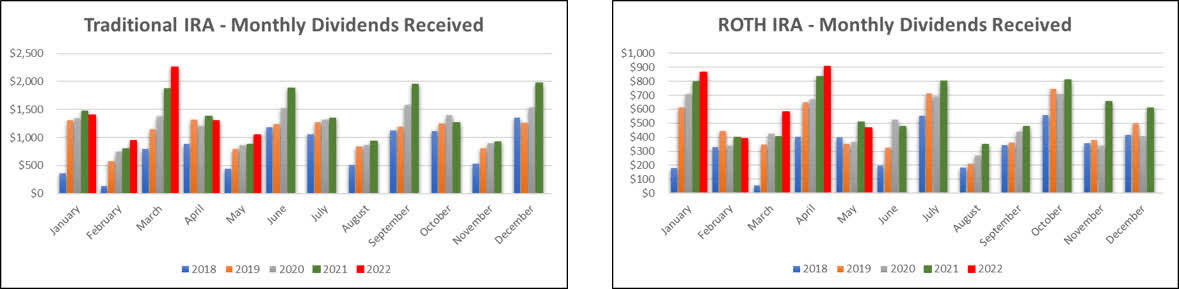
The table below represents the actual full-year results for 2022 and the prior year.
Retirement Projections – 2022 – May (CDI)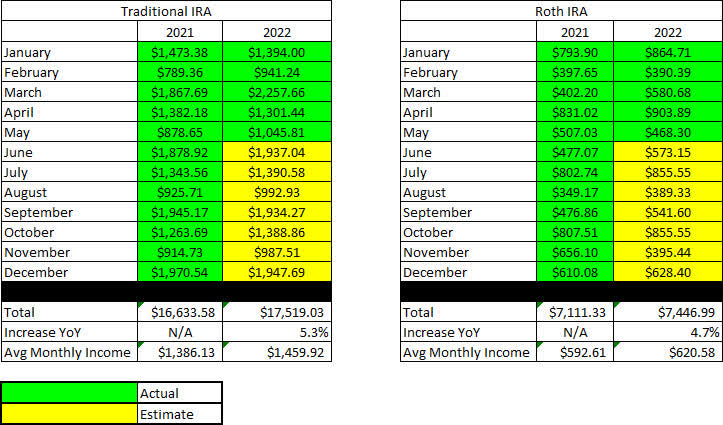
Below is an expanded table that shows the full dividend history since inception for both the Traditional IRA and Roth IRA.
Retirement Projections – 2022 – May – 5 YR History (CDI)
I have included line graphs that better represent the trends associated with Jane’s monthly dividend income generated by her retirement accounts. The images below represent the Traditional IRA and Roth IRA, respectively.
Retirement Projections – 2022 – May – Monthly Dividends (CDI)
Here is a table to show how the account balances stack up year over year (I previously used a graph but believe the table is more informative).
It is worth noting that with John and Jane Retired, there will be no additional contributions to these accounts. In fact, they have already begun to take regular distributions from the Taxable Account and John’s Traditional IRA.
Retirement Account Balances – 2022 – May (CDI)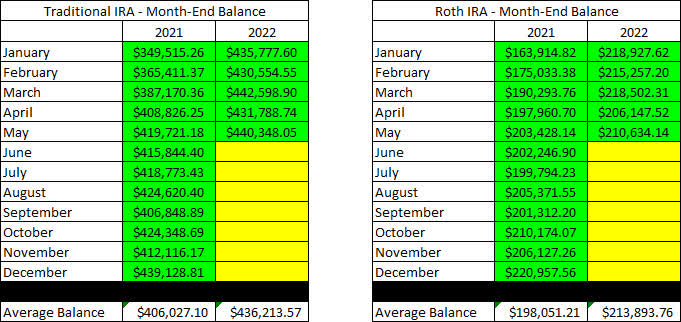
The next images are the tables that indicate how much cash Jane had in her Traditional and Roth IRA Accounts at the end of the month as indicated on their Charles Schwab statements.
Retirement Projections – 2022 – May – Cash Balances (CDI)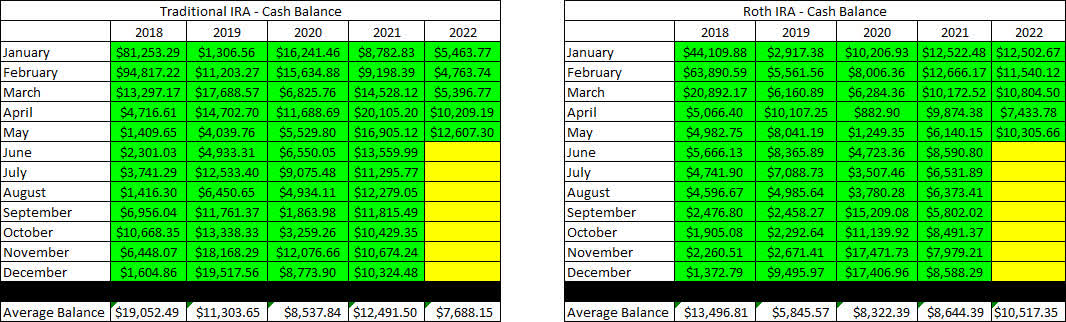
The next image provides a history of the unrealized gain/loss at the end of each month in the Traditional and Roth IRAs going back to the beginning in January of 2018.
Retirement Projections – 2022 – May – Unrealized Gain-Loss (CDI)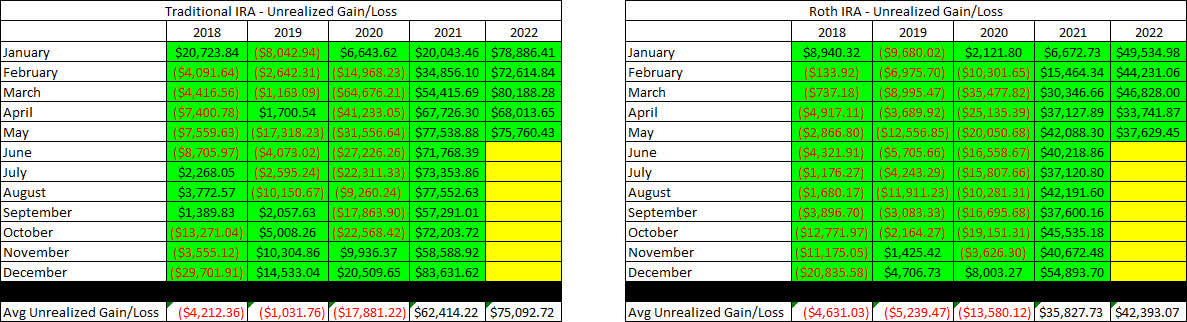
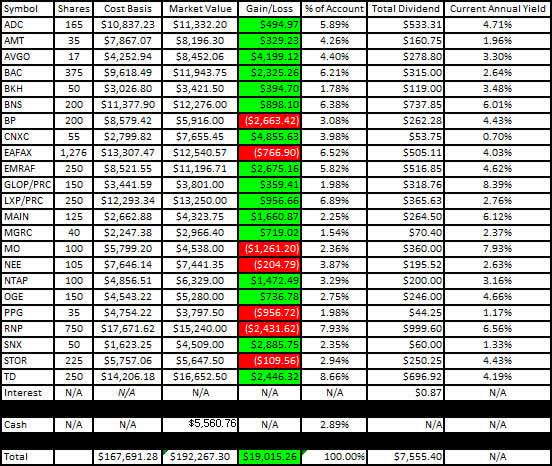
I like to show readers the actual unrealized gain/loss associated with each position in the portfolio because it is important to consider that in order to become a proper dividend investor, it is necessary to learn how to live with volatility. The market value and cost basis below are accurate at the market close on June 16th.
Here is the unrealized gain/loss associated with Jane’s Traditional and Roth IRAs.
Traditional IRA – 2022 – May – Gain-Loss (CDI) Roth IRA – 2022 – May – Gain-Loss (CDI)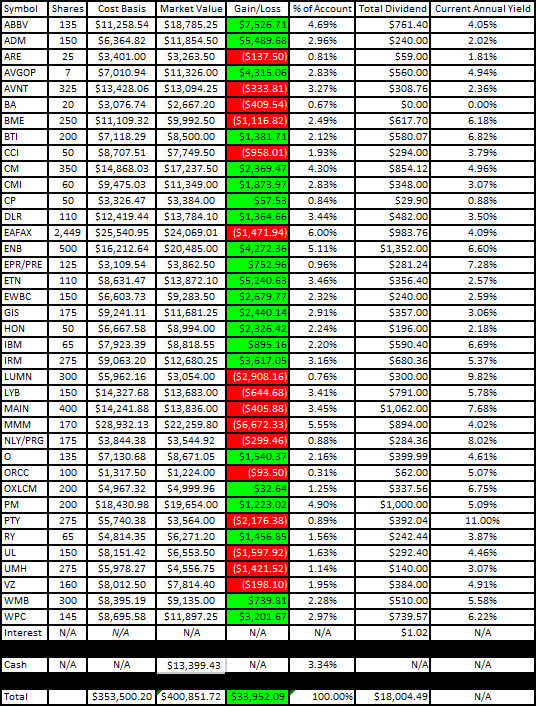
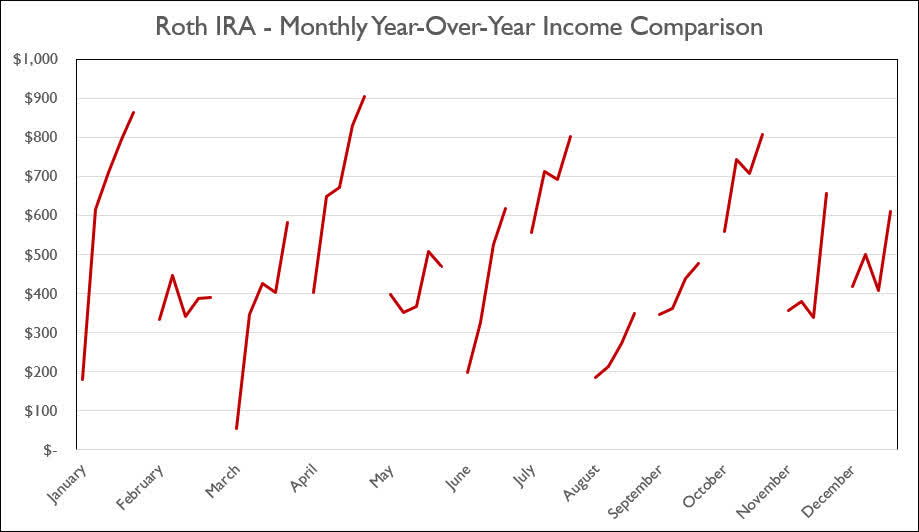
The last two graphs show how dividend income has increased, stayed the same, or decreased in each respective month on an annualized basis. I believe that the graph will continue to become more valuable as more years of data become available (with the fifth year of data being added, we can really see the trajectory of the income change for each month).
Traditional IRA – 2022 – May – Monthly Year-Over-Year Comparison (CDI) Roth IRA – 2022 – May – Monthly Year-Over-Year Comparison (CDI)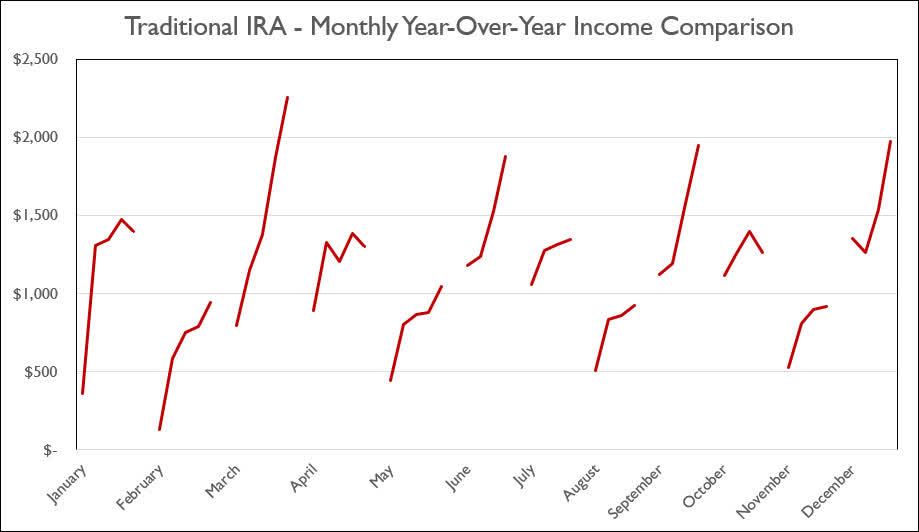
Conclusion
We have made it through the halfway point in June and there is no denying that the market has been an absolute bloodbath. Some of this has been in anticipation of the Fed’s increase and some of this can also be attributed to the fact that the increase was the largest seen since 1994.
In Jane’s portfolio, we expect to see unrealized gains drop significantly (more than cut in half from where they were at the end of May) along with account balances in a similar fashion. At the same time, we do not see any concerns about the dividend payouts associated with each position and will continue to reduce exposure and add to existing positions when it makes sense.
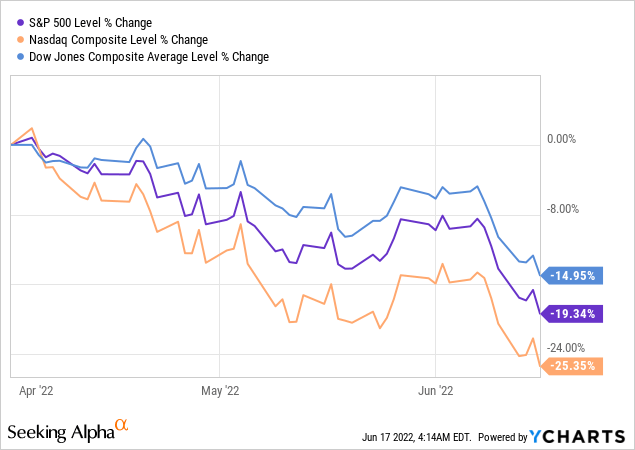
Looking at the image above is an important reminder of why we focus on dividend-paying stocks for John and Jane’s portfolios. If John and Jane were required to sell shares in order to fund their next retirement distribution, we reduce and serious hesitancy to liquidate an asset that is dropped 15, 20, or 25% (which is exactly what the three main indexes show have happened since April 1, 2022). Instead, we are able to liquidate shares anytime but for much more practical reasons such as reducing the number of high-cost shares and reallocating that cash to undervalued shares when the time makes sense.
At the same time, the dividends continue to do the work that is needed to make John and Jane comfortable in their retirement.
May Articles
I have provided the link to the May 2022 Taxable Account below.
The Retirees’ Dividend Portfolio: John And Jane’s May Taxable Account Update
In Jane’s Traditional and Roth IRAs, she is currently long the following mentioned in this article: AbbVie (NYSE:ABBV), Agree Realty (NYSE:ADC), Archer-Daniels-Midland (NYSE:ADM), Broadcom (NASDAQ:AVGO), Avient (NYSE:AVNT), Broadcom Preferred Series A (NASDAQ:AVGOP), Boeing (NYSE:BA), Bank of America (NYSE:BAC), Black Hills Corp. (NYSE:BKH), BlackRock Health Sciences Trust (NYSE:BME), Bank of Montreal (NYSE:BMO), Bank of Nova Scotia (NYSE:BNS), BP (NYSE:BP), British American Tobacco (NYSE:BTI), Canadian Imperial Bank of Commerce (NYSE:CM), Cummins (NYSE:CMI), Concentrix (NASDAQ:CNXC), Digital Realty (NYSE:DLR), Eaton Vance Floating-Rate Advantage Fund A (MUTF:EAFAX), Enbridge (NYSE:ENB), EPR Properties Preferred Series E (NYSE:EPR.PE), Eaton Corporation (NYSE:ETN), Emera Inc. (OTCPK:EMRAF), East West Bancorp (NASDAQ:EWBC), General Mills (NYSE:GIS), GasLog Partners Preferred C (NYSE:GLOP.PC), Honeywell (NASDAQ:HON), International Business Machines (NYSE:IBM), Iron Mountain (NYSE:IRM), Lexington Realty Preferred Series C (NYSE:LXP.PC), Lumen Technologies (NYSE:LUMN), LyondellBasell (NYSE:LYB), Main Street Capital (NYSE:MAIN), McGrath RentCorp (NASDAQ:MGRC), 3M (NYSE:MMM), Altria (NYSE:MO), Annaly Capital Preferred Series G (NYSE:NLY.PG), NextEra Energy (NYSE:NEE), NetApp (NASDAQ:NTAP), Realty Income (NYSE:O), OGE Energy Corp. (NYSE:OGE), Oxford Lane Capital Corp. 6.75% Cum Red Pdf Shares Series 2024 (NASDAQ:OXLCM), Philip Morris (NYSE:PM), PPG Industries (NYSE:PPG), PIMCO Corporate & Income Opportunity Fund (PTY), Cohen & Steers REIT & Preferred Income Fund (NYSE:RNP), Royal Bank of Canada (NYSE:RY), TD SYNNEX Corp. (NYSE:SNX), STORE Capital (NYSE:STOR), Toronto-Dominion Bank (NYSE:TD), Unilever (NYSE:UL), UMH Properties (UMH), Verizon (NYSE:VZ), Williams Companies (NYSE:WMB), W. P. Carey (NYSE:WPC).
Be the first to comment