

ryasick/E+ via Getty Images
Background
For those interested in John and Jane’s full background, please click the following link for the last time I published their full story. Here are the key details about John and Jane that readers should understand.
- This is a real portfolio with actual shares being traded.
- I am not a financial advisor and merely provide guidance based on a relationship that goes back several years.
- John retired in January 2018 and his only consistent source of income is Social Security.
- John has begun drawing $1,000/month from his Traditional IRA to supplement his retirement income.
- Jane officially decided to retire on December 31, 2020. She is now collecting social security as her primary source of income.
- John and Jane have other investments outside of what I manage. These investments primarily consist of minimal risk and minimal yield certificates.
- John and Jane have no debt and no monthly payments other than basic recurring bills such as water, power, property taxes, etc.
John and Jane requested my help after we discovered that their financial advisor was charging excessive fees and engaging in trades that appeared to be more favorable to the advisor than it was to John and Jane. I do not charge John and Jane for anything that I do and all I have asked of them is that they allow me to write about their portfolio anonymously to help spread knowledge and to make me a better investor in the process.
Generating a stable and growing dividend income is the primary focus of this portfolio, and capital appreciation is a secondary characteristic.
Dividend Decreases
This month represents the first time AT&T (T) has decreased its dividend payment in over 36 years.
I covered the write-up of AT&T in the Taxable Account article (link at the end of this article). Below is a summary of the decrease.
The dividend was decreased from $.52/share per quarter to $.2775/share per quarter. This represents a decrease of 46.6% and a new full-year payout of $1.11/share compared with the previous $2.08/share. This results in a current yield of 5.73% based on the current share price of $19.96.
Dividend And Distribution Increases
Two companies increased their dividend/distribution or paid a special dividend during the month of May in the Traditional and Roth IRAs.
General Dynamics – GD is one of the biggest names in the dividend investor world and they have delivered high single-digit annual increases for quite some time now (currently the 10-year average dividend growth rate comes in at a respectable 9.66%). We saw the stock price take-off during the initial phase of the Ukraine/Russia conflict but the price has moderated since then. We ended up selling roughly half of the position to eliminate the highest cost portion of the position. GD has seen its dividend yield fluctuate considerably over the last several years ranging between 1.75% and 4% yield. We are going to be a little cautious about purchasing additional shares because we believe the value is currently inflated by Ukraine/Russia conflict. When GD’s dividend yield is between 2.5% and 3% that is the sweet spot where adding shares makes a lot of sense.
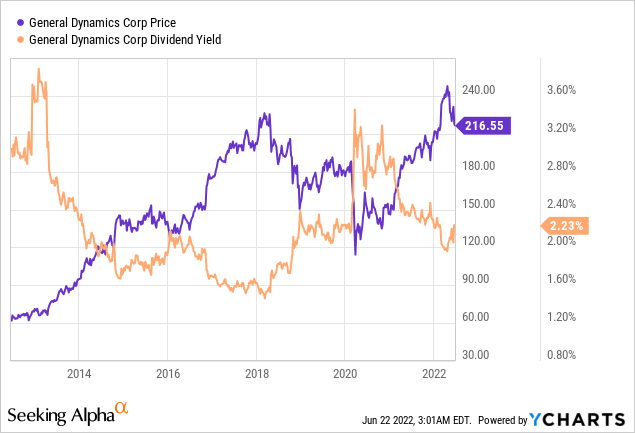
The dividend was increased from $1.19/share per quarter to $1.26/share per quarter. This represents an increase of 5.9% and a new full-year payout of $5.04/share compared with the previous $4.76/share. This results in a current yield of 2.33% based on the current share price of $216.55.
Kinder Morgan – For some investors who owned KMI stock prior to 2016 they will never be able to shake the extreme destruction of value that cut their investment into 25% of its previous value. These investors are likely to never invest in KMI again regardless of how fundamentals improved due to the PTSD of previous events. The reality is that KMI has focused on addressing many of the problems that caused the share price to collapse and the dividend to be reduced significantly. The chart below shows that KMI’s debt load has been reduced by nearly 1/3 ($12billion over a six-year term) while offering a sustainable dividend yield above 6%. The recent spike in energy prices is a stark reminder that we are nowhere near having the capability to meet our energy needs from “clean” energy sources. Infrastructure companies like KMI will continue to benefit in the future as long as the demand is there for its products. KMI currently offers a yield over 6.5% which makes the stock a Strong Buy.
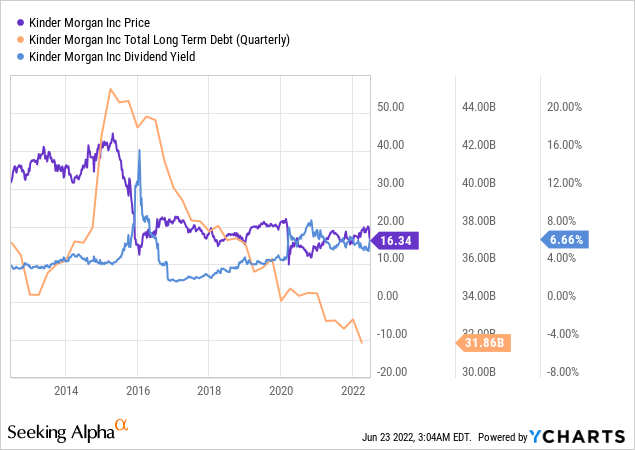
The dividend was increased from $.27/share per quarter to $.2775/share per quarter. This represents an increase of 2.8% and a new full-year payout of $1.11/share compared with the previous $1.08/share. This results in a current yield of 6.79% based on the current share price of $16.34.
Retirement Account Positions
There are currently 39 different positions in John’s Traditional IRA and 21 different positions in his Roth IRA. While this may seem like a lot, it is important to remember that many of these stocks cross over in both accounts and are also held in the Taxable Portfolio.
Below is a list of the trades that took place in the Traditional IRA during the month of May.
Traditional IRA – May Trades (Charles Schwab)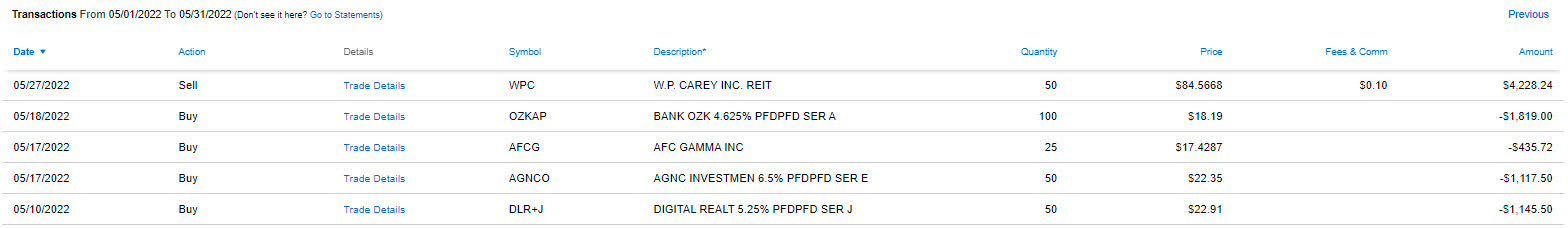
There were no trades made in the Roth IRA during the month of May.
We have taken the opportunity to sell certain positions (typically focusing on high-cost shares and stocks that have reached major resistance points) to strengthen the cash position in both the Traditional IRA and Roth IRA (I know there weren’t any transactions in the Roth IRA but there are been a few during the month of June). At the same time, with you some of the proceeds to purchase preferred shares at a steep discount to the redemption value thus locking in an above-average and better-protected yield when compared to the dividend yield offered by common shares.
Bank OZK Preferred Series A (OZKAP) is unique in the sense that it is currently selling at a nearly 30% discount and yields close to 6.5%. For the 100 shares that were purchased we not only locked in a strong yield but now have the potential to see capital appreciation of $5.81/share if redeemed by 2026. This is a significant benefit considering the total amount of dividends collected in the next 4 years (call date of November 2026) is approximately $4.64/share. If we add the $5.81 and $4.64 together for a total benefit of $10.45/share. If we average this out over the estimated four years we hold the investment this would return $2.61/share per year or a true cumulative yield of 14.3%.
A similar but much less stark example is shares of Digital Realty (DLR) Preferred Series J (DLR.PJ). We added to the existing position by 50 shares that have already seen modest share price improvement. These shares won’t offer the kind of return OZKAP will but it is a great place to park money for a reliable income.
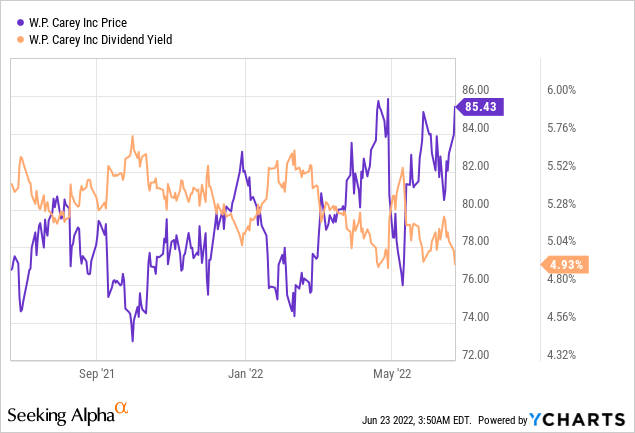
W. P. Carey (WPC) we sold some of our high-cost shares for WPC because $85/share has served as a strong resistance point when it comes to the additional upside. For this reason, we believe it is better to sell some of the shares (in some of the other accounts I have been using limit trades with an $85/share price point) to make sure that I’m not missing these types of opportunities. This price point is relevant because it is where a dividend yield drops below 5%.
May Income Tracker – 2021 Vs. 2022
Income for the month of May was down slightly year-over-year for John’s Traditional IRA and up modestly in his Roth IRA. The average monthly income for the Traditional IRA in 2022 is expected to be up about 8.5% based on current estimates, and the Roth IRA is looking to grow by an astounding 14.3%. This means the Traditional IRA would generate an average monthly income of $1,191.44/month and the Roth IRA would generate an average income of $644.70/month. This compares with 2021 figures that were $1,098.38 and $564.25 per month, respectively. We are on track to generate approximately $1,100 of additional dividend income in 2022.
SNLH = Stocks No Longer Held – Dividends in this row represent the dividends collected on stocks that are no longer held in that portfolio. We still count the dividend income that comes from stocks no longer held in the portfolio even though it is non-recurring.
All images below come from Consistent Dividend Investor, LLC. (Abbreviated to CDI).
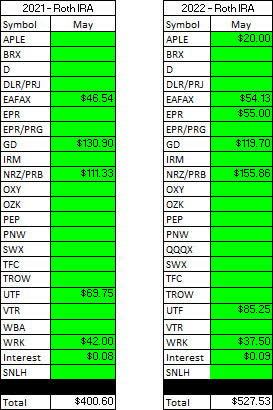
Traditional IRA – May – 2021 V 2022 Dividend Breakdown (CDI) Roth IRA – May – 2021 V 2022 Dividend Breakdown (CDI)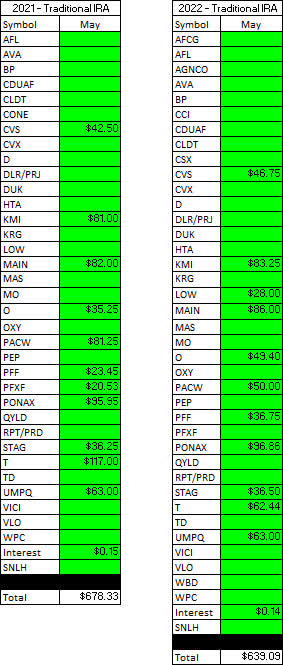
Here is a graphical illustration of the dividends received on a monthly basis for the Traditional and Roth IRAs.
Retirement Account – Monthly Dividends Received – May 2022 (CDI)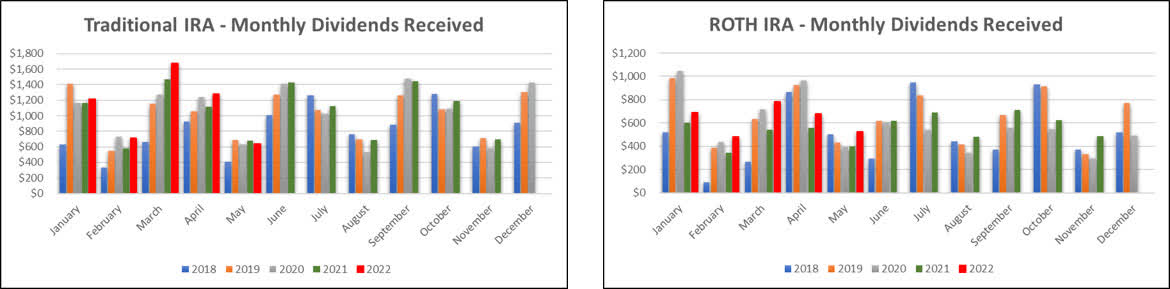
Based on the current knowledge I have regarding dividend payments and share count, the following tables are a basic prediction of the income we expect the Traditional IRA and Roth IRA to generate in FY-2022 compared with the actual results from 2021.
Retirement Projections – May 2022 (CDI)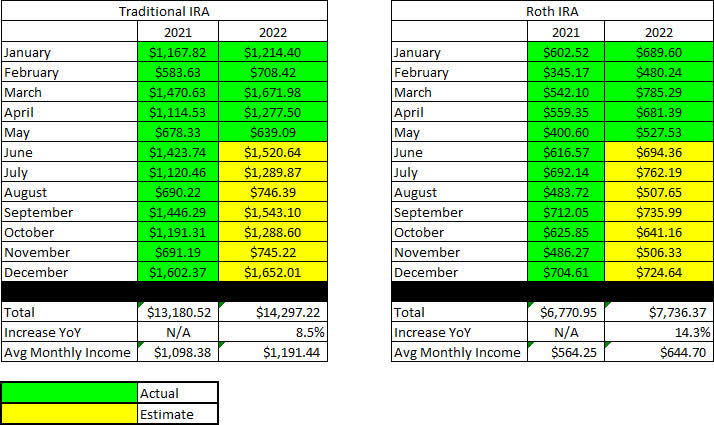
Below is an expanded table that shows the full dividend history since inception for both the Traditional IRA and Roth IRA.
Retirement Projections – May 2022 – Full Dividend History (CDI)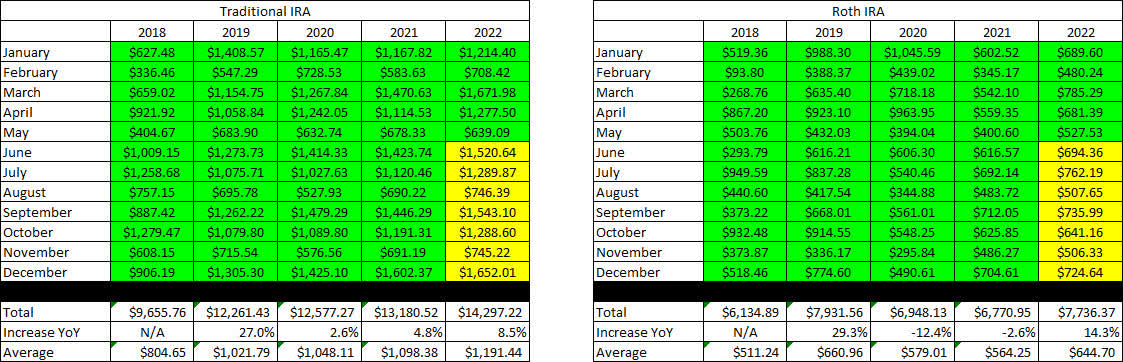
I have included line graphs that better represent the trends associated with John’s monthly dividend income generated by his retirement accounts. The images below represent the Traditional IRA and Roth IRA, respectively.
Retirement Account – Monthly Dividends – May 2022 (CDI)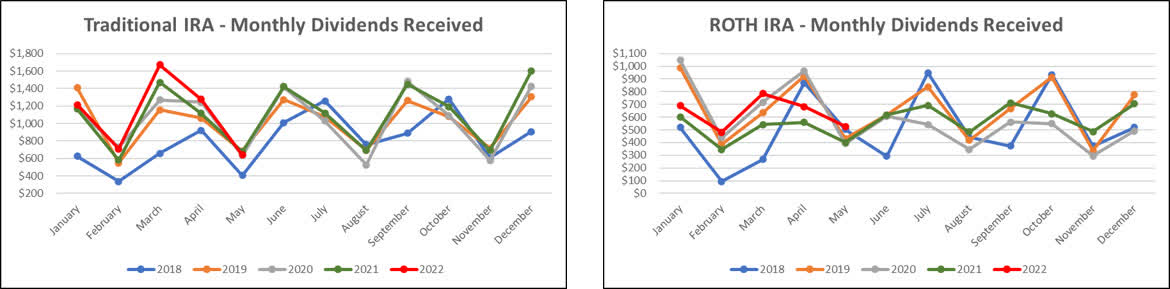
Here is a table to show how the account balances stack up year over year (I previously used a graph but believe the table is more informative).
Retirement Account – Month End Balances – May 2022 (CDI)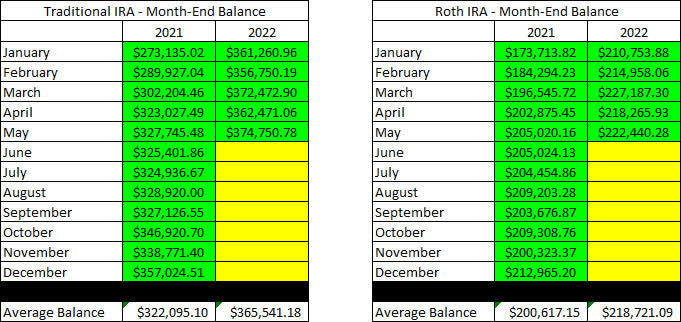
The next images are the new tables that indicate how much cash John had in his Traditional and Roth IRA Account at the end of the month, as indicated on his Charles Schwab statements.
Retirement Accounts – May 2022 – Cash Balances (CDI)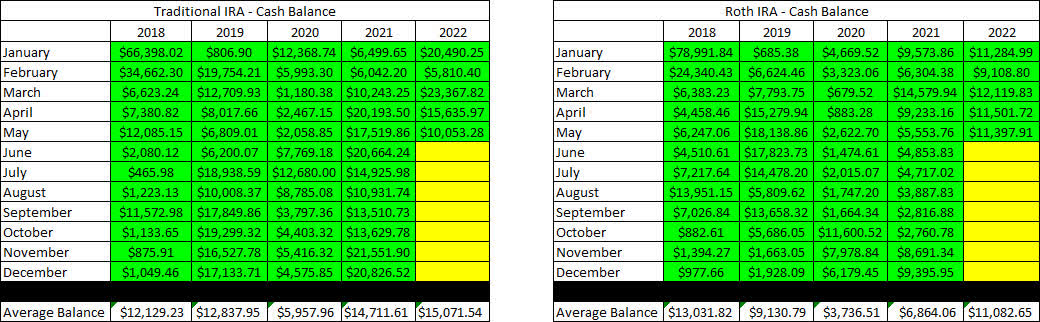
The next two tables provide a history of the unrealized gain/loss at the end of each month in the Traditional and Roth IRAs, going back to the beginning of January 2018.
Retirement Accounts – May 2022 – Unrealized Gain-Loss (CDI)
John has finally begun taking disbursements from his Traditional IRA, and he currently receives $1,000/month.
Traditional IRA Withdrawals – May 2022 (CDI)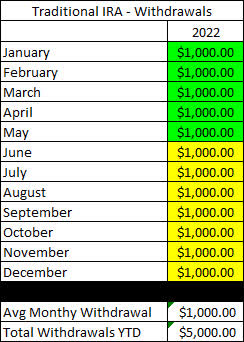
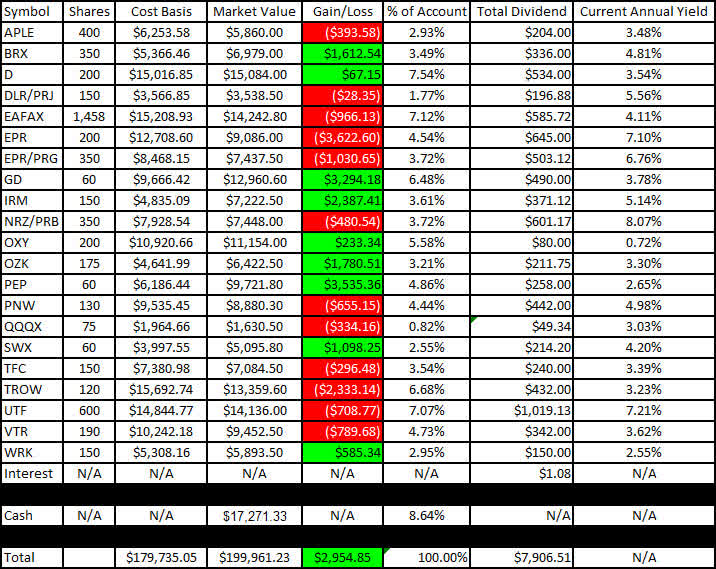
I like to show readers the actual unrealized gain/loss associated with each position in the portfolio because it is important to consider that, in order to become a proper dividend investor, it is necessary to learn how to live with volatility. The market value and cost basis below are accurate as of the market close on June 22, 2022.
Here is the unrealized gain/loss associated with John’s Traditional and Roth IRAs.
Traditional IRA – May 2022 – Gain-Loss (CDI) Roth IRA – May 2022 – Gain-Loss (CDI)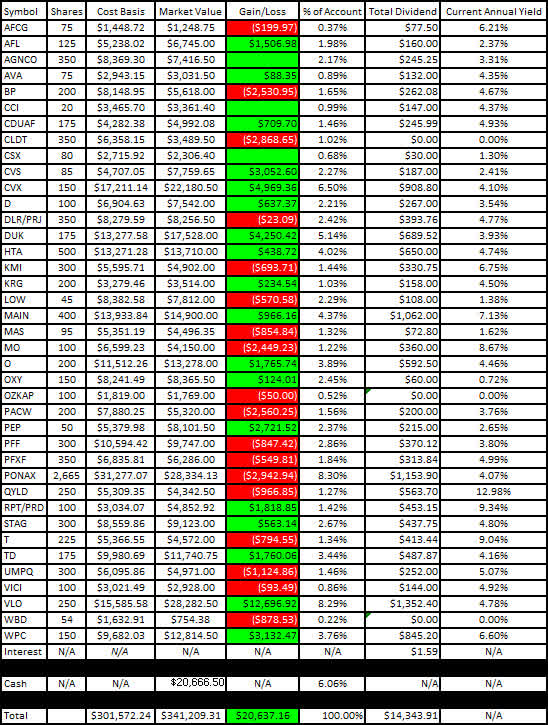
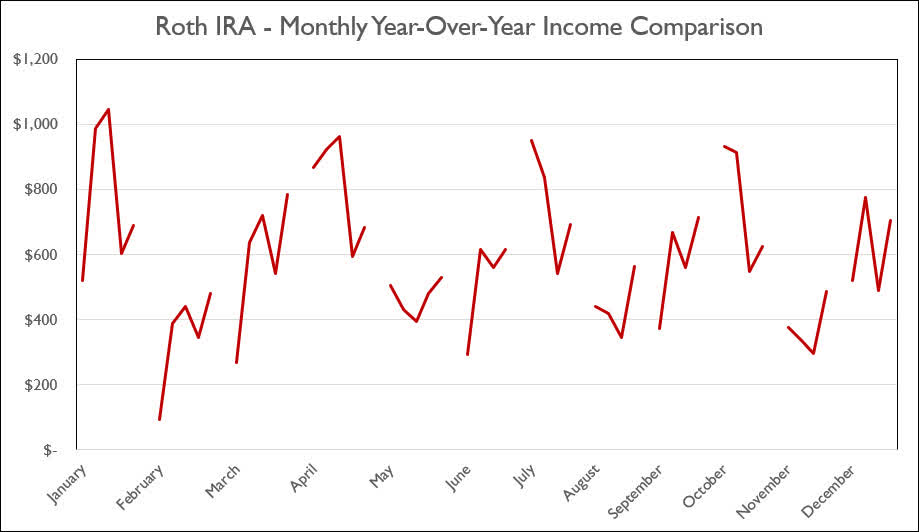
The last two graphs show how dividend income has increased, stayed the same, or decreased in each respective month on an annualized basis. Now that we are in our fifth year of tracking, the trend for each respective month of the year has begun to show interesting trends for when income increases year-over-year.
Traditional IRA – May 2022 – Annual Month Comparison (CDI) Roth IRA – May 2022 – Annual Month Comparison (CDI)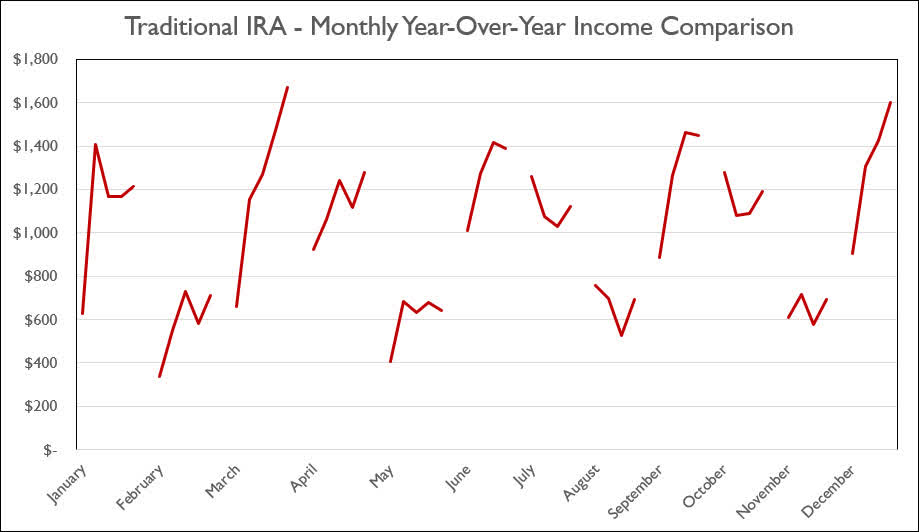
Conclusion
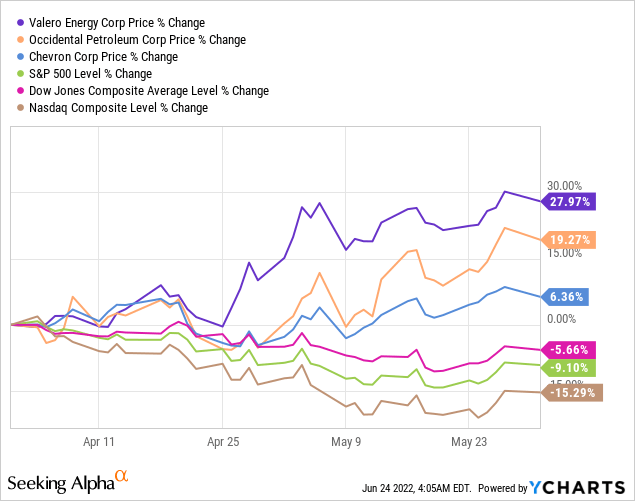
We actually saw account values increase from the end of April to the end of May. Much of the increase in value was directly related to the heavy concentration of energy stocks in John’s retirement portfolio. Some of the stocks that benefitted the most during this time are Valero (VLO), Occidental Petroleum (OXY), and Chevron (CVX).
The image below shows that energy stocks are one of the better-performing investments over the last few months.
When the update for June is completed readers are likely to notice that these account values will have a more drastic decrease in price due to reports of slowing consumption which resulted in oil prices reverting back to the lowest price seen in six weeks. The image below shows that oil stocks have seen a significant loss of value after the first week of June as a result of slowing consumption.
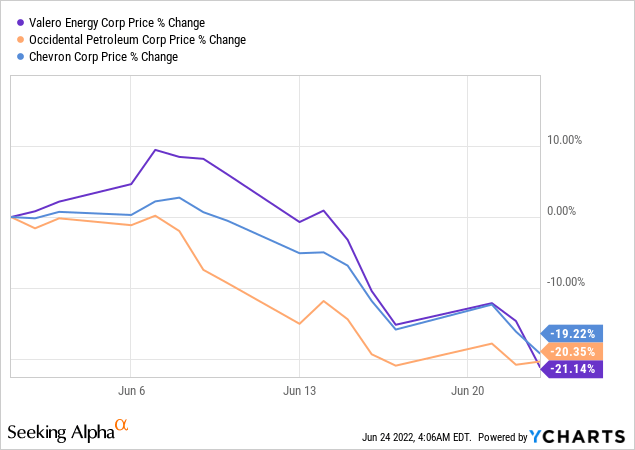
We recently trimmed John’s position in VLO at the beginning of June (the images and updates for this will be shown in the next article) and we did this out of concern for the oil market looking too richly valued. Rotating that capital into other investments like preferred shares mentioned above not only increases the amount of dividend income but also offers the upside from capital gains.
May Articles
I have included the links for John and Jane’s Taxable Account and Jane’s Retirement Account articles for the month of May below.
The Retirees’ Dividend Portfolio: John And Jane’s May Taxable Account Update
The Retiree’s Dividend Portfolio – Jane’s May Update: Watch Out For The Portfolio Plunge
Article Format: Let me know what you think about the format (what you like or dislike) by commenting. I appreciate all forms of criticism and would love to hear what I can do to make the articles more useful for you!
In John’s Traditional and Roth IRAs, he is currently long the following mentioned in this article: AFC Gamma (AFCG), Aflac (AFL), Apple Hospitality REIT (APLE), Avista (AVA), BP plc (BP), Brixmor Property Group (BRX), Crown Castle (CCI), Canadian Utilities (OTCPK:CDUAF), Chatham Lodging Trust (CLDT), CVS Health Corporation (CVS), Chevron (CVX), CSX (CSX), Dominion Energy (D), Digital Realty Preferred Series J (DLR.PJ), Duke Energy (DUK), Eaton Vance Floating-Rate Advantage Fund (EAFAX), EPR Properties (EPR), EPR Properties Preferred Series G (EPR.PG), General Dynamics (GD), Healthcare Trust of America (HTA), Iron Mountain (IRM), Kinder Morgan (KMI), Kite Realty Group (KRG), Lowe’s (LOW), Main Street Capital (MAIN), Masco (MAS), Altria (MO), New Residential Investment Corp. Preferred Series B (NRZ.PB), Realty Income (O), Occidental Petroleum Corp. (OXY), Bank OZK (OZK), Bank OZK Preferred Series A (OZKAP), PacWest Bancorp (PACW), PepsiCo (PEP), iShares Preferred and Income Securities ETF (PFF), VanEck Vectors Preferred Securities ex Financials ETF (PFXF), Pinnacle West (PNW), PIMCO Income Fund Class A (PONAX), Nuveen Nasdaq 100 Dynamic Overwrite Fund (QQQX), Global X Funds Nasdaq 100 Covered Call ETF (QYLD), RPT Realty Preferred Series D (RPT.PD), STAG Industrial (STAG), Southwest Gas (SWX), AT&T (T), Toronto-Dominion Bank (TD), Truist Financial (TFC), T. Rowe Price (TROW), Cohen & Steers Infrastructure Fund (UTF), VICI Properties (VICI), Valero (VLO), Umpqua Holdings (UMPQ), Ventas (VTR), WestRock (WRK), Warner Bros Discovery (WBD), and W. P. Carey (WPC).
Be the first to comment