

Kwarkot
The arc of my research this year has led me from REIT earnings to earnings multiples and now to discount rates. The present article reaches some conclusions about discount rates and REIT pricing as interest rates change. In that context, it offers some thoughts for your consideration.
The importance of interest rates for REITs, strangely, is not primarily their impact on interest expenses, as so many investors fear. With the low leverage most REITs carry, this is a comparatively small effect. I showed some examples in this article. What matters more is their impact on earnings multiples, discussed at length below.
My subsequent article on gains from REIT investing focused on the economic gains produced by well-managed REITs. These reflect the growth of earnings in combination with dividends paid.
As shown there, the economic gains run in the high single digits, give or take a bit. The higher returns produced by many REITs in this century have reflected a substantial growth of earnings multiples. [Please note that by “earnings” I do not mean GAAP EPS, a substantially worthless quantity for most of my areas of interest.]
This then begs the question of what could happen when earnings multiples decrease. As someone expecting to need to withdraw funds above and beyond dividends, starting fairly soon, this is a very consequential question for me personally.
My next article explored this issue, concluding that potential declines in earnings multiples are probably the biggest threat to my retirement income plans. In response to what I learned there, I shifted some of my portfolio from higher growth positions to higher dividend positions with lower (but still positive) expectations of earnings growth.
As one example, I sold Alexandria Real Estate (ARE), on which I wrote this article for members of High Yield Landlord. Now I’m very positive on the prospects for ARE, and in my view every REIT investor more than a decade or two from retirement should hold it.
But those closer to or in retirement should consider whether there is too much risk in ARE for their individual plans. Again note that the main risk in my view is that of declines in earnings multiples, which are out of the control of ARE or any REIT. I replaced ARE with Armada Hoffler, discussed here.
That sets the stage for my topic today. Here is where we need to go.
- What goes into earnings multiples.
- Growth rates for REITs
- Terminal value and big picture on discount rates
- The actual earnings an investor gets from REITs
- Corresponding actual discount rates
- Unpacking discount rates
- The past and future of Treasury Rates and Price Inflation
- Implications for investors, especially retirees
Whence Earnings Multiples?
To better assess the potential future of earnings multiples, one needs to understand their origins. We start here with the big picture and the structure of earnings-multiple calculations. Then we will discuss the pieces.
Most investments are based on the cash flows produced by a business. These provide value to owners through distributions and reinvestment. Just as is the case with a bond or a mortgage, the more distant cash flows have lower value today.
Formally, the Net Present Value, or NPV, of a sequence of payments is the sum for all periods of the payment during each period divided by the amount by which that payment is discounted. For example, if the discount rate is 7% and the payment will be a decade away, its NPV is half its nominal value.
To get an earnings multiple, we divide the NPV by the earnings for the first year. Then the calculation is:
RP Drake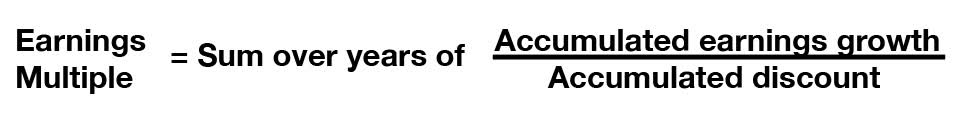
The accumulated discount is in practice evaluated using some fixed discount rate. For a discount rate labeled as DR, the discount for year N is (1+DR) raised to the power N.
If one has and trusts a model of all future earnings, one can just plug that in. I did exactly that for Copper Mountain Mining Company (OTCPK:CPPMF) here.
More common is to assume either an explicit earnings model or some growth rate for the early years followed by a much lower rate forever after that. The value at that lower rate is given by a simple expression and is often called the terminal value.
The idea for the later growth rate is that it should be low, to end up with a conservative estimate of the value of long-term earnings. Here I used 3%, which is common. With these assumptions, it turns out that there is an explicit expression for the earnings multiple. Here it is, with the year after which the growth rate changes designated by Y.
RP Drake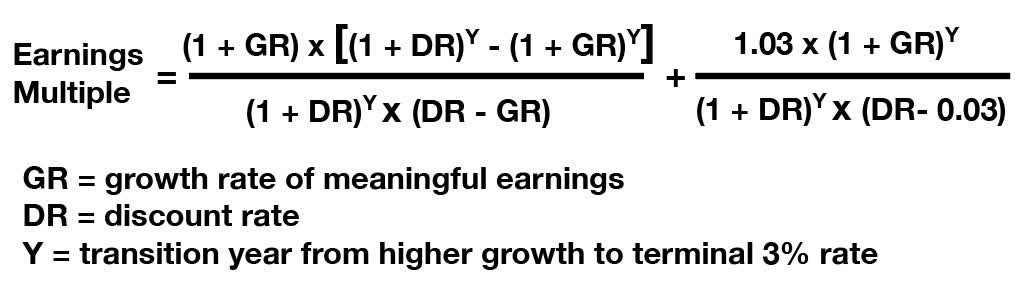
This is easy to code up. You can do it readily in a spreadsheet.
It is informative to do so for those sexy, growth stocks loved by so many, at least until this year. Investors have learned, to their sorrow, that value is very sensitive to the discount rate. So when interest rates carry the discount rate upward the earnings multiples crash hard.
Growth Rates for REITs
Here our application space will be REITs. FFO, or Funds from Operations, is a standardized earnings measure for REITs. It is directly calculated from GAAP earnings numbers found in SEC filings. FFO is easy to find, for example being tabulated by NAREIT.
Those are, however, the only virtues of FFO. We will discuss several other earnings measures below. They all are pretty much proportional to FFO, so the growth of FFO/share is representative of the growth of them all.
Here is a table I put together a while ago showing long-term growth rates of FFO/share for a number of blue-chip REITs. It shows a number of time intervals, and the final column shows my assessment of the normal value.
RP Drake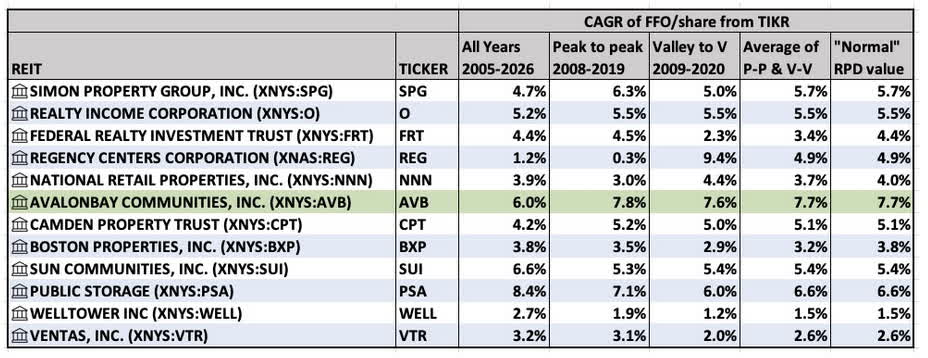
The clear winner is AvalonBay (AVB). When I later took a more detailed look at them for our members at High Yield Landlord, I decided that 6.5% was a better forward number.
You can see that overall the range is from about 4% to 6.5%. The exception is the two big healthcare REITs, Welltower (WELL) and Ventas (VTR).
[Indulge me in a side comment here. I am often interested in REITs whose price has gone nowhere despite producing a significant amount of growth of FFO/share. They are due to be revalued upward, no matter what the backward-looking, momentum-trading types may say.
WELL and VTR were excellent investments from the turn of the century through 2012, so they must have grown FFO/share strongly then. But more recently they seem to have lost their ability to grow FFO/sh even at a 3% rate, and their stock prices have just fluctuated since 2012.
I would recommend staying away from these two REITs and any others that have grown earnings over a long interval at similarly poor rates. The time to invest would be once one understands that something has changed in their business models which will lead to renewed growth of earnings.]
The outcome here is that the models below will use growth rates in the range of 4% to 6.5% per share as a starting point. We can note that these are inclusive of a background inflation rate averaging 2%. We return to inflation below.
The Transition Year Y
In some circumstances there are good arguments for some value of Y. Most oil and gas companies, for example, sustain about 10 years of proved or proved and probable reserves (which is why we have been going to “run out of oil” in ten years for many decades). So it makes sense to transition to a terminal rate at 10 years.
During the 20th century, business cycles had more regular behavior than they have since. For growth companies it became common to use a 7-year period of explicit modeling, to approximate one business cycle, followed by a terminal rate.
Real estate, if maintained, has value that endures for decades and often increases with increased urbanization (and price inflation). Earnings growth from real estate is more variable though, being impacted by recessions, periods of overbuilding, and price inflation.
To help think about this, I did a bunch of plots like this one, which is for a 10% discount rate:
RP Drake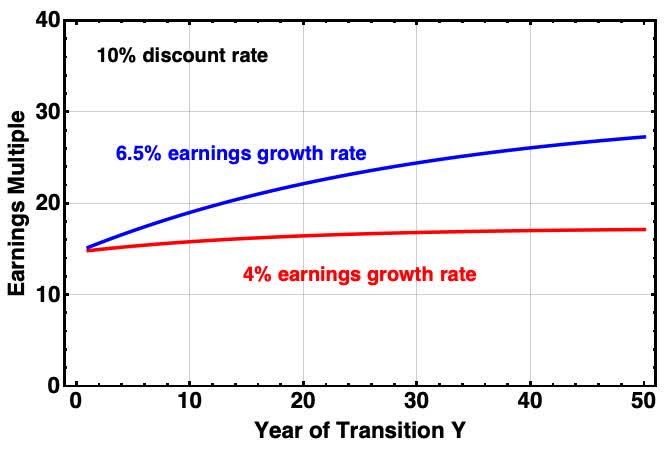
For a 4% growth rate it almost does not matter where you set Y. For the higher rate of 6.5%, going from 10 years to 50 years increases the multiple by 50%, from about 19x to 28x. If one lowers the discount rate, the multiples increase more rapidly with Y.
To my mind, 10 years is a short period for real estate but 50 years is way too long. I decided to use 15 years, in the ballpark of the interval for the analysis shown in the table above. But the higher the growth rate and the lower the discount rate, the more uncertainty is associated with this choice.
Impact of Discount Rate
Having set the transition to terminal growth at 15 years, let’s look at the impact of discount rate on the earnings multiples. We will further unpack discount rates later. Here is what we see:
RP Drake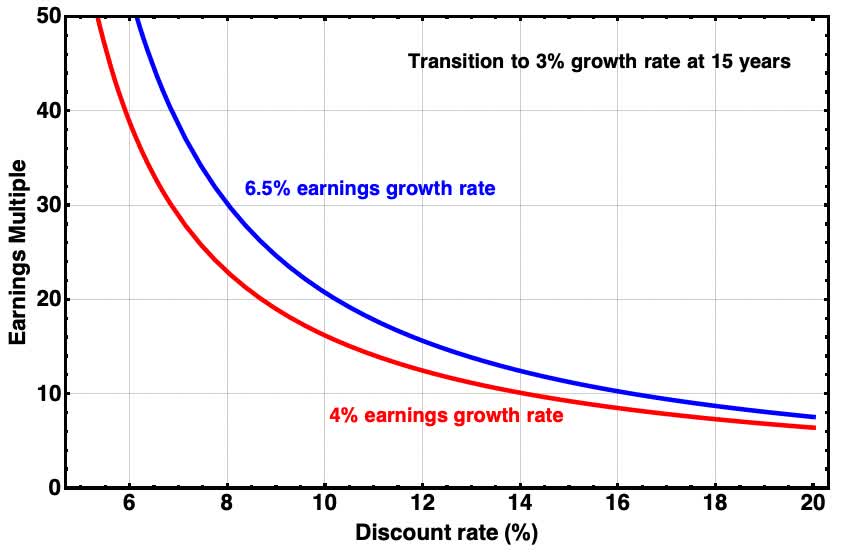
What is remarkable to me is how much multiples increase as the discount rate drops below 10%. In particular, as discount rates drop from 10% to 8%, multiples increase by 50% (!) for the growth rates of interest.
Also note that the multiple for the 6.5% growth rate is about 25% above that for the 4% growth rate. This seems a pretty small difference compared to the gyrations of the market.
Colors of Earnings
Two earnings-related quantities are most commonly seen for REITs. These are Net Operating Income, or NOI, and Funds From Operations, or FFO. Unfortunately, neither one is a good measure of the funds available for distribution and reinvestment, which is the earnings that an investor should care about. I will label that quantity FDR.
I worked with the 7-year tables produced by REIT/base to estimate FDR for four sectors. (REITbase covers 10 to 15 REITs in each.) This table shows the results.
RP Drake
The table shows a sequence of ratios. In simple terms, FFO is smaller than NOI by the amount of General & Administrative expenses and interest expenses. FFO is typically about 2/3 of NOI.
Standard calculations then take one through a “Core FFO” and on to Adjusted FFO or AFFO. This article discusses details. Core FFO adds back in cash costs, typically producing a number larger than operating cash flow.
On average, Core FFO is not a lot above 100% of FFO. But there are major outliers for which AFFO ends up significantly larger than actual cash earnings. These distort the statistics so I pulled them out of the averages here, but checking on this issue for individual REITs you analyze seems a good idea to me.
AFFO is then smaller by the amount of non-cash revenues and, importantly, recurring or maintenance capex. The idea is that AFFO gives the steady cash earnings produced by the operation of the real estate by the REIT.
But in finding FDR, as defined above, an investor does not only care about that. It makes more sense to me to divide (AFFO/FFO) by (Core FFO/FFO), to get a number that treats costs as costs.
On top of that, there is still leakage that escapes this way of adding up the numbers. This seems to me in the ballpark of 10% of AFFO. So the estimated FDR/FFO, shown in the column shaded green, is reduced by another 10%.
The bottom line is that FDR is in the ballpark of 3/4 of FFO, with Net Lease REITs being about 15% higher and Office REITs being about 15% lower. The difference is mainly due to recurring capex, which is really small for Net Lease REITs and really large for Office REITs.
The rightmost column emphasizes that the actual earnings one could spend run about half of NOI. So a property with a 6% cap rate actually produces about a 3% cash earnings yield. I don’t know about you, but that makes me raise my eyebrows.
Calibrating Price/FFO
The calculations above fundamentally produce a value for NPV/FDR. But what we see for REITs is Price/FFO, so we want graphics that show that.
To get P/FFO we multiply the earnings multiples (NPV/FDR) found above by (FDR/FFO) from the table just above. Here is the result:
RP Drake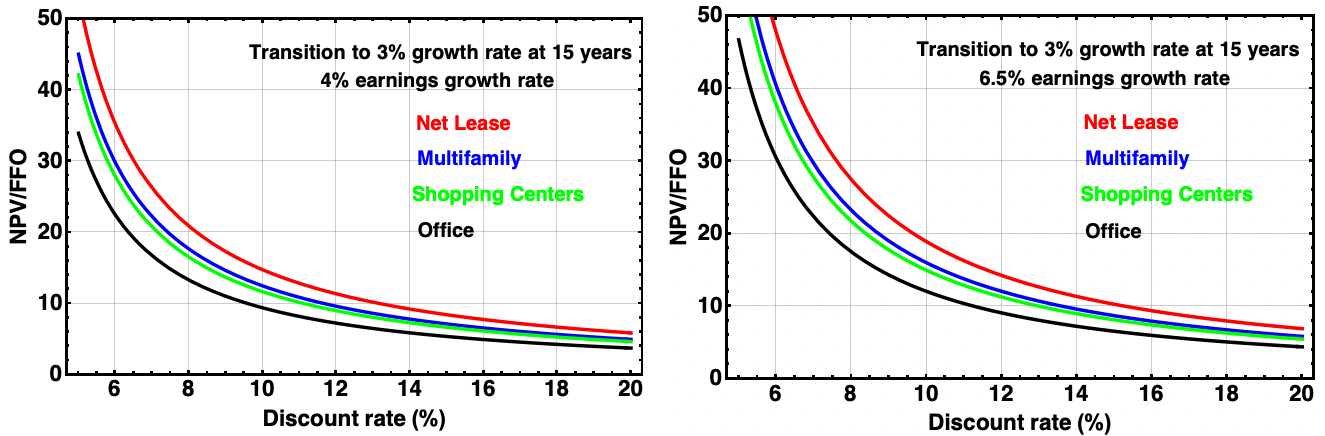
One can find the forward Price/FFO multiples from the compilation by REITwatch. I took those for December 2021 and October 2022 and used the above graphic to find the discount rates implied by the pricing.
The discount rates for low vs high growth typically differ by about 200 bps. The following table shows the approximate midpoints.
RP Drake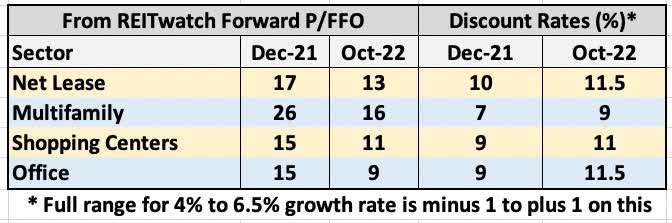
The overall result here is that discount rates for cash earnings from REITs run near 10%. This ballpark result has come up in a lot of my analysis of individual companies. The curves above make it more clear why. Any significant move of the discount rate away from 10% has very large implications for NPV.
What is more significant is the steepness of the dependence of valuation on discount rates. Overall REIT prices have dropped by about a third, but this only corresponds to an increase of 200 bps in discount rates.
Looking at the details, note that the market generates a smaller discount rate (i.e., higher prices) for Multifamily REITs than for the other sectors shown. Perhaps this reflects higher confidence in the long-term solidity of earnings in this sector.
The ordering below that is Net Lease (or “Freestanding”), then Shopping Centers, then Office. It surprises me that Office is valued that highly relative to the other two. The plots above suggest that the NPV should be 3 or so turns smaller for Office than for Shopping Centers.
The Net Lease sector seems to have been pricing in low growth but not the high growth that some such REITs can obtain by issuing shares when this is effective. I have remarked previously on this tendency.
Whence the Discount Rate?
What seems quite notable to me is that REIT discount rates are so far above the 10-yr treasury rate. We will discuss REIT discount rates in the usual way, speaking of a spread from 10-yr Treasury rates to REIT discount rates.
The underlying perspective is that Treasury rates provide a hard floor on returns and that markets will set discount rates above that according to perceived relative risk. However, each rate is set in its own market and one cannot take any spread to be a law of the universe.
Here is the Treasury-rate chart for this century:
Fred.stlouis database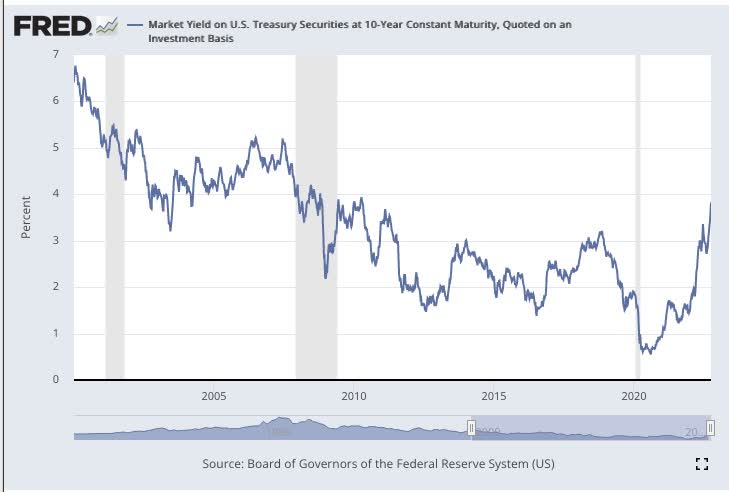
During the past couple of years, the spread from REIT discount rates to Treasury rates has been around 650 bps. The market considers real estate quite risky, demanding far higher returns that from typical speculative bonds.
To look longer term, here is the average ratio of Price/FFO from NAREIT.
NAREIT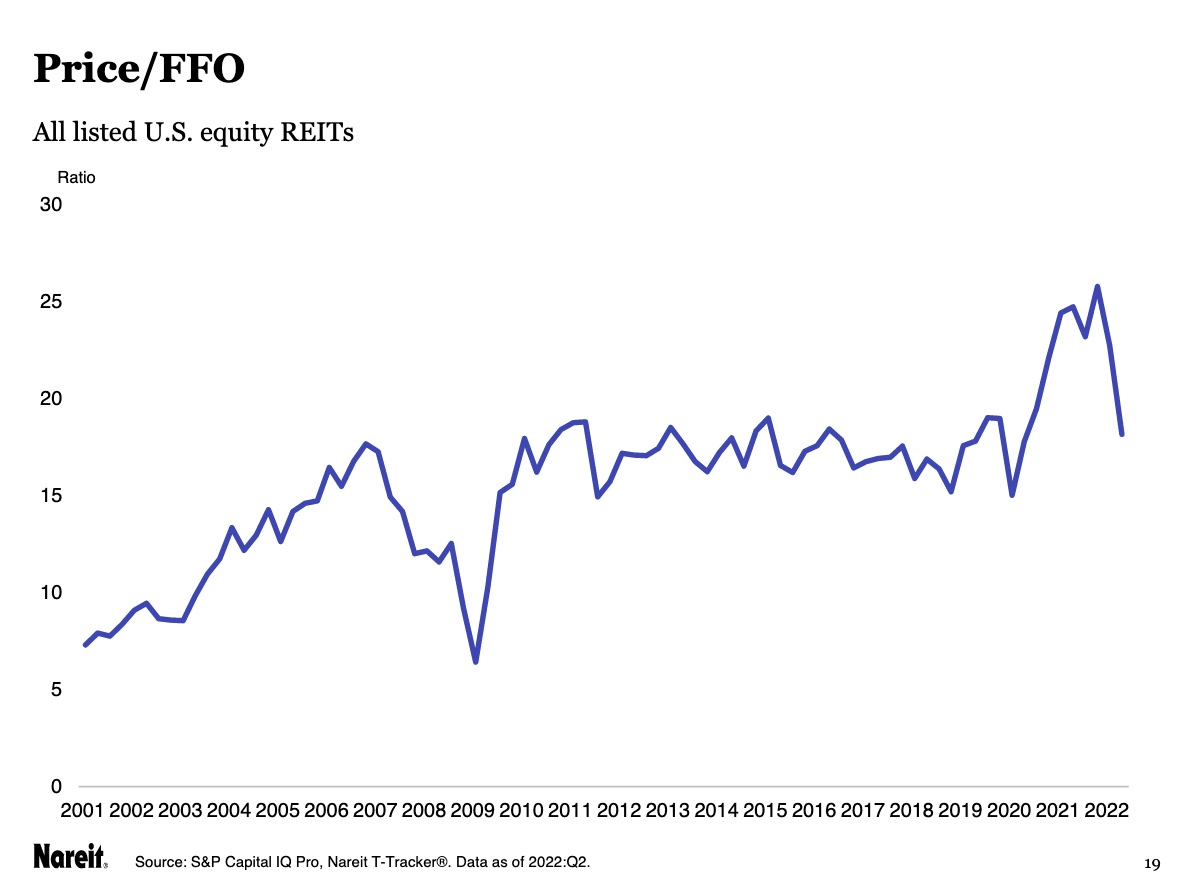
The big changes for a couple years near each of 2009 and 2020 reflects idiosyncratic factors related to the Financial Crisis and the Pandemic. Unpacking those is not worth our time here.
The ratio was 8 or 9 just after 2000. From the charts above, this corresponded to discount rates in the ballpark of 15%, perhaps 900 bps above the Treasury Rate.
This seems quite high; the market had very little confidence in real estate earnings. The ratio of Price to FFO had moved to the high teens by 2010, corresponding to discount rates in the ballpark of 8%. Treasury rates had come down a lot too.
Throughout the teens, the spread between the two ran 500 to 600 bps. The decrease, compared to early in the century, would sensibly reflect the changes in the REIT sector.
By the teens REITs overall had lower leverage and better overall debt management. The prior sectors were more consolidated and new sectors with quality earnings, such as Tower REITs, had emerged. In addition, there was an increase in the acceptance of real estate investments by institutions. Perhaps that decline in the spread from ~900 bps to ~550 bps reflected these drivers.
If one thinks we will return to that spread of about 550 bps, there is room for a 100 bps decrease in REIT discount rates. If one thinks Treasury rates will return to around 2%, where they have been for a decade or so, there is another 100 bps or a bit more.
Taken together, these effects could push earnings multiples back up to where they were in late 2021. But there are no guarantees.
My conclusion from a lot of study is that REITs will sustain earnings and grow them at least slowly in most circumstances. So seeing that spread over treasuries return to ~550 bps or even less seems likely to me.
Treasury rates, however, may be another matter. Let’s look more closely at that question.
Whither Treasury Rates?
Let’s take a very long look at 10-yr Treasury rates. Here they are compared with rates of price inflation for the past century.
RP Drake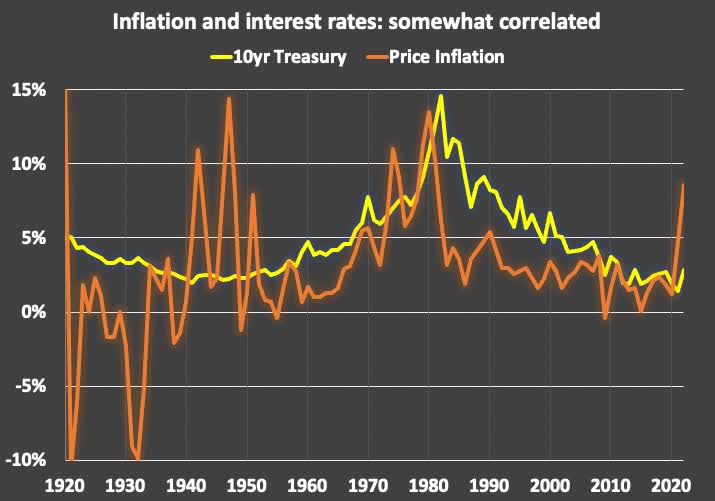
Looking ahead from here, history suggests two possibilities. We could see a period of steady low Treasury rates, as did the 1940s, or a could see rates build over time to a very high spike, as did the 1970s.
In the first of these scenarios, REIT earnings multiples might return to where they were in early 2022. In the second, they might sag to P/FFO below 10 as Treasury rates climb well above 5%. The latter could be a disaster for any retiree relying for income on the appreciation of low-yield REITs such as ARE, mentioned above.
Alternatively, we might see new history, with Treasury rates spending extended periods back near 0%. I see that as quite unlikely, in part for reasons discussed below. But if you are in your 50s or older and want to bet your retirement income on a hypothesis of very low Treasury rates forever, go right ahead.
Whither Inflation Rates?
The US once again needs to inflate prices by about a factor of two in order to push the real value of its debt down to manageable levels. The rest of the Developed West is in a similar state. Lyn Alden has discussed this cogently and at length, in this article and numerous others.
You can find many articles emphasizing the deflationary elements of current times. These are definitely real, and include technological progress, demographics, and other things. But ultimately they matter little and they may make things worse. Lyn Alden points out that central banks
…have the power to override these various deflationary forces with sheer monetary expansion. They can issue helicopter money to pay off debts, boost inflation, build infrastructure, bail out unfunded pension systems, and prop up the middle class if that’s what policymakers decide to do.
In the 1940s, the needed overall price inflation happened via three inflationary spikes, with inflation rates declining to low values in between. In the 1970s this happened via a stair-stepped upward move in inflation to a peak well above 10%.
Lyn argues that we are most likely to see a decade like the 1940s, with spiky inflation and overall low treasury rates. I tend to agree, because a decade like the 1970s with both enduring high inflation and high treasury rates would not be sustainable, as recently illustrated in the UK.
Impacts of Inflation and Treasury Rates
Price inflation drives up earnings on new leases and replacement rates on structures. High treasury rates drive up discount rates and weigh on property values.
In the long run, inflationary times will lead to higher overall cash flows for REITs. But this is not instantaneous and increasing discount rates could still drive down earnings multiples and ultimately prices.
If we get a decade that rhymes with the 1940s, the outcome for retirees who invest in REITs will have good and bad aspects. The bad is that cash flows will lag inflation while expenses won’t. The good relates to earnings multiples; they would be unlikely to show an overall secular decline, although they may fluctuate as always.
Things would be worse if we get a decade that rhymes with the 1970s. In that case we would likely see an enduring, secular decline in earnings multiples throughout the decade. And again cash flows would lag inflation while expenses would not.
It remains true, to my eyes, that secular trends in discount rates and earnings multiples remain the biggest threat to retirement income plans that require selling stock. This applies even to investments in firms whose cash flows will keep up with inflation.
Protecting Your Spending Ability
As a retiree or near-retiree, the choices you make will determine how the future impacts your spending ability. As always, the question is what future to prepare for.
It seems nearly certain to me that we will see substantial inflation over the next decade, or maybe two. The ability of REITs and some other asset classes to grow cash flows in response to inflation provides relatively good protection against this. However, you will have to manage your own cash flows to handle the lag between inflated expenses and increased earnings.
What will happen with earnings multiples is less clear. They could decrease across the next decade, decreasing the monetary value of your portfolio. I tend to think they won’t, much. But the probability that they will is high enough that it makes sense to be defensive against this possibility.
I discussed one way to approach this in a recent article. What you need is the largest possible secure and growing dividends.
This will provide growing income. It also will provide growing earnings that will at least delay and might reverse the impact of any decline in earnings multiples.
In pursuing such an approach, what you want is diversified, quality firms with good prospects for dividend coverage and the lowest dividend yields that meet your financial goals. But if you hope to spend more than the dividends alone, that will tend to push you toward higher yields. This is not for the income as such, but rather for the protection against increasing interest rates and discount rates that would lead to decreased earnings multiples.
What you don’t want is to buy high dividend yields that turn out to represent false hope. Personally, this pushes me toward growing companies whose businesses I can understand and away from “engineered yields.”
You cannot select firms that meet your needs with simple screens. You need to perform or find deep analyses that consider closely the full context of the potential investment.
As one example, the flow of bullish articles on W.P. Carey (WPC) is substantial. But few of those articles account for some near-term lease expirations that will delay the advent of strong dividend growth. My most recent article on WPC did.
My articles on specific firms are intended to report analyses that do consider all relevant factors. I seek to improve the analysis via interactions with readers, in support of my own investing.
But producing such articles is time consuming and is inconsistent with what you have to do to make much money writing on SA. Most articles on SA about any stock might better be taken as suggestive of potential directions for deeper analysis and not as definitive studies.
Be the first to comment