

JLGutierrez/E+ via Getty Images
During a recent interview on CNBC, Federal Reserve Vice Chair Lael Brainard described the U.S. as a “very, very strong economy” at the present moment. Pardon me while I have a good laugh.
The data does not support Brainard’s conclusion. Google Trends data shows a substantial uptick in the search of the term “recession” over the past few months. Readers have likely noticed a similar rise in the number of SA articles covering recession lately.
Chart by author, data from Google Trends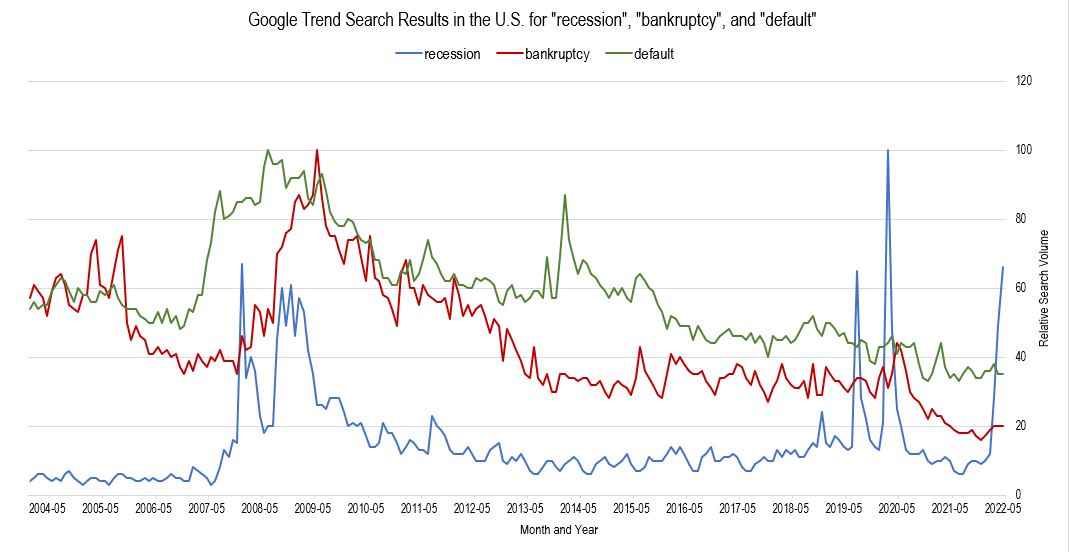
It begs the question, is this just click bait or is this for real? If you listen to Fed governors or politicians you would not get the sense of recession. Perhaps the correction in equity markets is simply unnerving investors. After all, many recessionary indicators have yet to signal anything including search trends for “bankruptcy” and “default” as well as unemployment data.
It is disappointing to find that statements dismissing recession are disingenuous. Not only is there a significant probability of recession, I believe the data shows that recession has already begun. Normal business cycles include recessions; this is not a travesty. However, understanding where one is in the business cycle is the first step to successful macro-investing.
What is Recession?
It was Harry Truman that said “It’s a recession when your neighbor loses his job; it’s a depression when you lose yours.” His analogy is witty but does not technically identify recession. Traditionally, recession has been considered two consecutive quarters of decline in economic growth, typically measured by real GDP. The National Bureau of Economic Research is responsible for officially declaring recessions. Their definition of a recession includes:
…definition of a recession is that it is a significant decline in economic activity that is spread across the economy and that lasts more than a few months. The committee’s view is that while each of the three criteria—depth, diffusion, and duration—needs to be met individually to some degree, extreme conditions revealed by one criterion may partially offset weaker indications from another.
The NBER has a consistent record of declaring recessions in hindsight, which is of little use to investors. In December of 2008 they declared the start of the Great Recession in December 2007 and declared the end of the recession in September 2010, over a year after the recession ended.
I’m starting to like Truman’s definition better.
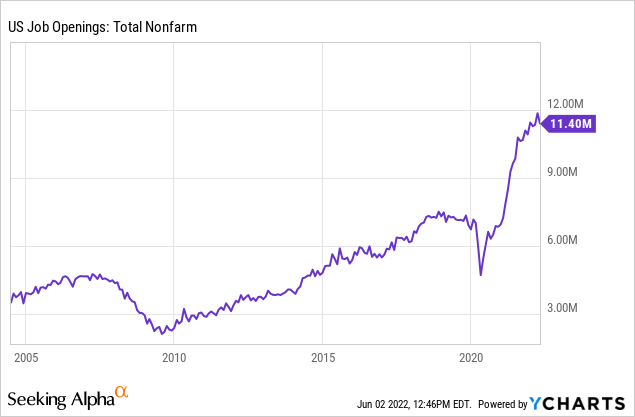
If we take a look at job openings it doesn’t seem like there is any trouble at all. The chart below shows that there is nearly 2 job openings for each unemployed person in the U.S. With such abundance it seems like recession could not be possible. However, employment is a lagging indicator. We’re going to examine the breadth of data, compare to past recessions, and see where we stand today.
Number of Job Openings Per Unemployed Person (Charts by TradingView (adapted by author))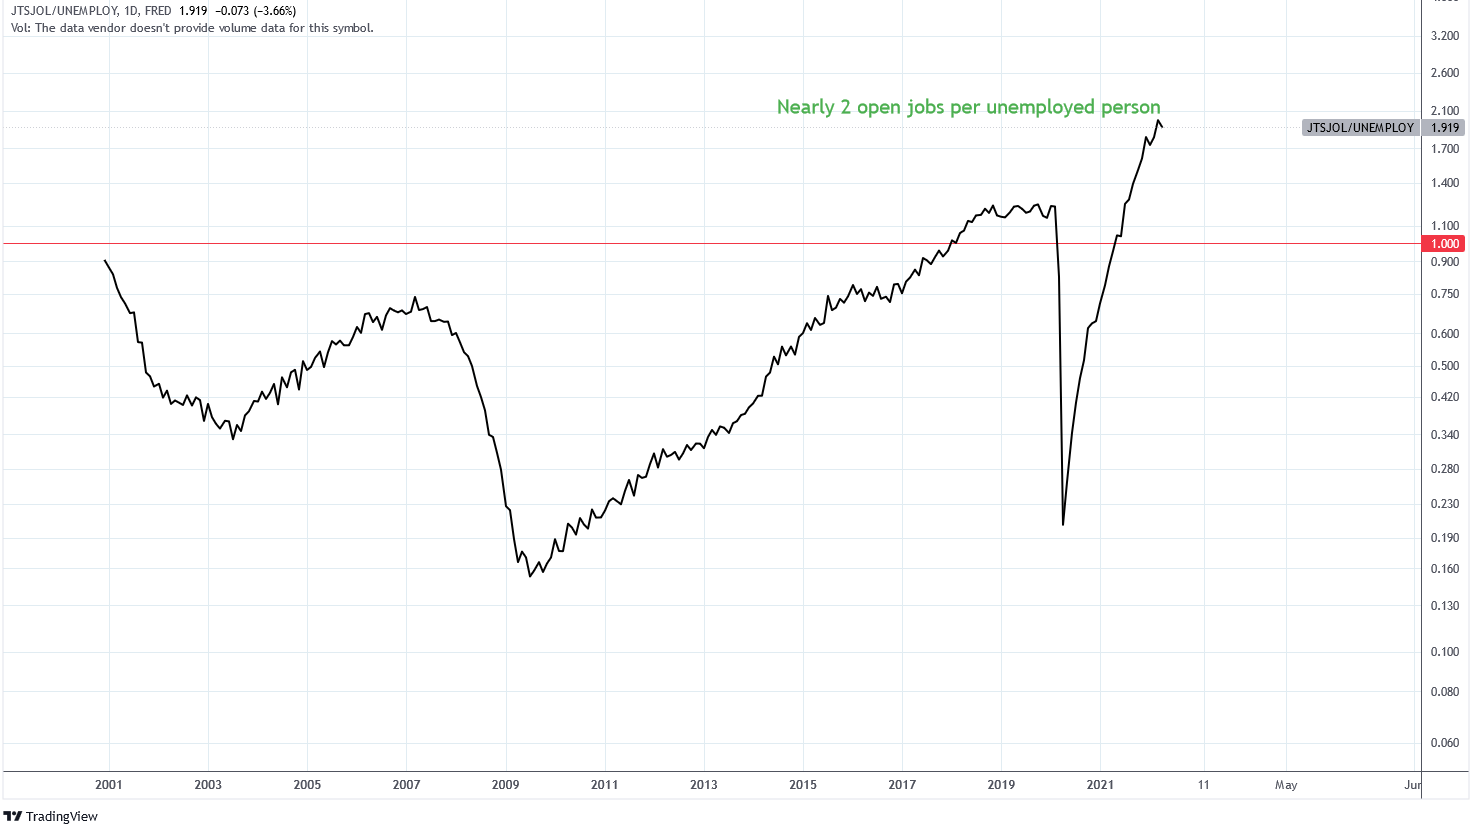
The Consumer Is Not Strong
Contrary to repeated claims consumers are not in good shape. Employment is currently strong and incomes are increasing nominally, however, inflation and the rising cost of living is eating away discretionary spending. Adjusting for an official inflation rate of 8.3% and producer price index of 11% real wage growth is negative. This has resulted in a drop in the personal savings rate to 4.4%, the lowest since 2008.
Personal Savings Rate (Charts by TradingView (adapted by author))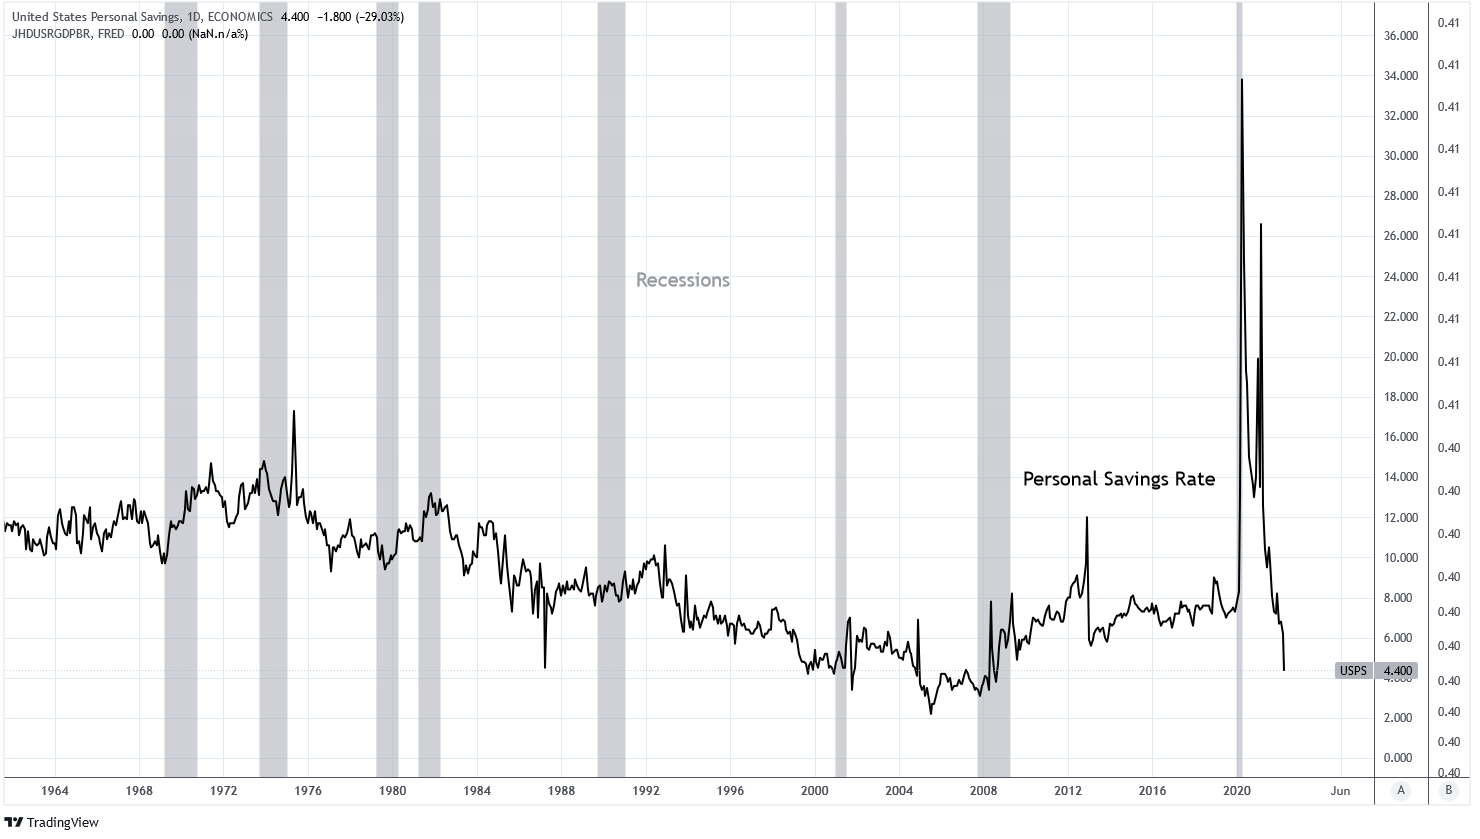
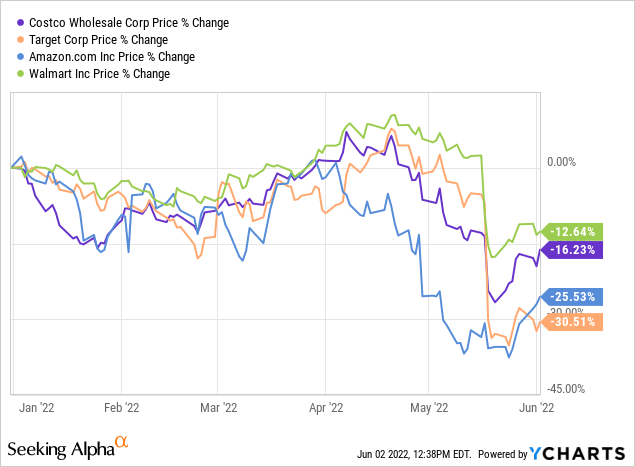
The consumer is showing weakness as indicated by sales data from major retailers such as Costco (COST), Walmart (WMT), Target (TGT), and Amazon (AMZN). These retailers and many others have endured significant share price depreciation in response to weakness in revenues and earnings estimates. For Q1 2022, Walmart’s revenues increased 2.3% YoY while Target increased 4%. These are well below the inflation rate of 8-9%, indicating negative real revenue growth. Both retailers have also reported substantial increases in inventory, suggesting a slowing in sales volume.
Amazon posted a $3.8 billion loss in Q1 2022 and is guiding for negative real sales in Q2. The company has stated that its workforce is too large. Amazon may not need to conduct layoffs only due to a high natural turnover. In addition, the company is beginning to reduce its warehouse capacity by at least 10 million square feet. The issues are impacting small businesses as well. Data from RetailDive found that 34% of small retail businesses could not pay their rent in April.
These declines in real sales would be minor if consumers had the income to sustain their current standard of living. In truth, that is not the case. Credit card debt has been rising over the past year as consumers struggle. Americans opened a record 537 million new credit card accounts in Q1 2022.
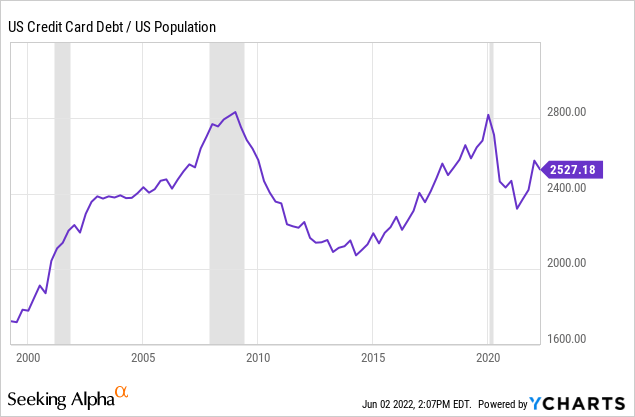
In March, the MoM change in consumer credit was +$52.4 billion, the highest monthly change in over two decades.
The Daily Shot (used with permission)
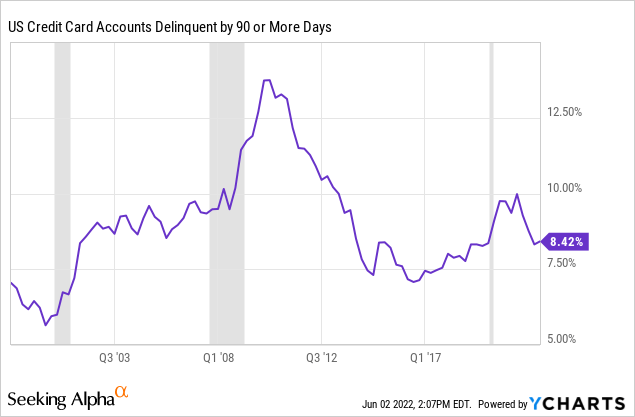
Thus far the delinquency rate on credit card debt is not at historically high levels but the rate is rising. This is especially true for subprime borrowers which have been turning delinquent at record pace.
This has resulted in outstanding credit card and other revolving plans balances becoming larger than personal savings, the first time since April 2008.
Personal Savings minus Credit Card Debt (Federal Reserve Economic Data | FRED | St. Louis Fed)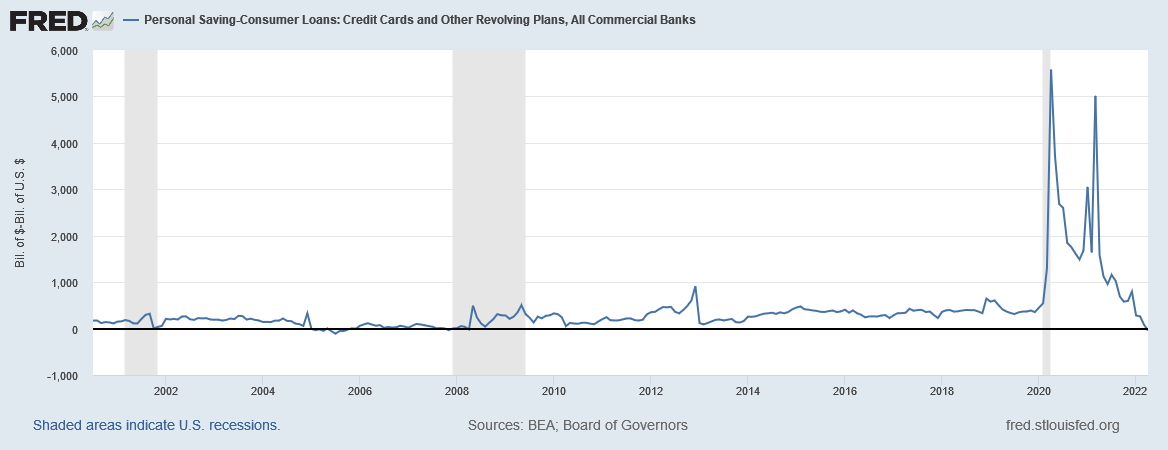
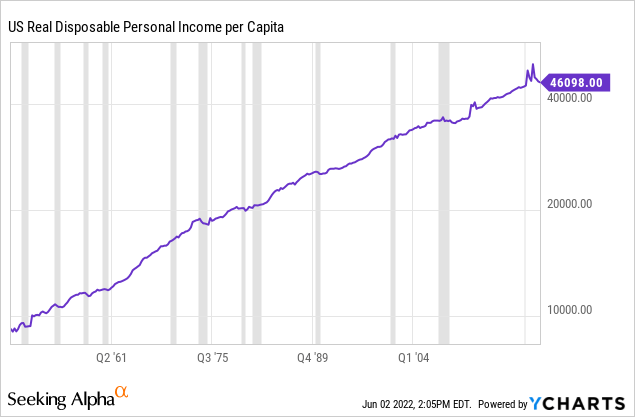
This decline in savings and rise in credit is due in part to declining real wages. Real disposable personal income has declined since 2021 and is at the same levels as 2019. Declines of this degree are often correlated with recessions.
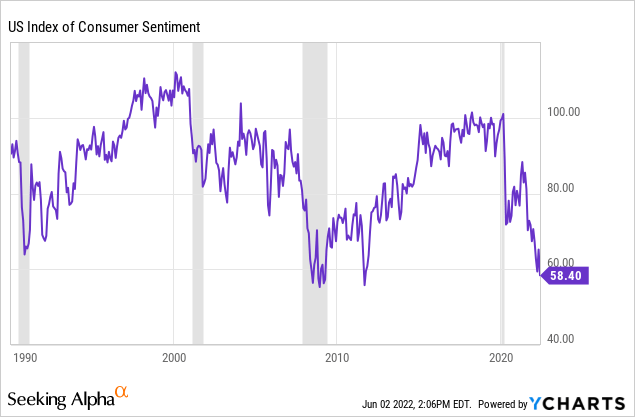
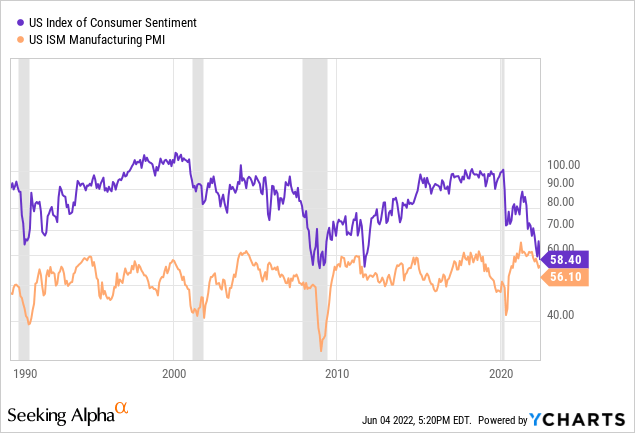
It should be no surprise, then, that US Consumer Sentiment has fallen. The Michigan Consumer Sentiment Index reached a level of 58.4 in 2022 which was last seen in June 2011 and March 2009 before that. A decline of this degree is often correlated with recessions.
Both the Consumer Sentiment Index and Consumer Expectations Index have been coming in below expectations over the last quarter.
The Daily Shot (used with permission)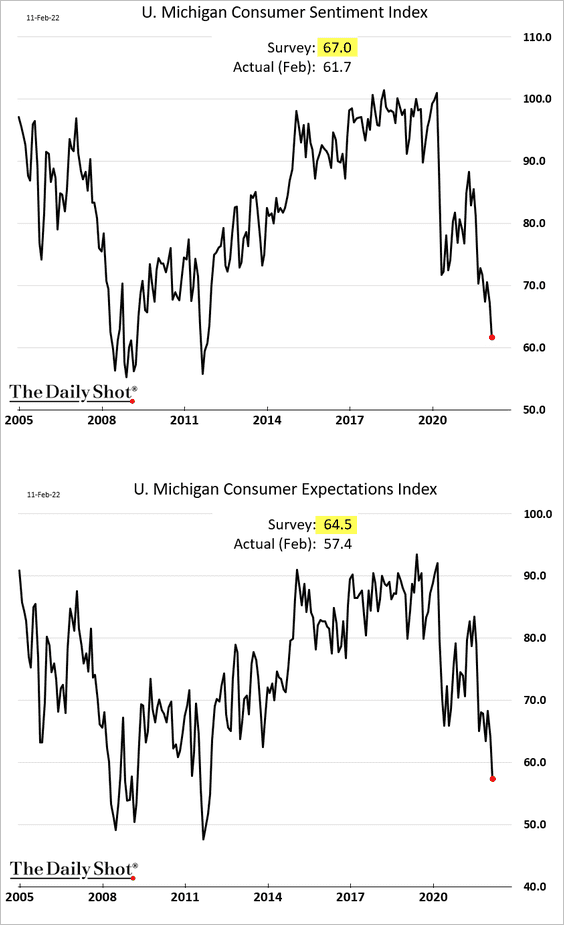
A recent Harvard CAPS/Harris Poll found that 56% of Americans say that their financial condition is getting worse. Another poll by OnePoll found that about 2/3 of Americans are embarrassed of their financial situation. LendingClub has found that half of Americans making $100,000 per year or more are living paycheck to paycheck. Pet shelters across the country are reporting higher rates of pet surrender, a result of tighter household budgets. Research from J.D. Power and LMC Automotive forecasts a drop in new car sales in May of 20.9% YoY. These are not signs of a strong consumer.
Employment Looks Great, But Looks Are Deceiving
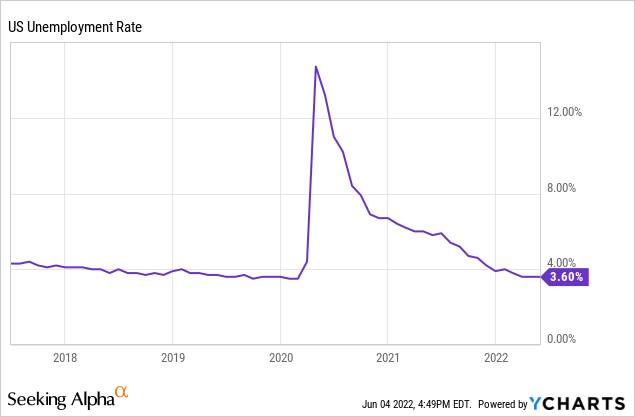
Despite consumer weakness employment data remains strong. The unemployment rate is 3.6%, a statistic often praised by leadership, and U.S. job openings are at long term highs. This is how we achieve nearly 2 job openings for each unemployed person.
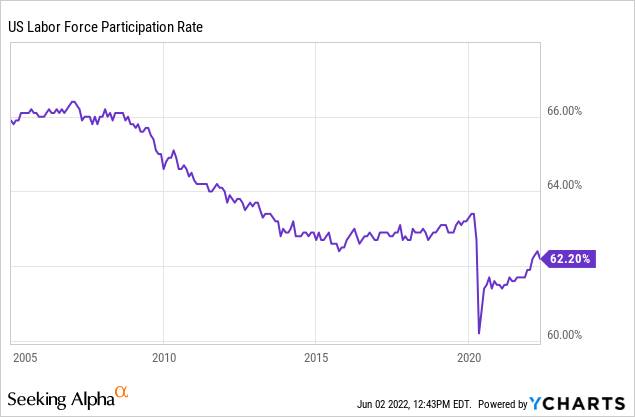
The unemployment rate is an imperfect measure of employment as it fails to fully capture persons who are not seeking employment. The U.S. labor force participation rate has yet to recover to pre-pandemic levels. This is due to a combination of factors including stimulus, government assistance programs, and changes in lifestyle. The point is that the majority are voluntarily unemployed. If the labor participation rate were restored to 2019 levels the number of non-farm U.S. job openings would drop to 2019 levels, essentially erasing the large jobs glut.
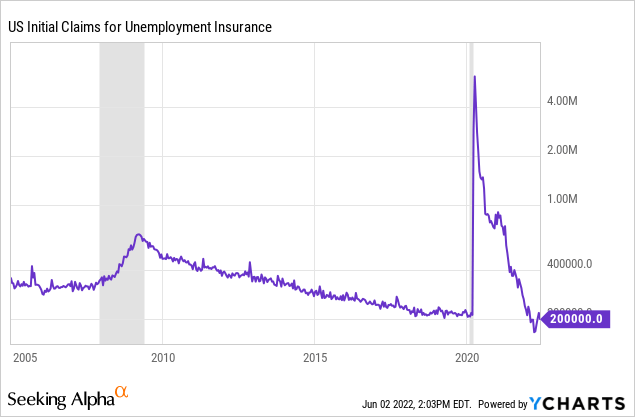
However, employment is a lagging economic condition and signs are beginning to show of impending weakness. Initial claims for unemployment has spiked sharply in the last quarter. This has not yet established a trend, however companies are signaling that more is to come. As earnings shrank and share prices sold off a list of companies have announced hiring freezes or layoffs. For example, Tesla (TSLA) has announced its intention to layoff 10% of its workforce.
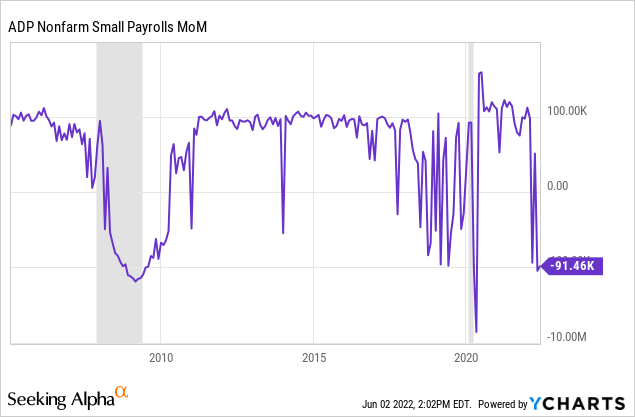
But a closer look at the picture becomes more grim. The ADP non-farm small business payrolls MoM change was -91.46 thousand last month. This decline last occurred during each of the previous two recessions. This is telling as small businesses tend to identify changes in economic conditions first.
The Consumer Sentiment Index is strongly correlated with unemployment. In the chart below the Consumer Sentiment Index is inverted in red and the U.S. unemployment rate is in black. Since March 2021 there has been a divergence between these data. The Consumer Sentiment Index is at levels that imply an unemployment rate of 10% if the relationship holds. Notice that during most major rises in unemployment the Consumer Sentiment Index leads by 6-12 months.
Consumer Sentiment and Unemployment (Charts by TradingView (adapted by author))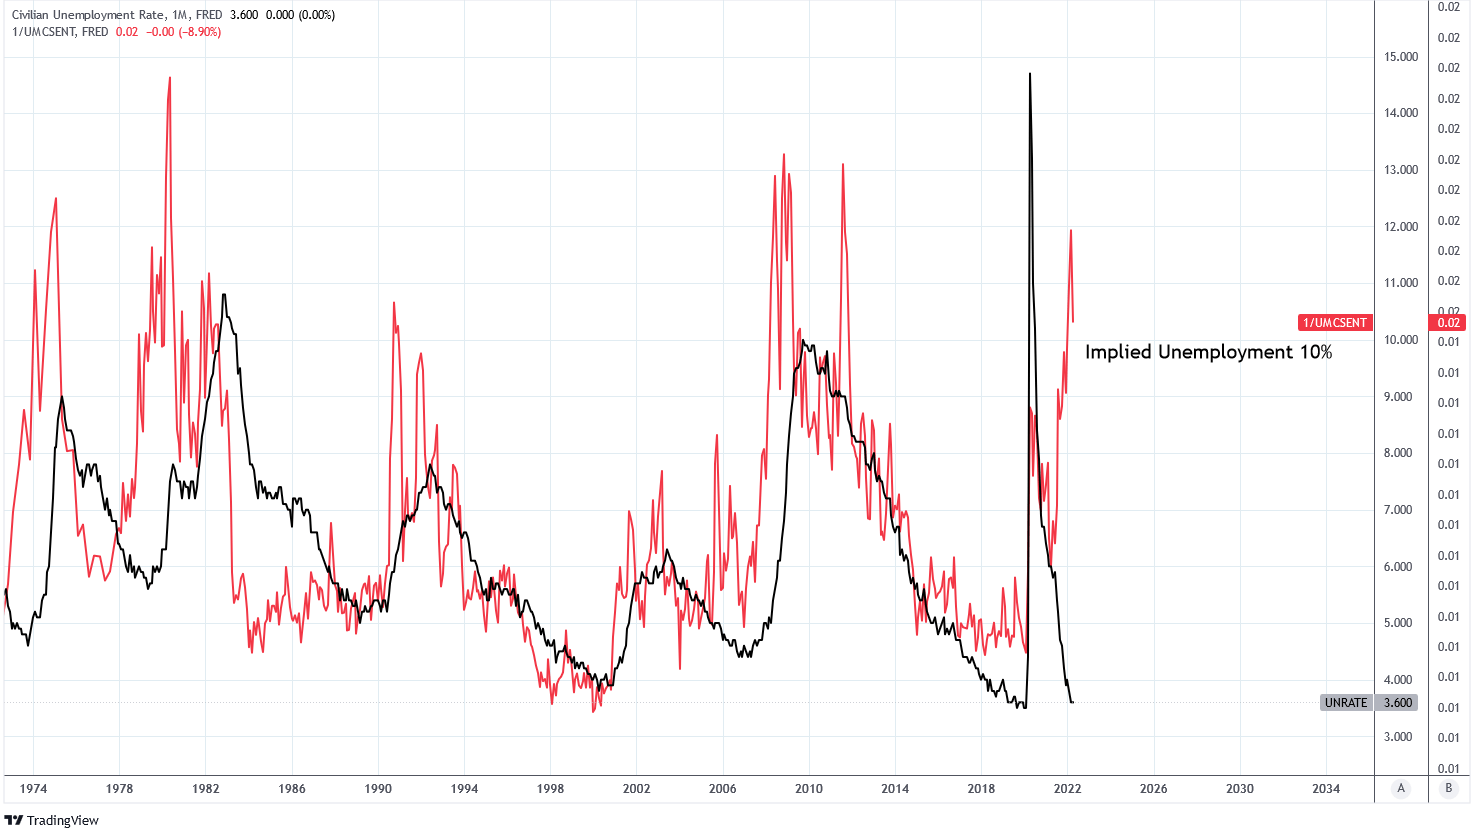
Economic Conditions Are Degrading Without An End In Sight
Besides consumer health and employment other economic indicators are useful for forecasting and identifying recession. The U.S. ISM Manufacturing PMI consistently reaches 45 during recession. The PMI currently stands at 56, however leading indicators suggest it is heading much further down. The Consumer Sentiment Index tends to correlate with PMI in broad trends and is currently signaling a decline to 45 just as it did in 2008.
ISM new orders – inventories tends to forecast the ISM PMI with a 3 month lag, as can be seen in the following chart from The Daily Shot. Currently this indicator is forecasting a PMI of approximately 48. The U.S. Financial Conditions GS Index forecasts a lower PMI of approximately 45. Also, this interest rate model by Andreas Steno Larsen is forecasting a PMI of 38.
The Daily Shot (used with permission)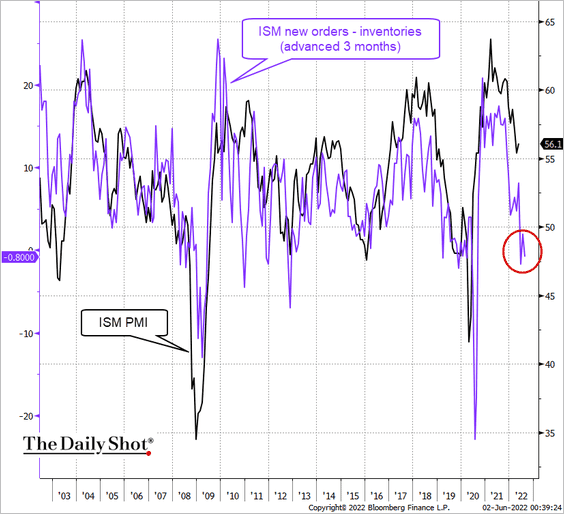
While the relationship between China PMI and U.S. PMI is imperfect, during recessions they tend to fall in unison. China PMI numbers are already in the recession range. This may simply be due to the recent COVID lockdowns in Shanghai and Beijing, but the preponderance of evidence suggests there is more going on.
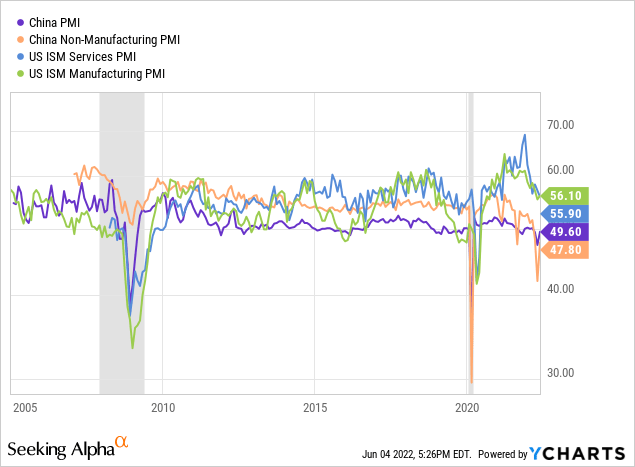
U.S. ISM Employment Indexes are lower than PMI at 49.6 and 49.5. If this data continues to trend down it will signal recession.

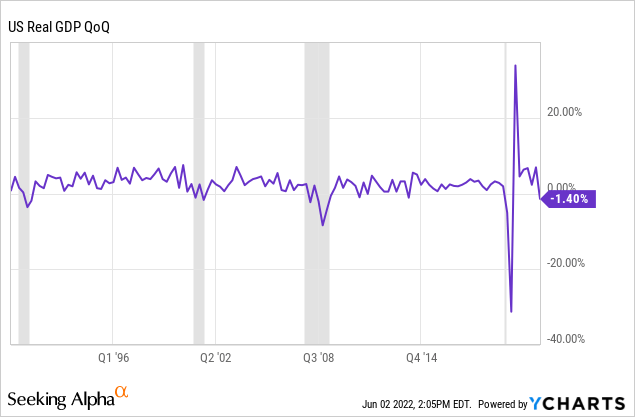
Using the traditional measure for recession of real GDP we find that the first quarter of negative real growth occurred in Q1 2022. Given the current economic data I think it is inevitable that Q2 will also be negative. That is two consecutive quarters of negative GDP and results in recession by this measure.
The YoY change in non-durable goods consumption is now negative in 2022. This is the fourth occurrence in the last 20 years, two of which correlated with recession.
Federal Reserve Economic Data | FRED | St. Louis Fed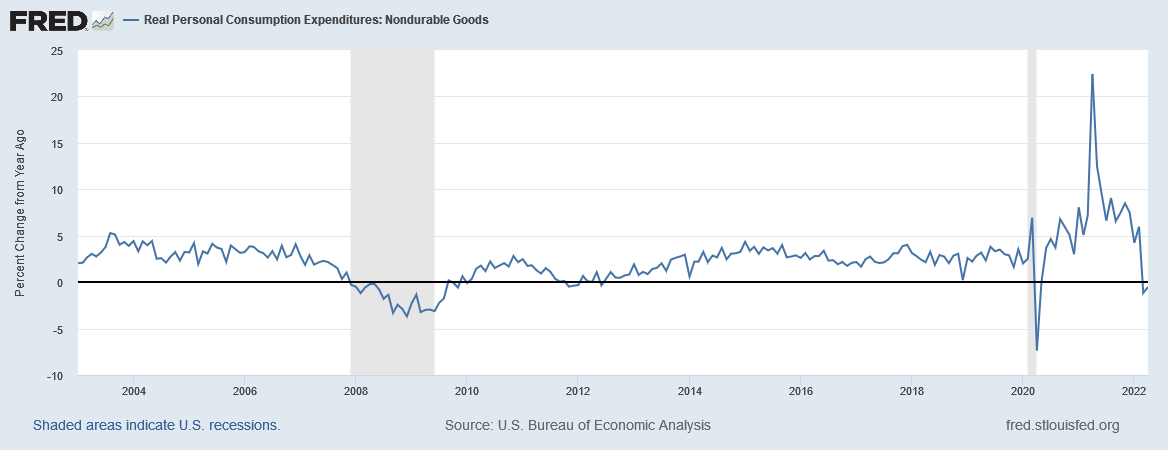
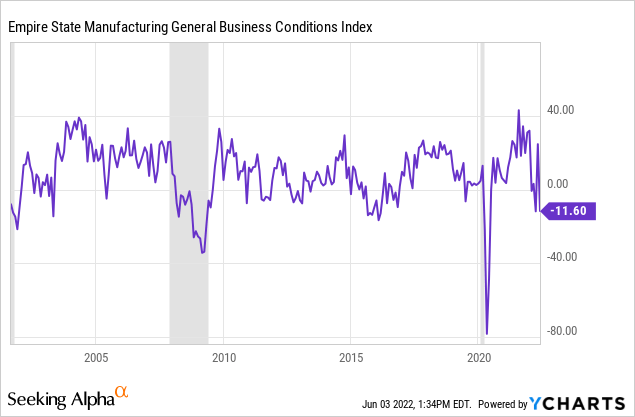
The Empire State Manufacturing General Business Conditions Index is now contracting. Contraction occurs during recessions, although contraction does not necessitate recession. If the index contracts further, to a level of -20 or lower, the probability of recession is significant.
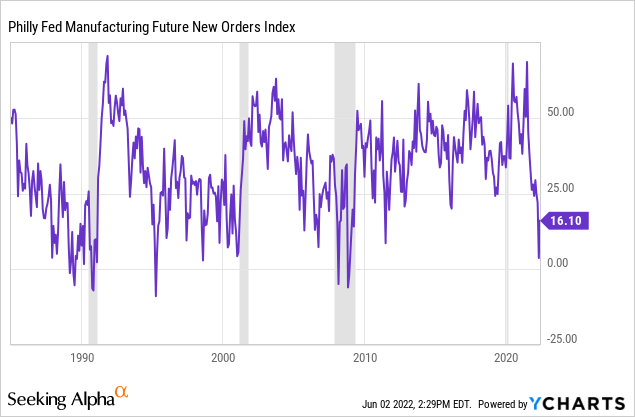
The Philly Fed Manufacturing Future New Orders Index is confirming slowing economic activity. Current levels are often associated with recession.
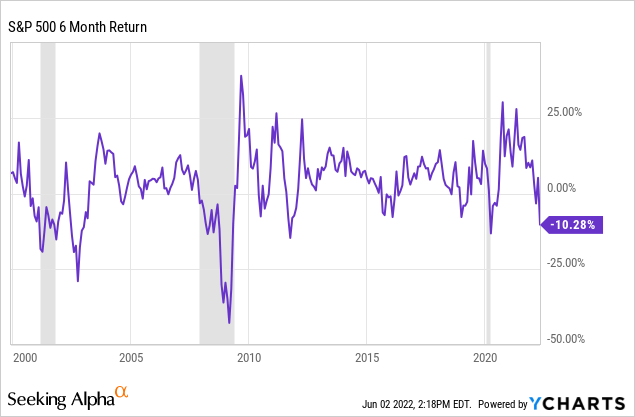
The S&P 500 has experienced a significant decline that nearly resulted in an official bear market condition. The 6-month return of -10.2% is low enough to correspond with recession. Until the Federal Reserve ends its monetary tightening policy I expect the S&P 500 to continue its decline which will help to confirm recession.
Two common precursors to recession are a rising oil price and yield curve inversion. Both conditions have taken place and are signaling with great probability that a recession follows.
Oil, Yield Curve Inversions, and Recessions (Charts by TradingView (adapted by Author))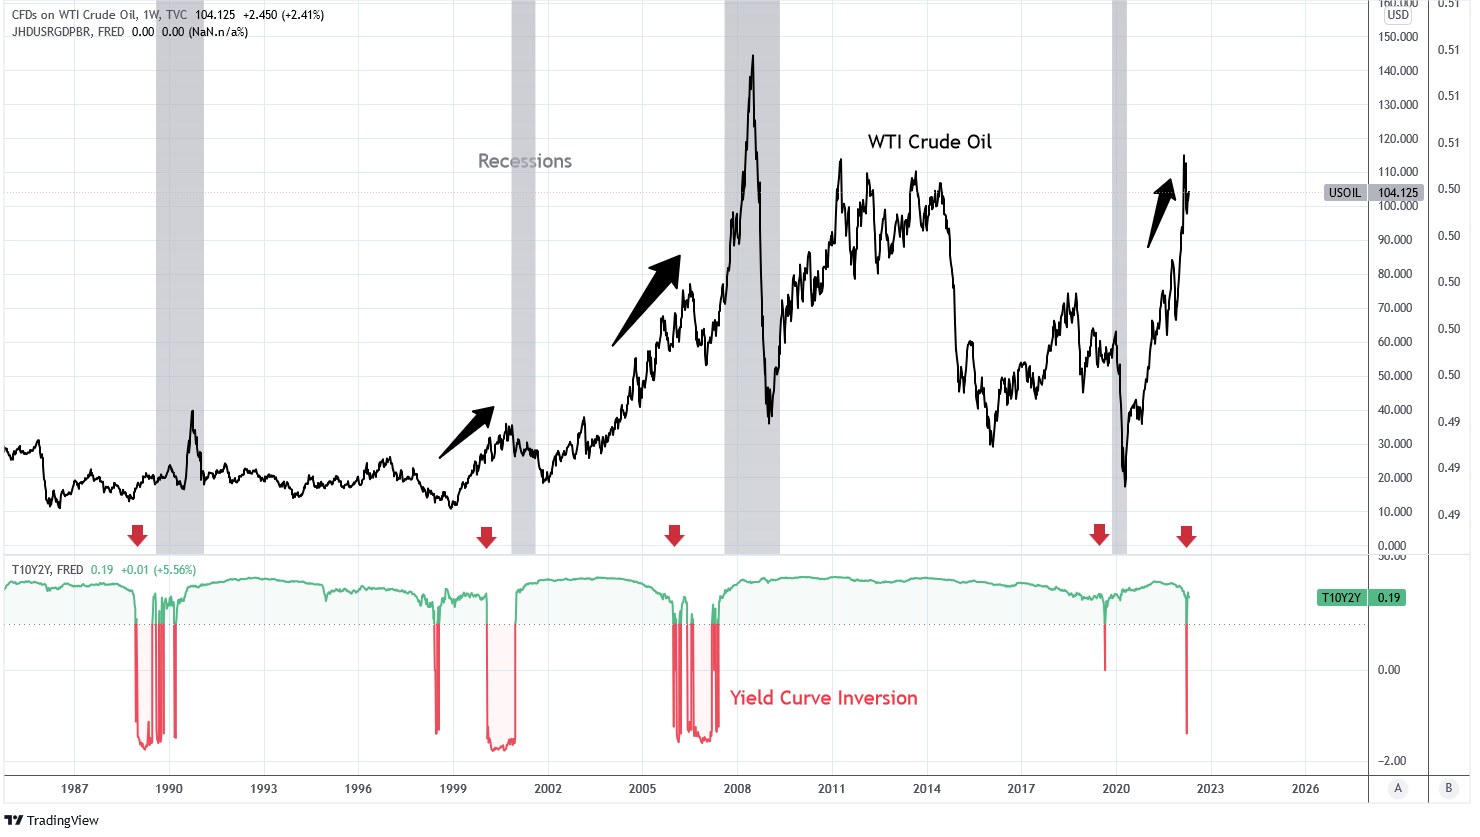
Perhaps all of this would not be so meaningful if the Federal Reserve was easing monetary policy to stimulate the economy. In reality, the Fed is doing the exact opposite. The Fed Funds Rate has been raised to 0.75% and further rate raises are expected. The Fed will begin Quantitative Tightening this month with $15 billion of Treasuries set to roll off by June 15.
Jay Powell, in an interview with the Wall Street Journal on May 17, said,”We know that this is a time for us to be tightly focused on the path ahead and on getting inflation back down to 2%.” Fed Vice Chair Lael Brainard recently stated “Right now it’s very hard to see the case for a pause. We’ve still got a lot of work to do to get inflation down to our 2% target.”
I’ll say.
I doubt the inflation rate can reach their target before the end of the year, mainly because oil keeps trending higher. Although I expect demand destruction to cause a fall in oil prices in Q4 2022 or Q1 2023 it won’t be soon enough to cure inflation before recession takes hold. With inflation stubbornly high and 4-6x their target, some speculate that the Fed won’t be finished with rate raises until non-farm payrolls record a negative print. By my deduction, that may be sooner than later.
Summary
For my final piece of evidence I present a Tweet from Jim Cramer on June 3:
I may be the only person besides Jay Powell who believes we are not going to have a recession. At least I hope Jay thinks that way!
And with that, I am confident that recession has already begun.
During an interview with Bloomberg Business Dawn Fitzpatrick, the CEO/CIO of Soros Fund Management, said “The bottom line is a recession is inevitable—it’s a matter of when…” While the line might be blurry I know a recession when I see one and I see one today.
Consumers are hanging on by their fingers. At some point I expect them to hit a “credit card wall” when borrowing becomes more difficult. This will accelerate economic contraction. The employment scales are beginning to tip and I expect it to gather momentum as consumers pull back and layoffs cause further consumer hardship.
I have no doubt that the Fed will intervene before the recession reaches its natural climax. The question simply is ‘when?’ I do not think the Fed will so easily pivot as it did in 2018 simply because equity markets are suffering. I think it will either take a potential disaster in credit markets or an actual turnaround in inflation.
Either way, recession is here to stay for the moment. I have prepared by raising my cash position, avoiding cyclical sectors like consumer discretionary and real estate which I have been shorting, and focusing on value dividend stocks for companies resistant to recession such as healthcare and telecommunications. I recently wrote an in-depth piece on the housing market which I expect to experience weakness going forward. I’m starting to look at bonds as a long idea although it’s probably too early at this point.
Be the first to comment