

The US economy is in uncharted territory. Although the BCI does not signal a recession this week, we need to know how the COVID-19 pandemic has, or has not, influenced the calculations. Table 1 list the economic data that the BCI uses and combines the components for the index in “real time” i.e. the data is only incorporated into the index at its publication date.
|
Table 1. The components of the BCI |
||
|
Validity Date |
Publication Date |
Economic Series |
|
3/25/2020 |
3/25/2020 |
10-year Treasury yield (daily) |
|
3/25/2020 |
3/25/2020 |
Three-month Treasury bill yield (daily) |
|
3/25/2020 |
3/25/2010 |
S&P 500 (daily) |
|
3/14/2020 |
3/26/2020 |
Continued Claims Seasonally Adjusted (weekly) |
|
2/14/2020 |
3/6/2020 |
All Employees: Total Private Industries (monthly) |
|
2/28 2020 |
3/24/2020 |
New houses for sale (monthly) |
|
2/28/2020 |
3/24/2020 |
New houses sold (monthly) |
From above table it is evident that the full effect of the COVID-19 pandemic on the BCI will only manifest itself after the March and April housing data is published. Today’s Unemployment Insurance Weekly Claims Report had an unprecedented high number of Initial Claims that will reflect in next week’s Continues Claims, which in turn will drive the BCI further down.
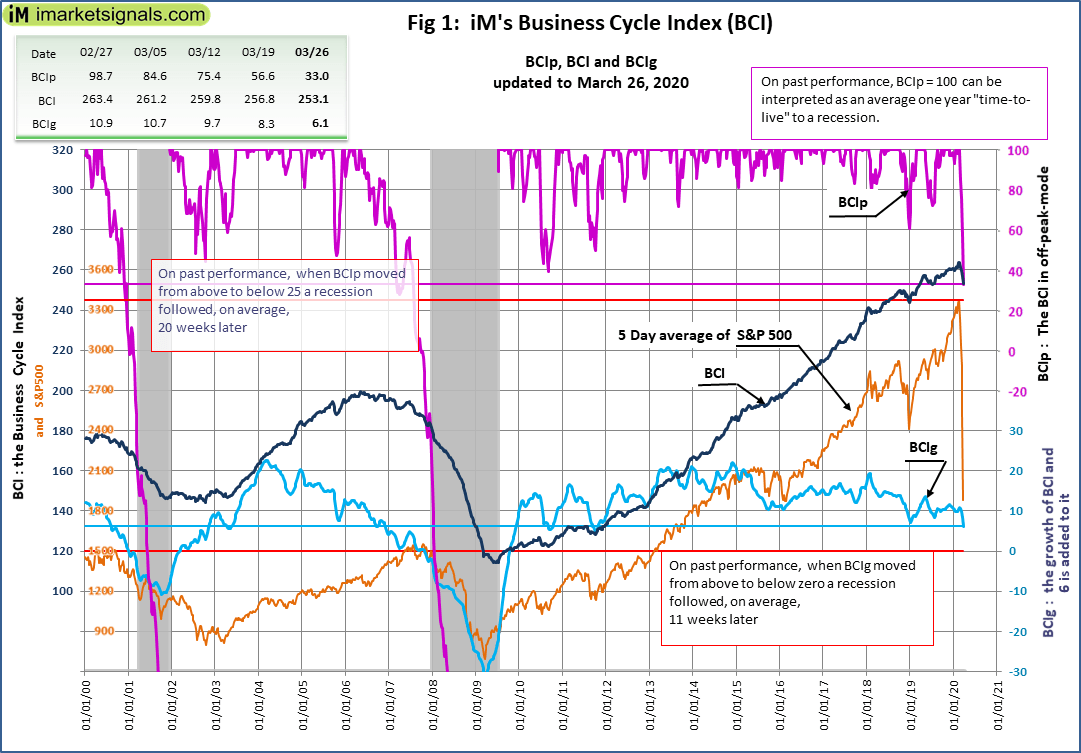
We thus can confidently state that BCIp (see the Figure 1 below) will move below 25 which under normal circumstance would have given us about 20 week lead to the recession that we may already have entered:
The Fed chair says the United States may be in a recession already.
Jerome H. Powell, the Federal Reserve chair, said during a rare television interview on Thursday that the United States “may well” be in a recession already, but that it should get the coronavirus under control before getting back to work. — The New York Times
The BCI at 253.1 is down from last week’s upward revised 256.8, and is below the previous high for this business cycle indicated by the BCIp of 33.0. Also, the 6-month smoothed annualized growth BCIg at 6.1 is down from last week’s upward revised 8.3. Under normal circumstances, both the BCIp and BCIg are not signaling a recession. (BCIp needs to drop below 25, or BCIg needs to drop to below zero).
Figure 1 plots BCIp, BCI, BCIg and the S&P 500 together with the thresholds (red lines) that need to be crossed to be able to call a recession.The BCI was designed for a timely signal before the beginning of a recession and could be used as a sell signal for ETFs that track the markets, like SPY, IWV, VTI, etc., and switch into Treasury bond ETFs, like IEF, TIP, BND, etc. (see our article).
The six-month smoothed annualized growth rate of the series is a well-established method to extract an indicator from the series. We use this method to obtain BCIg, i.e., the calculated growth rate with 6.0 added to it, which generates, on past performance, an average 11-week leading recession signal when BCIg falls below zero. Further, the index BCI retreats from its cyclical peak prior to a recession in a well-defined manner, allowing the extraction of the alternate indicator BCIp, a measure of the fall from the peak, from which, on average, a 20-week leading recession warning signal is generated when BCIp falls below 25.
Table 1 lists the weeks lead to recession would have provided by the warning signal, when the BCIp and BCIg fell below the respective trigger levels, to the start of the NBER recession.
|
Table 1: Weeks lead from warning signal to recession |
||||
|
BCIp |
BClg |
|||
|
Trigger Level |
25 |
12 |
0 |
0 |
|
Recession of |
Actual leads from historic data |
|||
|
1970 |
22 |
15 |
12 |
13 |
|
1973 |
22 |
15 |
15 |
12 |
|
1980 |
20 |
15 |
14 |
12 |
|
1981 |
12 |
10 |
9 |
5 |
|
1990 |
26 |
26 |
14 |
14 |
|
2001 |
17 |
14 |
12 |
12 |
|
2008 |
22 |
20 |
13 |
9 |
|
Average |
20 |
16 |
13 |
11 |
In Table 2 we record for each recession the pre-recession peak of the S&P500, the value on the day of the BCIg signal, and the subsequent lowest value of the inter-recession trough. From these we calculate the loss avoided by exiting the market on the day of the BCIg signal.
|
Table 2: Loss avoidance in SPY when exiting on BCIg recession warning. |
||||||||
|
Note |
1 |
2 |
3 |
4 |
5 |
6 |
7 |
8 |
|
Recession |
Peak |
Signal |
Trough |
(P-T)/P |
(S-T)/S |
(P-T) |
(S-T) |
(S-T)/(P-T) |
|
Jan-70 |
106.16 |
93.24 |
69.29 |
36.1% |
25.7% |
36.87 |
23.95 |
65.0% |
|
Dec-73 |
120.24 |
103.36 |
62.28 |
48.2% |
39.7% |
57.96 |
41.08 |
70.9% |
|
Feb-80 |
115.2 |
100.3 |
98.22 |
17.1% |
2.1% |
16.98 |
2.08 |
12.2% |
|
Aug-81 |
140.52 |
128.64 |
102.42 |
27.1% |
20.5% |
38.1 |
26.22 |
68.8% |
|
Aug-90 |
368.95 |
332.92 |
295.46 |
19.9% |
11.3% |
73.49 |
37.46 |
51.0% |
|
Apr-01 |
1520.77 |
1326.82 |
965.8 |
36.8% |
27.2% |
554.97 |
361.02 |
65.1% |
|
Jan-08 |
1565.15 |
1508.44 |
676.53 |
56.8% |
55.2% |
888.62 |
831.91 |
93.6% |
|
Average all recessions |
34.6% |
25.9% |
60.9% |
|||||
|
Column Notes:
|
||||||||
Following the signals from our recession indicator one would have avoided on average about 61% of the total market decline from pre-recession peaks to inter-recession troughs as indicated in the last column of Table 2. One can see in column 5 that exiting the market at the signal dates would have avoided losses averaging about 26%. Had one known the market peak, one could have avoided the 35% average decline as shown in column 4. Prior to the last recession the exit signal from BCIg occurred almost when the market peaked.
The historical values can be downloaded from iMarketSignals as an MS Excel sheet.
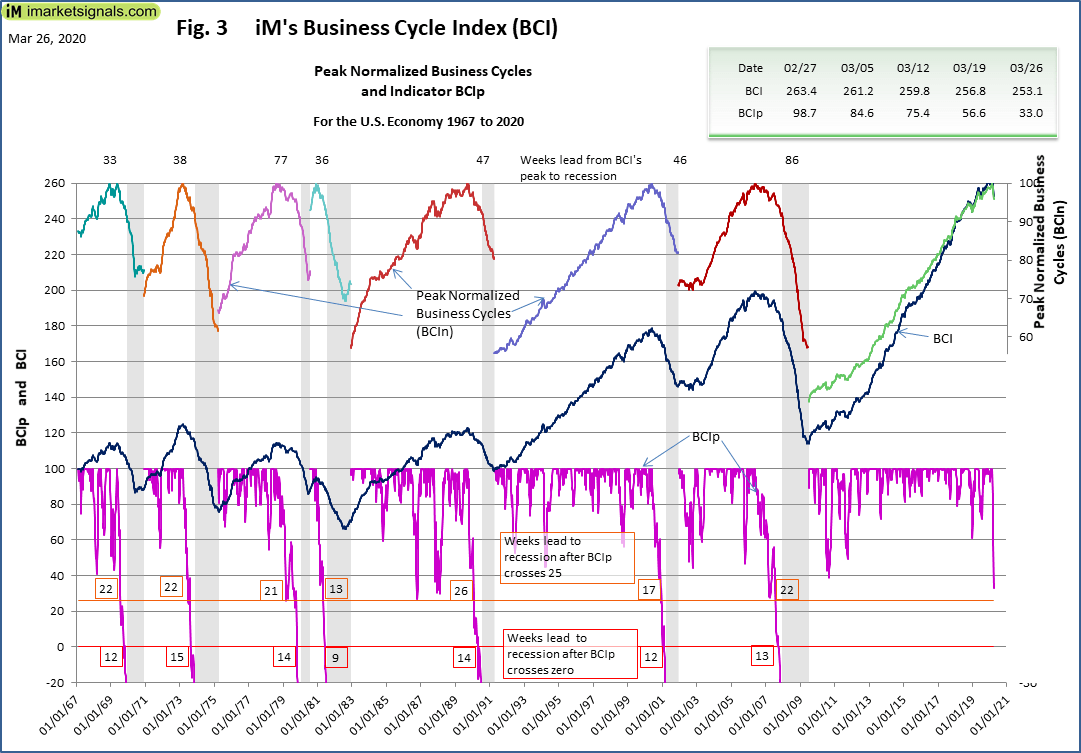
Figure 2 plots the history of BCI, BCIg and the LOG (S&P 500) since July 1967, and Figure 3 plots the history of BCIp, i.e., 46 years of history, which includes seven recessions, each of which the BCIg and BCIp managed to indicate timely; the weeks leading to a recession are indicated on the plots.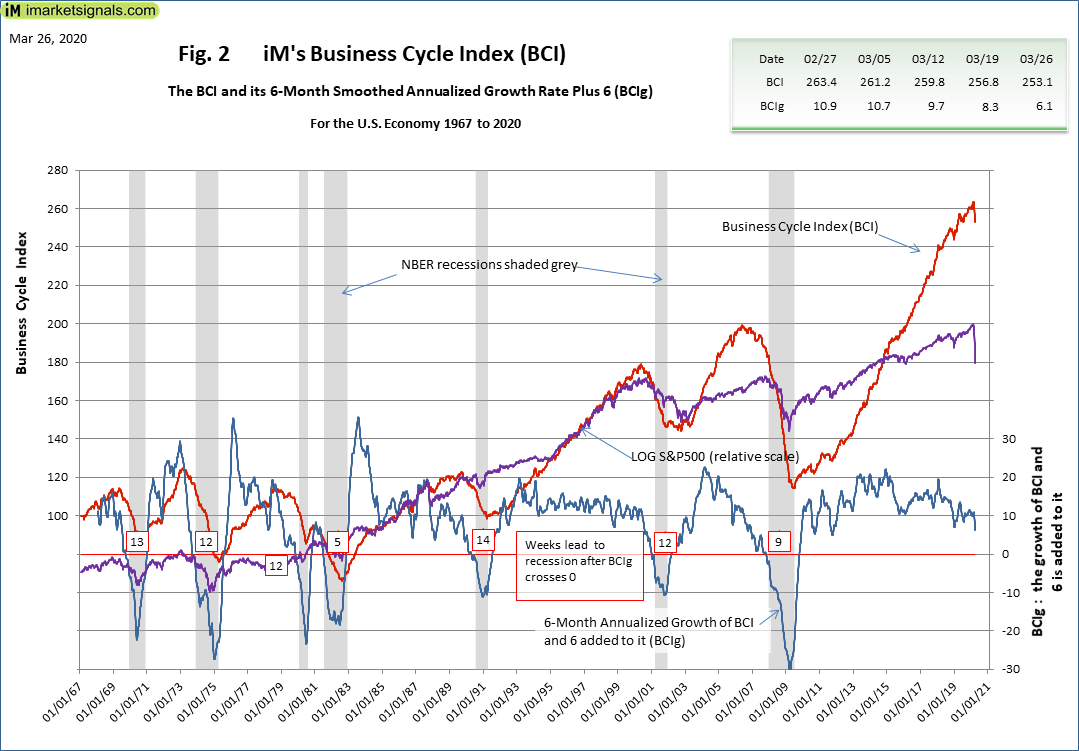
Disclosure: I/we have no positions in any stocks mentioned, and no plans to initiate any positions within the next 72 hours. I wrote this article myself, and it expresses my own opinions. I am not receiving compensation for it. I have no business relationship with any company whose stock is mentioned in this article.
Additional disclosure: Disclaimer: The information provided is based on a mathematical model using public available economic data, and is not biased by any opinions from ourselves or those expressed by others. The charts depict the results of our model and are not influenced by any other factors except the updated parameters which the model uses. You are cautioned that forward-looking statements, which are based on the model’s past performance, are subject to significant geopolitical, business, economic and competitive uncertainties and actual results could be materially different.
Be the first to comment