

AndreyPopov/iStock via Getty Images
Investment Thesis
The First Trust Rising Dividend Achievers ETF (NASDAQ:RDVY) may have had an excellent July, as expected, but it has since proven to be a mediocre investment. Familiar issues persist, including RDVY’s high 0.50% expense ratio and an overconcentration in just two sectors (Financials and Technology). However, more importantly, I’m still not seeing the necessary sparks for RDVY to become a top-performing dividend ETF like it was over much of the last nine years. This article provides an update on RDVY’s fundamentals and how its constituents are performing this earnings season. In addition, I’ll compare it to the much safer Schwab U.S. Dividend Equity ETF (SCHD) and argue why I think RDVY is too risky to own today.
RDVY Overview
Strategy, Sector Exposures, and Top Holdings
RDVY tracks the NASDAQ US Rising Dividend Achievers Index, selecting 50 companies whose trailing twelve-month dividends are higher than the previous three and five years. Qualifying companies must have higher earnings per share than three years ago, current cash to total debt ratios above 50%, and a dividend payout ratio less than 65%. As a result, it’s unlikely RDVY will ever have significant exposure to capital-intensive sectors like Utilities and Industrials. I’ve listed its sector exposures below compared to SPY and SCHD, courtesy of Morningstar.
Morningstar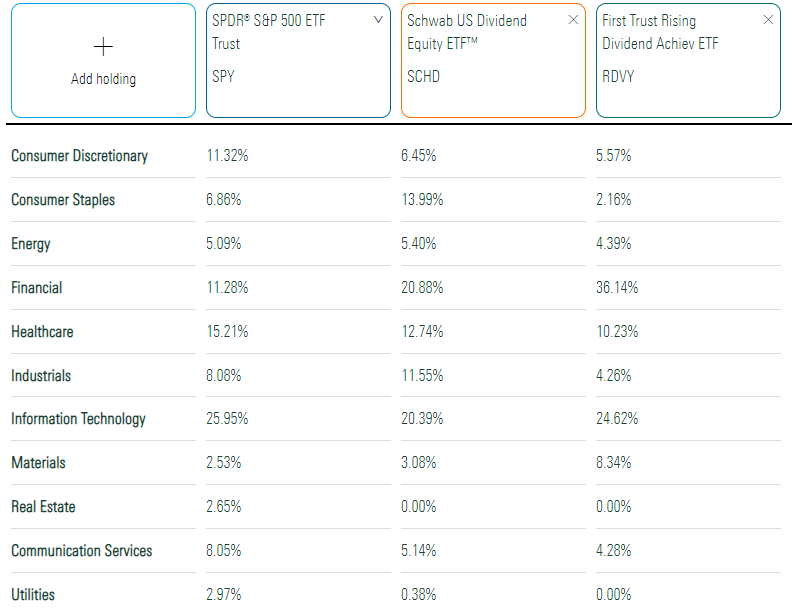
It’s challenging to find an appropriate peer for RDVY because it’s typically much more volatile than even SPY, let alone its dividend ETF peers. There are a few ETFs with close five-year betas, but they often select from a different size segment (SDVY, RNMC, RNSC). There’s also QDIV, which, according to FactSet, is the only dividend ETF with a fundamentals-based strategy that equal-weights its constituents. Unfortunately, with just $44 million in AUM, a 0.20% expense ratio, and relatively poor results after four years of trading, it’s probably in danger of being liquidated soon enough. Therefore, it’s safe to say RDVY is in a league of its own, and why it may be a nice complementary product even if you are concerned about its volatility.
The standout figure in the table above is RDVY’s 36.14% exposure to the Financials sector, broken down as follows:
- Consumer Finance: 7.83%
- Property & Casualty Insurance: 6.22%
- Diversified Banks: 5.99%
- Regional Banks: 5.97%
- Investment Banking & Brokerage: 5.87%
- Life & Health Insurance: 4.27%
These industries report earnings fairly early on. Last week concluded with JPMorgan Chase (JPM), US Bancorp (USB), and Morgan Stanley (MS), each reporting a positive earnings surprise. Bank of America (BAC), Goldman Sachs (GS), and Citizens Financial (CFG) followed earlier this week, and all told, these six companies had average sales and earnings surprises of 1.93% and 4.65%, respectively. It’s decent but no better than Q2’s 4.70% surprise for the sector. I’ve been looking for the downward trend in surprises to reverse for several quarters, as I believe it’s key to positive sentiment returning.
Yardeni Research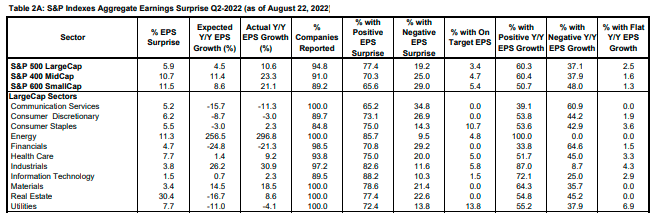
RDVY also has 24.62% exposure to Technology stocks, similar to SPY and SCHD. However, half of this is in Semiconductor and Semiconductor Equipment stocks like NVIDIA (NVDA) and Applied Materials (AMAT). These are more volatile than IBM (IBM) and Cisco Systems (CSCO), which SCHD overweights, and even Apple (AAPL) and Microsoft (MSFT), which SPY overweights. In short, it’s not just that RDVY selects more volatile sectors, but also volatile stocks within those sectors. Investors should be prepared for this risk and not think RDVY is safe because of its quality screens.
Finally, RDVY’s top 25 holdings are listed below. Because it’s an equal-weighted fund, all 50 holdings have around a 2% weighting. Stocks like EOG Resources (EOG) and Cummins (CMI) are only in the top positions because they have performed the best since the last rebalancing.
First Trust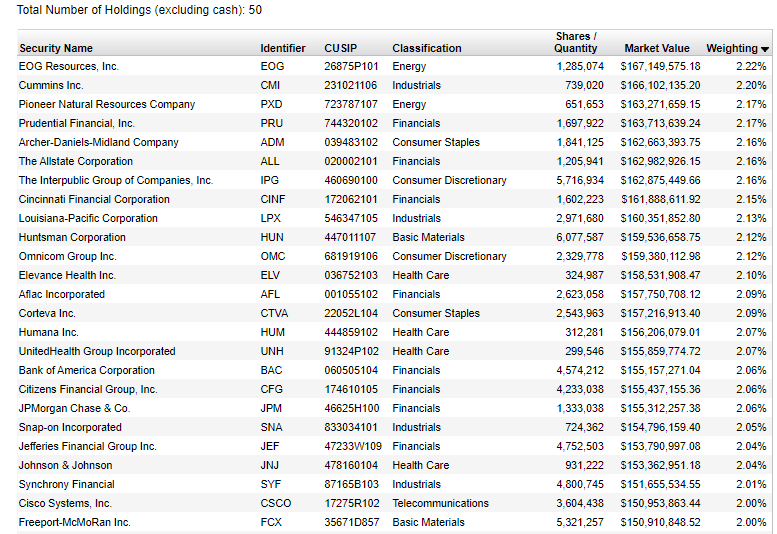
Performance, Fees, and Dividends
Since February 2014, RDVY has gained an annualized 10.86% compared to 11.48% and 10.69% for SCHD and SPY. These results are solid, but this table highlights the impact of RDVY’s higher volatility on its risk-adjusted returns (Sharpe and Sortino Ratios). Usually, dividend investors are more conservative and risk-averse, so these results may seem odd to some readers.
Portfolio Visualizer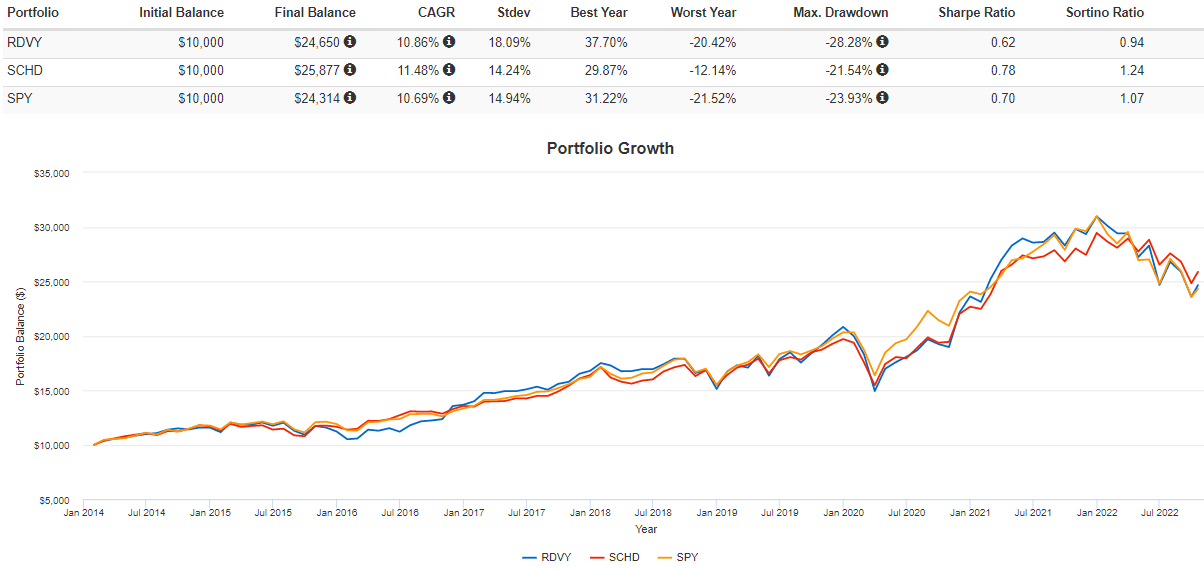
According to First Trust, RDVY gained an annualized 9.86% since its inception through September 2022. However, its benchmark Index gained 10.44%, and much of this 0.58% excess return is due to RDVY’s 0.50% expense ratio. These fees may be high to capitalize on the portfolio’s uniqueness. Still, there are only 13 other U.S. dividend equity ETFs with higher expense ratios, and five of them are offered by First Trust (FVD, SDVY, RNMC, RNSC, DDIV).
First Trust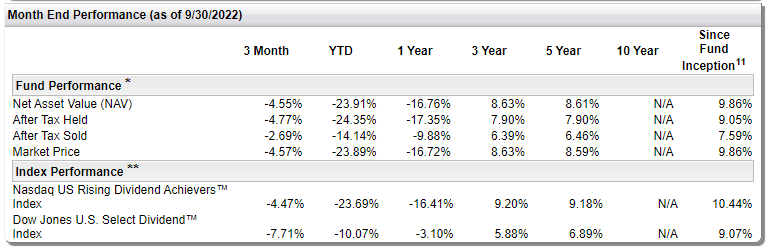
High fees impact RDVY’s distributions, too. Even though current constituents have a weighted-average trailing dividend yield of 2.57%, RDVY yields only 1.88%. This figure contributes to a relatively poor B- Dividend Grade provided by Seeking Alpha. However, RDVY’s 17.00% five-year dividend growth rate is terrific. I think double-digit growth should be achievable, given the focus on earnings, cash flow, and debt management.
Seeking Alpha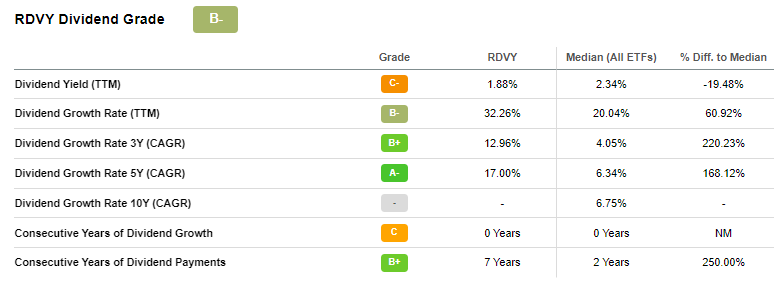
RDVY Analysis
Company Snapshot
The following table highlights selected fundamental metrics for RDVY’s top 25 holdings compared with SCHD. I consider SCHD an excellent benchmark for dividend investors, but it’s much different than RDVY. Look through the differences in concentration, volatility, growth, valuation, dividends, and profitability below, and I’ll offer my thoughts afterward.
The Sunday Investor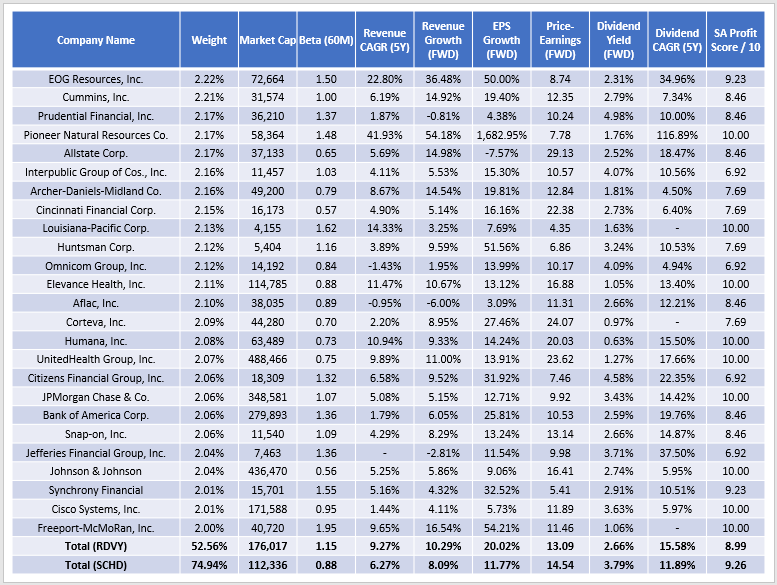
1. Due to its equal-weight strategy, RDVY only has a 52.56% concentration in its top 25 holdings compared to 74.94% for SCHD. These figures suggest RDVY is better diversified, but I don’t think it’s that simple. RDVY has a 96.39% concentration at the industry level in its top 25 compared to 91.18% for SCHD, which I think paints a more accurate picture. The reason is that RDVY’s holdings, heavily concentrated in just two sectors, are more likely to move in tandem and not offer many diversification benefits.
2. RDVY’s 1.15 five-year beta indicates much higher volatility than SCHD’s 0.88. Still, it’s down from 1.19 in July, primarily due to decreases in Oil & Gas E&P stocks like EOG and PXD and some Property & Casualty Insurance stocks like ALL and CINF.
3. RDVY’s growth potential is more substantial. Its constituents have raised revenue by 9.27% per year over the last five years, and analysts expect 10.29% growth over the next twelve months. These figures are 2-3% better than what SCHD offers. Moreover, RDVY’s high concentration in the Financials sector leads to an overall 20.02% estimated EPS growth rate compared to 11.77% for SCHD. Consumer Finance stocks look to be the key driver. American Express (AXP) is one company that hoped to reverse its sharp downward trend in earnings surprises. Though card member spending was up 30% in Q2 due to a strong recovery in the Travel & Entertainment category, analysts expected a significant increase in provision for losses in Q3 ($598 million vs. $410 million). Unfortunately, the figure turned out to be $778 million, and the stock is off 4% today as of this writing. Discover Financial Services (DFS), Synchrony Financial (SYF), and Capital One Financial (COF) are all scheduled to report next week.
4. RDVY and SCHD have attractive valuations, trading around 13-14x forward earnings. With a superior growth rate, RDVY is the better choice from a GARP perspective. However, it’s important to remember that RDVY doesn’t select based on relative value among sector peers. Financial stocks are often much cheaper than the broader market. For example, on average, RDVY’s 18 Financials stocks trade at 10.83x forward earnings. However, that’s less impressive when considering how the average Financials sector company in SPY trades at 14.24x forward earnings, and the average for the entire Index is 19.54x. Also, there are 66 Financials companies in SPY, third only to Industrials (71) and Technology (75), making it more likely these stocks will be selected for RDVY. In short, the Financials sector holds some comparative advantages that generally make it more attractive to rules-based portfolios.
5. RDVY’s constituents have raised dividends at an annualized 15.58% over the last five years, easily beating SCHD’s still-impressive 11.89% rate. There are a few outliers like PXD, but most constituents have double-digit growth rates, which is essential for investors wanting generous distributions in the future. Constituents currently yield 2.66% on a forward basis, but as discussed previously, net distributions should end up closer to 2% because of RDVY’s high fees. SCHD yields 3.79% and has an expense ratio of just 0.06%, so it will be nearly impossible for RDVY to close the total distribution gap anytime soon. Income investors are far better off with SCHD.
Earnings Season Update
Using a Q3 2022 earnings season start date of September 1, 70 S&P 500 companies have reported. Median sales and earnings surprises are an uninspiring 1.07% and 3.76%, respectively. For RDVY, 12/50 constituents have reported, with median sales and earnings surprises of 2.30% and 4.09%. Strong results posted by JPMorgan Chase (JPM) and Goldman Sachs (GS) contributed to these superior figures. Perhaps more important was JPM’s recent disclosure of a credit card delinquency rate of 0.69% in September compared to 1.14% in February 2020. A resilient consumer will be crucial in avoiding a painful recession.
Yield Curve Concerns
On the other hand, the yield curve remains inverted, with the 10Y/2Y spread currently at -0.34%. Historically, inverted yield curves precede recessions, as indicated in the graph below, and that’s concerning when considering adding a risky asset like RDVY.
St. Louis Federal Reserve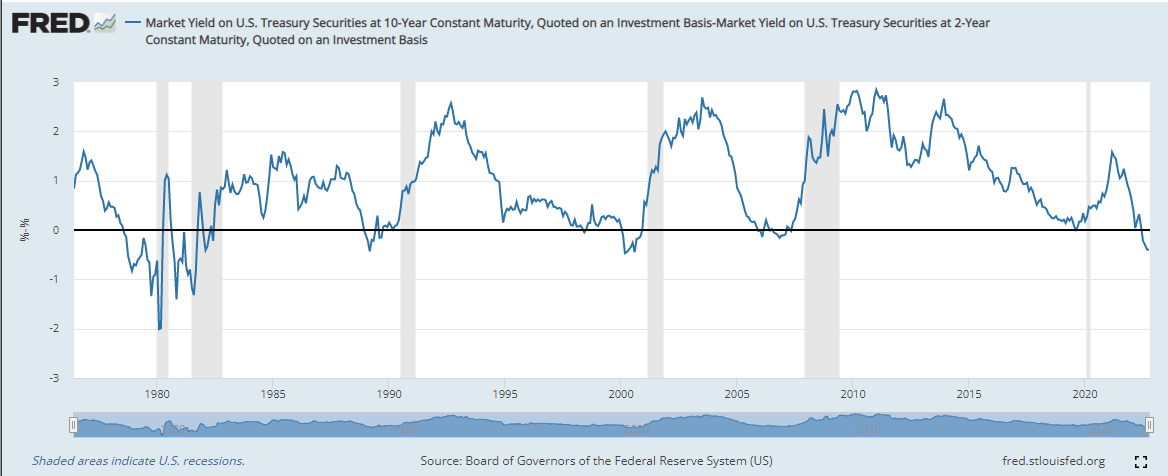
The Financial sector often bears the brunt in a recession. From February 2008-2009, RDVY’s current Financial holdings lost an average of 62.57% compared to 48.23% for SPY. The Financial Select SPDR Sector ETF (XLF) fared even worse at 72.86%, and the graph below highlights how these three portfolios are only off about 20-24% from February to September. In short, there’s likely much more room to fall in a recession, and RDVY isn’t in a good position to handle that.
Portfolio Visualizer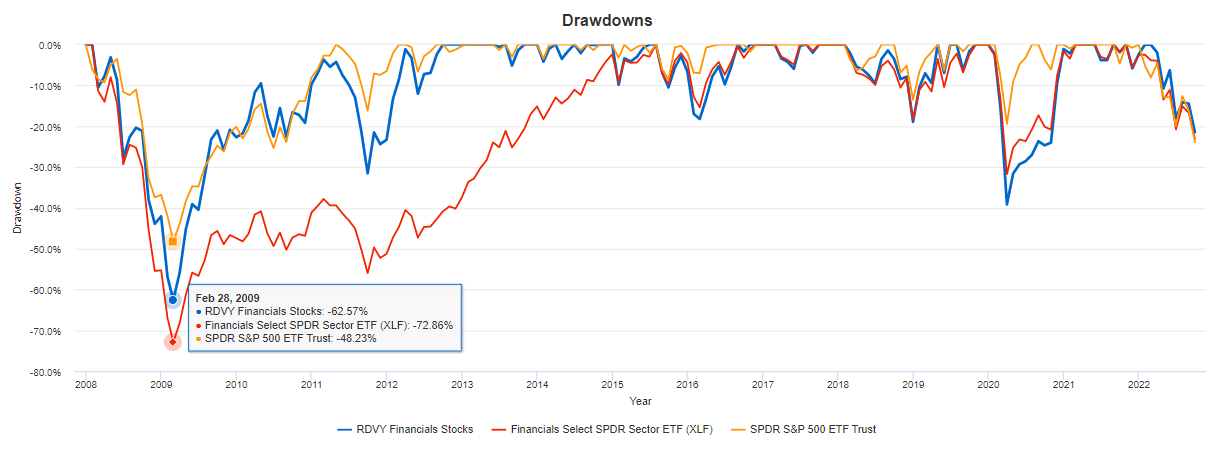
Investment Recommendation
RDVY is a fundamentals-based ETF that equal weights 50 U.S. companies exhibiting strong dividend and earnings growth but have low dividend payout and high cash to total debt ratios. The current portfolio is excellent from a GARP perspective, with constituents trading at just 13.09x forward earnings with estimated sales and earnings growth of 10.29% and 20.02%, respectively. However, RDVY is a much more volatile portfolio than dividend investors are used to, and it’s concentrated heavily in the Financial and Technology sectors.
These negatives are likely to prove harmful in a recession, which the yield curve supports and at least one U.S. think tank believes is a virtual certainty over the next year (96% probability). I view Q3 2022 earnings season surprises to date as only mildly positive relative to SPY, but are still trending downward, as they have been for over a year. Therefore, I don’t recommend adding an overly risky and concentrated asset like RDVY to your portfolio today, and I look forward to providing another update before the year closes.
Be the first to comment