


simonkr/E+ via Getty Images
Investment Summary
After a robust 2nd quarter, RadNet, Inc. (NASDAQ:RDNT) continued along its longer-term operating trends and fed substantial amounts of cash to and below the bottom line. RDNT presents with the desirable equity premia that investors are paying a premium for in FY22. We feel it is well positioned to benefit from industry tailwinds in the rebound from Covid-19, and given its offering within medical imaging, is well differentiated within the healthcare space.
Imaging ties into a multitude of medical and allied-health domains that extract countless sources of income. It is also a necessity of specialist medical treatment in almost all cases, and remains just about as defensive as it gets. Valuations suggest it is fair and reasonably priced at present, which is conducive to opening or reallocating RDNT to equity risk. On this, we rate RDNT a buy.
Exhibit 1. RDNT 6-month price action
Shares have caught a bid since July and crossed back up above key moving averages, indicating the market’s psychology around the stock
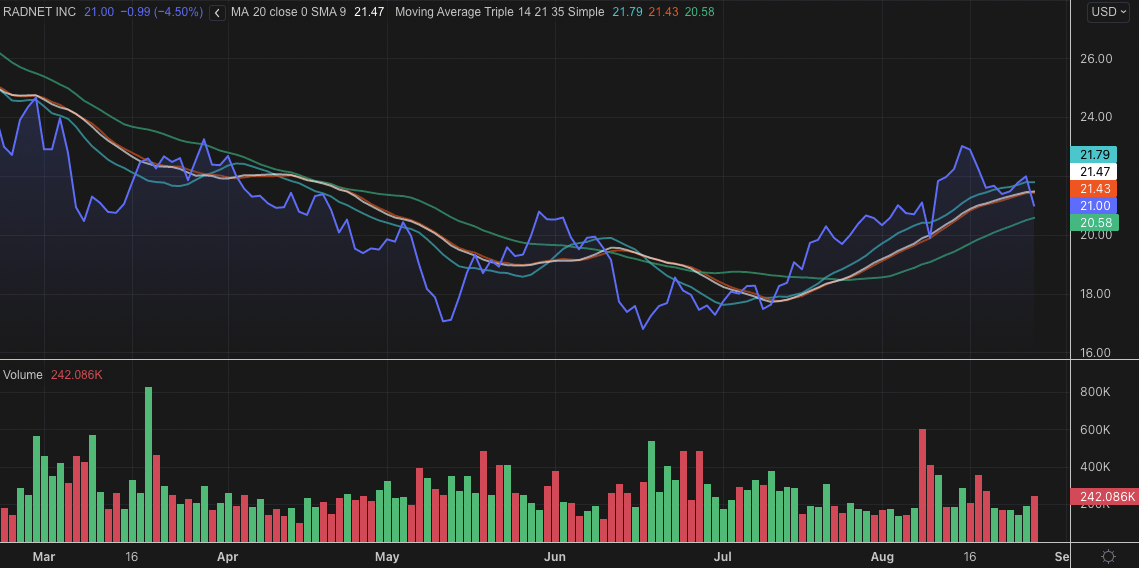
Data: Refinitiv Eikon
Q2 Earnings Strength On Full Display
Second quarter earnings came in strong, with upsides relative to consensus at the top and bottom line. Revenue came in to $354 million, up ~610bps, including booked turnover from its AI segment. Imaging centre revenue printed $352 million, up ~570bps YoY. As seen in Exhibit 2, growth was seen across most operating segments, with particular upside from workers compensation and commercial insurance. Meanwhile, software revenue slipped ~600bps YoY, whereas management fee revenue was flat YoY.
Exhibit 2. Growth exhibited across a broad spectrum of the portfolio, with single-digit declines in small segments.
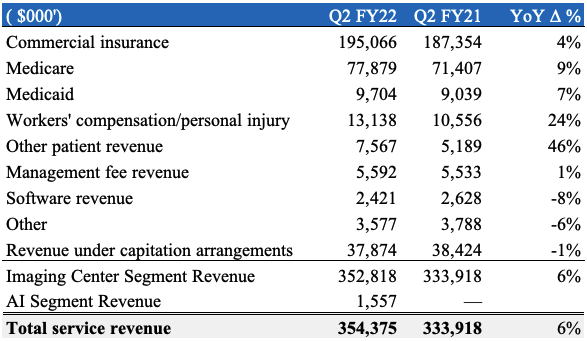
Data: RDNT Q2 FY22. Image: HB Insights US Equity Strategy
RDNT talks in terms of adjusted (non-GAAP) EBITDA as a measure of corporate performance, and it printed $51.3 million at this level when including losses from its AI segment, down from $56.6 million in FY21. On closer inspection, we feel this is a fair measure, with a few exceptions. The company reduced its spend on stock-based compensation by ~47% YoY to $4.7 million, although recognized ~$4.85 million additional non-cash depreciation expense. It also chose to expense a $6.3 million gain in the fair value of its interest rate swaps.
As seen in Exhibit 3, this is substantially higher than Q2 FY21, due to the pricing mechanics of the swap tilting in favour of RDNT over its counterparty. To explain, from ~FY19 to Q1 FY21 the company has realized a significant outflow tied to being on the downside of the swap. However, as one-month LIBOR and SOFR has tilted to the upside, this now favours RDNT in each of its swap agreements. It has $100 million of floating rate exposure at 1.96% and another $400 million at 2.05%, due October 2022 and October 2025 respectively. Each of these are now in the money. RDNT is now receiving a payoff from each of its swaps from counterparties, per the Q2 earnings call. Treating SBC as an expense across both periods, and removing the loss on debt restructuring from FY21 results, we see non-GAAP EBITDA of $47 million in Q2 FY22, up from $41.6 million in Q2 FY21.
Exhibit 3.
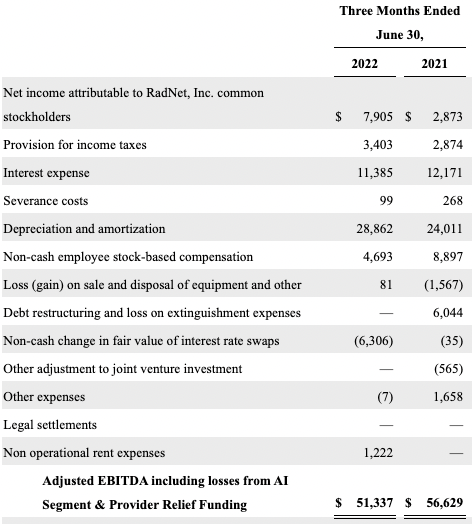
Data: RDNT 10-Q Q2 FY2022
Drilling down on specific operational data, findings show growth trends were positive over the 12 months. Routine imaging fed the bolus of procedure volumes, nearly 2.3 million in total. MRI and CT volumes lifted 770bps and 700bps respectively, whilst PET volume gained 10.4% YoY. When factoring in all imaging segments, volumes gained ~450bps YoY. The jump in numbers caused an asymmetry in accounts receivable relative to booked FY21 revenue, with accruals on trade accounts increasing $31 million to $166 million.
Despite the increase, days sales outstanding (“DSO”) has narrowed in to near-record lows for the company to ~39 days by the end of Q2 FY22. The improved result adds to an already impressive negative cash conversion cycle of 39 days. Translated, this means RDNT gets paid an average ~40 days before it performs the service tied to the revenue. With a bulk of its revenue stemming from insurance, workers’ comp and Medicare, this ensures the company will continue to receive favourable payments terms, getting paid ahead of completed service on average.
As a result, operating metrics remain an attractive feature for RDNT. As seen in Exhibit 4, the company continues to hold the Maginot line with its operating margin and pushed $28.7 million [$0.50/share] in FCF below the bottom line in Q2 FY22. Despite FCF yield narrowing in recent periods, this has occurred as RDNT’s return on investment has remained buoyant, as seen in Exhibit 5. This has enabled the company to invest capital at ~8.25% annualized return, a step above its WACC of 8.1%. RDNT therefore brings a deal of fundamental momentum into the forward-looking regime, and this is attractive to us as part of our US equity strategy.
Exhibit 4.
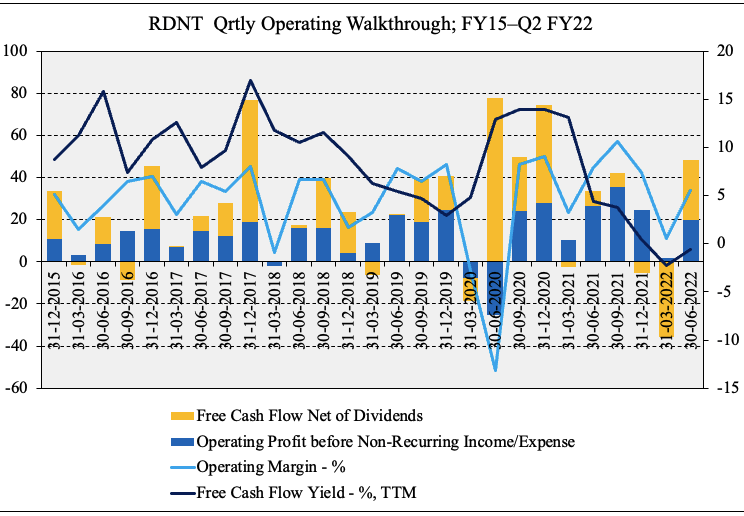
Data: RDNT SEC Filings; HB Insights
Exhibit 5. Return on investment trends continue to remain buoyant, if not seasonal.
Findings show that RDNT’s efforts in consistently growing NOPAT sequentially since FY15. It’s acquisition and growth strategy enables it to invest capital at ~2% per quarter [~8.25% annualized] on average – in line with its WACC of 8.1%.
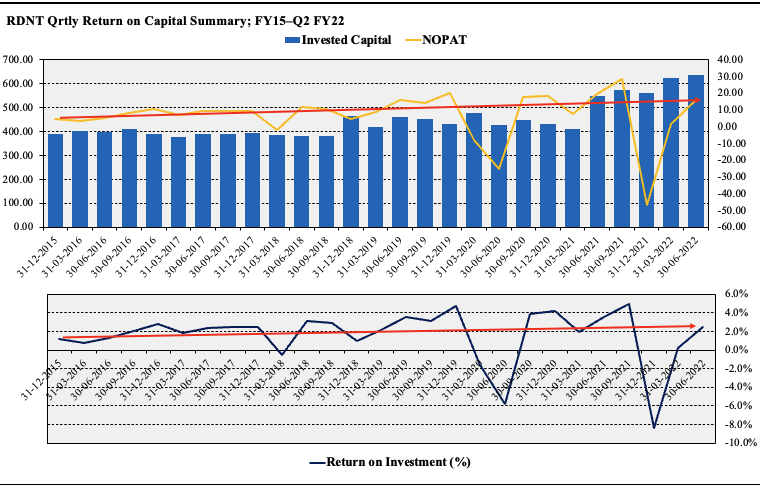
Image & Data: HB US Equity Strategy
Valuation
We’ve been obtaining respective upside in H2 FY22, tilting exposure to names that offer tangible sources of value in the valuation. This includes [aside from DCF valuation, but this is sensitive to rates at present] cash flow and book value/tangible book value. RDNT has negative tangible book value of equity, however, as a percentage of assets, goodwill, and intangibles remain below 40%, as seen below.
This is attractive to us, as compared to companies with similar business models in acquisitions and opening de novo locations, goodwill often skews the balance sheet. We believe the company continues to pay reasonable prices for its acquisitions, considering the percentage of goodwill it records on the balance sheet.
Exhibit 6. RDNT Asset Structure FY15–Q2 FY22
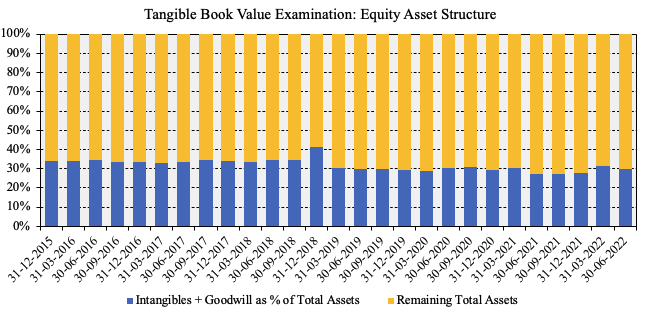
Data: HB Insights, RDNT SEC Filings
In this front, shares look fairly priced at ~2.7x book value, although RDNT is also priced at ~6x EV/book value of equity. If we were to pay this corporate value, we’d be theoretically paying $47 per share, a substantial premium.
We also note the investors’ FCF return on equity is only 3.3% on this valuation, widening the equity duration. At 25x forward FCF estimates of $47 million this prices RDNT at $21, and at 38x forward P/E, our FY23 EPS estimates price it at $22. Each of these suggest we could be paying a fair and reasonable price for entry and/or reallocation for RDNT to our equity risk.
Exhibit 7.
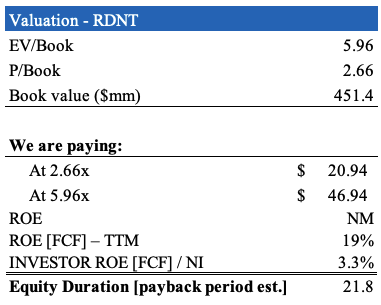
Data: HB Insights
In Short
We are bullish on RDNT shares and believe the stock will catch a bid amid a sectoral rotation into health care looking ahead. Investors are positioning towards defensive sectors like health care and rewarding bottom-line fundamentals within the space.
RDNT has several attractive features. Imaging is a multivariate service that ties into a multitude of medical and allied-health domains. It has countless referral sources and is a necessity of specialist medical treatment in almost all cases. RDNT presents with additional features, in that, on aggregate, it receives payment prior to service delivery. Shares also look fair and reasonably priced. We rate RDNT a buy.
Be the first to comment