

Adrian Vidal/iStock via Getty Images
The questions surrounding the viability of the Global X Nasdaq 100 Covered Call ETF (NASDAQ:QYLD) in a down market have undeniably been answered. A fair number of readers from my previous articles have been skeptical of QYLD’s double-digit yield and speculated that the fund wouldn’t hold up under the pressure of a down market. Many had indicated that the pandemic crash wasn’t a true resemblance of a bear market due to government intervention and the V-shaped recovery. By definition, a bear market is triggered when a stock or asset class falls 20% from its highs, and the Nasdaq fell into bear market territory in March of 2022.
QYLD is not an investment for someone looking for long-term capital appreciation from the fund’s share price. We’re not going to see QYLD keep pace with an S&P index fund or the Invesco QQQ ETF (QQQ) during periods of appreciation. QYLD’s covered-call methodology caps the fund’s upside potential, and individuals sacrifice potential future gains for immediate income. Since QYLD’s inception, its generated an impeccable track record of paying monthly distributions, which income investors can rely on. I have incorporated QYLD as an integral aspect of my dividend income stream. 2022 has been a horrific year as geopolitical tensions escalate and the war in Ukraine carries on. The markets have been volatile, and the Nasdaq briefly entered into bear market territory. The monthly distributions from QYLD continue to flow through thick and thin, lining income investor’s accounts with fresh income or an increased number of shares.
TradingView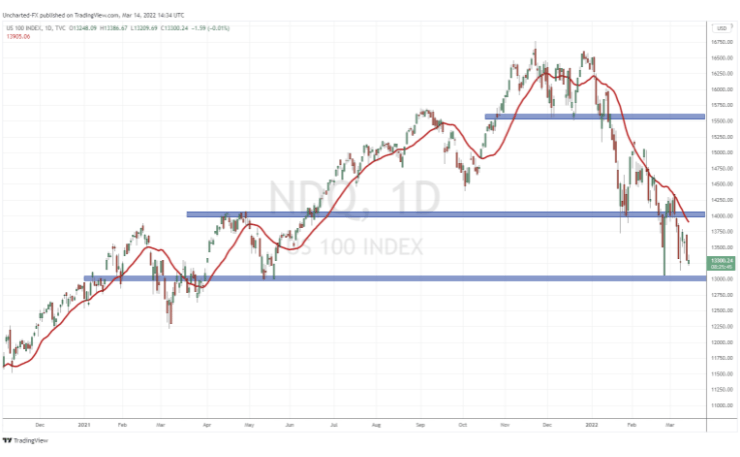
QYLD has declined less than the QQQ in 2022
The speculation was that due to QYLD’s covered-call structure, its share price would be more volatile during corrections. This assumption was entirely incorrect. The Nasdaq officially entered bear market territory in March of 2022, even if it was short-lived. Over the past three months, QYLD’s trend line has never crossed over QQQ’s. No matter what economic or geopolitical event occurred, QYLD held up better than the Nasdaq and better than the QQQ. For anyone who was worried about QYLD’s price not holding up against the respective index, all that needs to be studied is the correlation against the QQQ since 1/1/22.
Not only did an investment in QYLD hold up on a capital preservation aspect, but it delivered consistent income. QYLD has a 12-month trailing yield of 13.82%, while its forward yield is 11.84%. Since its inception, QYLD has paid 99 consecutive monthly distributions, solidifying its track record for consistency. An investment in QYLD isn’t for everyone but for investors seeking income, the speculation about QYLD’s reliability has been incorrect. Long-term investors have received consistent income throughout the pandemic, and the large double-digit yields have offset the price fluctuations in QYLD. An investment in QYLD isn’t focused on large amounts of capital appreciation. It’s predicated on reliable income, and QYLD’s covered-call strategy isn’t reliant on companies generating dividends or selling in and out of assets. I wrote my first article about QYLD on 8/8/21. Since then, investors have flocked to QYLD as a viable income option as its net assets have increased by 82.78% ($3.16 billion) from $3.81 billion to $6.97 billion.
Seeking Alpha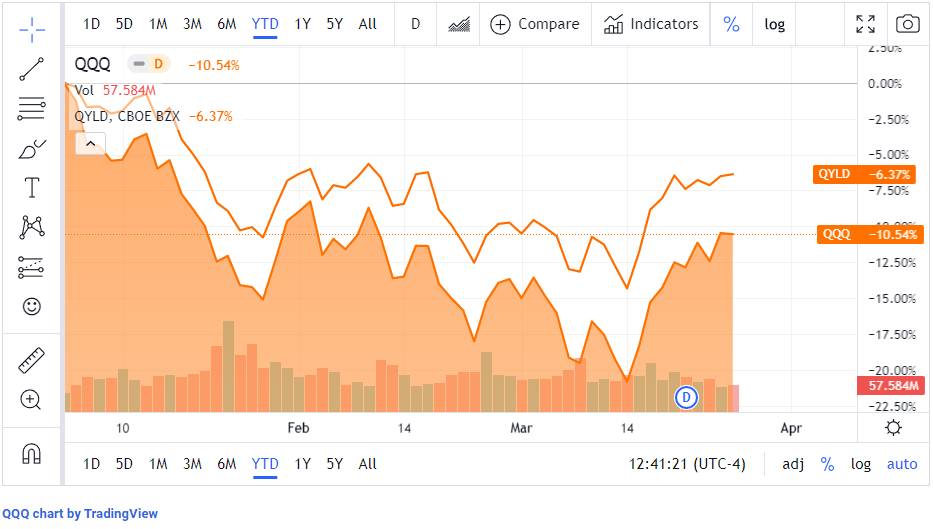
QYLD has an impressive track record of generating monthly income since 2014
Income investors care about generating income and preservation of capital. Investors are constantly obsessing over fluctuations in stock prices because there are constant reminders of the share price. When you own a business or an income-producing asset such as a rental property, you’re not constantly notified of the underlying asset’s pricing the way you are with owning stocks. Investors who own businesses and rental properties are more concerned with positive cash flow and profitability throughout the duration of the investment. The price of the asset becomes a concern when the investor is looking to sell the business or rental property. When the housing market goes through a downturn, do you run to sell your home the way you potentially would a stock? I look at income-producing assets much differently because their main focus is to produce consistent income and the fluctuations in price are a secondary concern. If you have a rental property for 20 years and for 20 years, it pays a desirable monthly income, does it really matter if the housing market experienced multiple downturns along the way? The answer for many is no because they bought this as an income-producing asset, and price fluctuations didn’t affect their cash flow.
Nasdaq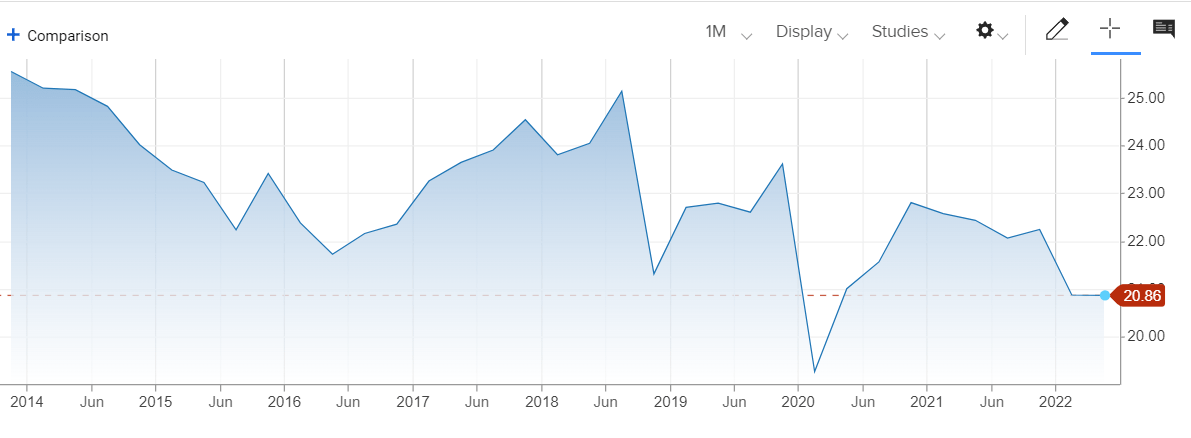
QYLD started trading at $25 per share back at the end of 2013. Since its inception, QYLD shares have lost $4.13 (16.52%) of their value. Prior to the recent downturn just 5-months ago, QYLD had only lost $2.16 per share or 8.64%. While this may not be appealing since bull markets have generated attractive gains for index funds, the declining share price doesn’t account for the amount of income shares of QYLD have generated. Here is how much income each share has generated since its inception:
- 2014 – $2.55
- 2015 – $2.18
- 2016 – $2.04
- 2017 – $1.88
- 2018 – $2.66
- 2019 – $2.35
- 2020 – $2.54
- 2021 – $2.84
- 2022 YTD – $0.61
Each share since QYLD’s inception has generated $19.68 in income. If an investor had purchased 100 shares of QYLD at $25 per share, the initial investment would have been $2,500. Over the years, $1,968 of the initial investment would have been generated from its distributions amounting to 78.72% of the initial investment. Based on today’s prices, the initial investment would have declined by $413, leaving you with 100 shares valued at $2,087. These shares are still producing double-digit yields, and you collected $1,968 in distributions along the way. When you net out the loss on the capital appreciation side, you are still ahead of the game by $1,555 or 62.2% while still having an income-producing asset. For all we know, the markets could rebound at the end of the year, and the $413 loss could be cut in half as more income is generated.
Global X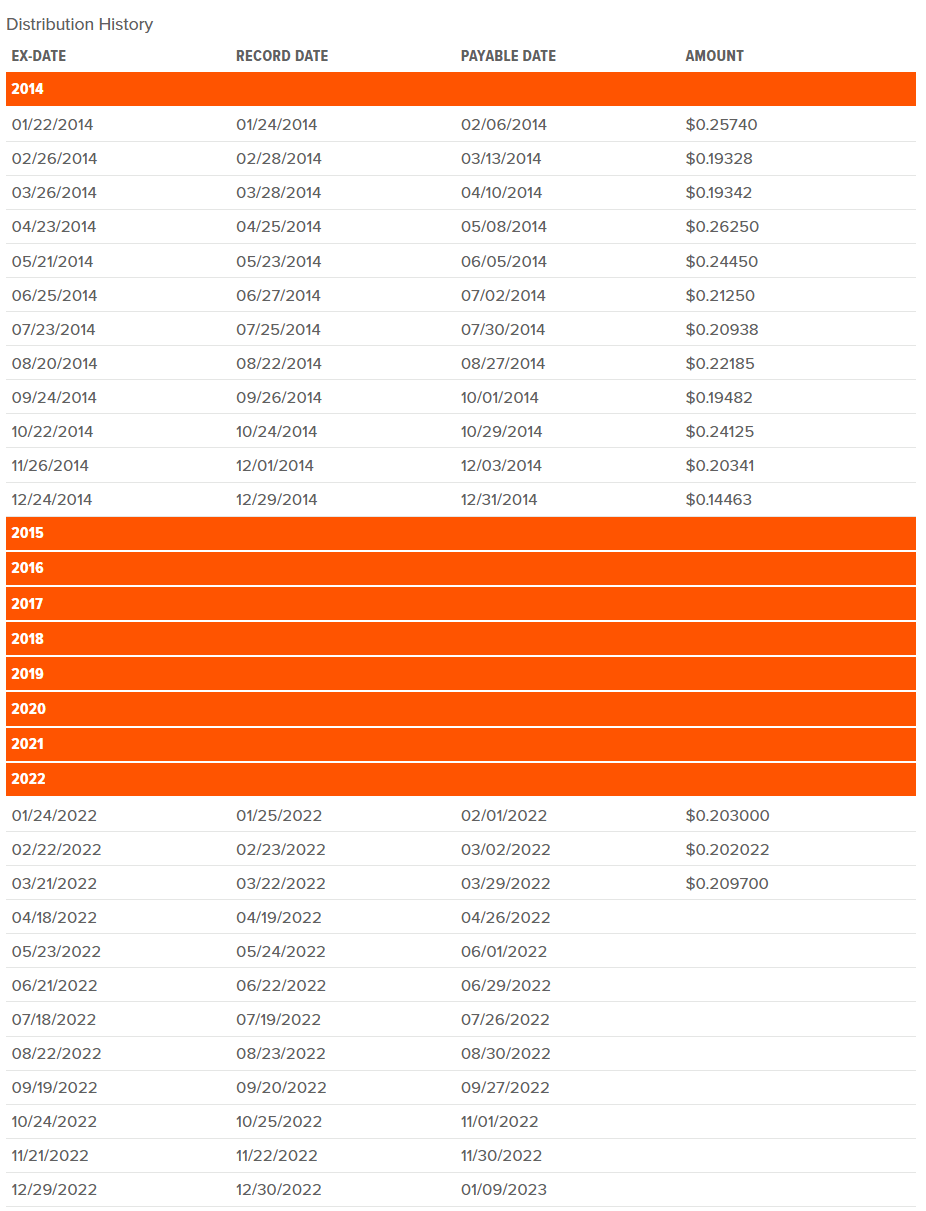
How has QYLD stacked up to its sibling funds RYLD and XYLD since 2020
Global X has also created other covered-call products, including the Global X S&P 500 Covered Call ETF (XYLD), the Global X Russell 2000 Covered Call ETF (RYLD), and the new Global X Dow 30 Covered Call ETF (DJIA). I have been keeping track of QYLD, RYLD, and XYLD and plan on adding DJIA after it establishes a track record. While QYLD and XYLD have been available to invest in since 2013, they didn’t become popular until recently. I am currently reinvesting the distributions, so I have been tracking them this way to see how these funds stack up to each other.
I have been using 100 shares as my subset for an initial investment on 1/4/21 for QYLD, XYLD, and RYLD. The only assumption I have made is for March 2022. The distribution in all three funds has been disclosed and is paid in a few days. I am using the closing price from Friday, 3/25/22, for each fund in this analysis.
Global X / Steven Fiorillo / Seeking Alpha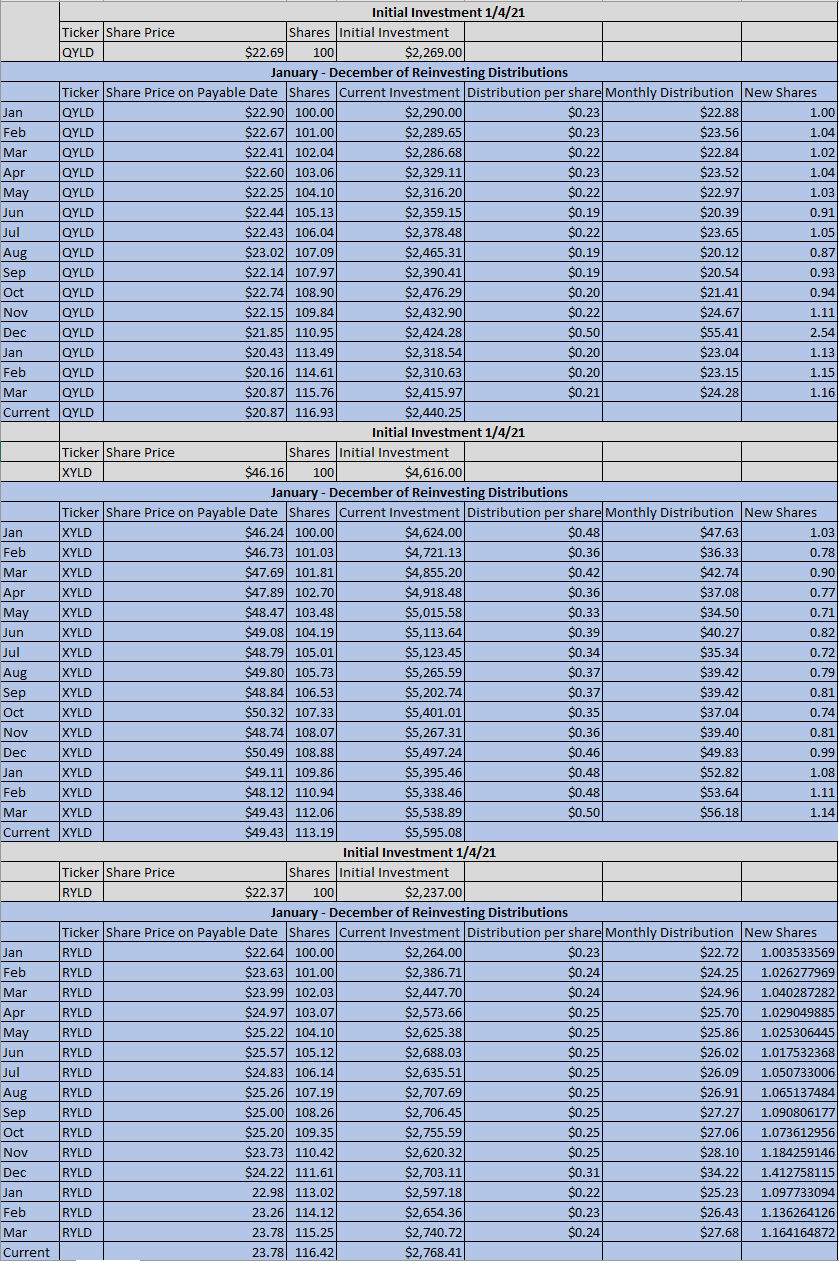
An initial investment for 100 shares of QYLD would have cost $2,269. Including my assumption for March 2022, you would have generated $372.43 in distributions over the past 15 months. By reinvesting the distributions, your current investment would be worth $2,440.25, leaving you with a profit of $171.25 and an ROI of 7.55%. The yield generated by the initial investment would be 16.41%, 16.93 new shares would have been generated, adding $42.65 in future annual distributions. Based on the current annual distribution, the future annual distributions would total $294.65 for a forward yield of 12.07%.
An initial investment for 100 shares of XYLD would have cost $4,616. Including my assumption for March 2022, you would have generated $641.66 in distributions over the past 15 months. By reinvesting the distributions, your current investment would be worth $5,595.08, leaving you with a profit of $979.08 and an ROI of 21.21%. The yield generated by the initial investment would be 13.9%, 13.19 new shares would have been generated, adding $63.19 in future annual distributions. Based on the current annual distribution, the future annual distributions would total $542.19 for a forward yield of 9.69%.
An initial investment for 100 shares of RYLD would have cost $2,237. Including my assumption for March 2022, you would have generated $398.48 in distributions over the past 15 months. By reinvesting the distributions, your current investment would be worth $2,768.41, leaving you with a profit of $531.41 and an ROI of 23.76%. The yield generated by the initial investment would be 17.81%, 16.42 new shares would have been generated, adding $49.25 in future annual distributions. Based on the current annual distribution, the future annual distributions would total $349.25 for a forward yield of 12.62%.
Seeking Alpha / Steven Fiorillo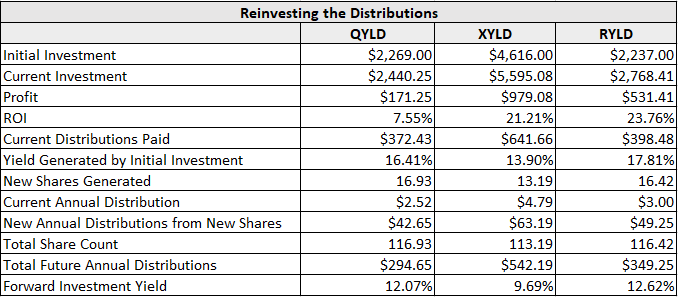
QYLD has been hit the hardest due to its correlation to the Nasdaq vs. the S&P or the Russell 2000 index. As it stands today, from the perspective of reinvesting the distributions, RYLD has been the best investment since the beginning of 2021 and would have the largest forward yield. I am invested in all three but based on the data, I am also adding to RYLD as it has just held up better during the past 15 months.
Conclusion
Since I first invested in QYLD I have been adding to my position every month. The Nasdaq officially entered a bear market for a brief period in 2022, which afforded investors with an opportunity to see how it holds up against its respective index during a correction. On a percentage basis, QYLD declined less than the QQQ, indicating that its covered-call strategy doesn’t add an additional liability during downtrends, and while the fund will follow the market, it isn’t subject to additional volatility. This has been a concern for readers of my QYLD articles, and the correlation between QYLD and QQQ clearly indicates that QYLD has held up better during the correction. QYLD has also generated consistent double-digit yields and has an impeccable track record of paying distributions for over 8 consecutive years. If you had invested in QYLD at its inception, each share would have generated $19.68 in income, offsetting the $4.13 downturn in its share price. Looking at the past 15 months using a methodology of reinvesting the distributions, XYLD and RYLD have both outperformed QYLD, and that should be something investors think about. I continue to purchase QYLD as I believe the Nasdaq will lead the markets higher over the next decade, but XYLD and RYLD have been better investments throughout the recent volatility. I am a buyer of all 3 funds and have been adding to RYLD recently as well. In the long run, my bull thesis hasn’t changed on QYLD, and I believe this is a strong investment for investors seeking consistent income.
Be the first to comment