

Ricky Howitt
In earlier articles published in 2019-20, I presented a strategy using the total US bond market return as market risk indicator. Here is a link to an article describing the strategy, and here is a link to a Portfolio Visualizer model implementing the strategy.
In this article I propose two improvements to the strategy:
Replace IEF with UUP as the “out of market asset” and Use “Quarterly Trading Frequency” instead of monthly trading frequency.
Additionally, I simplified the portfolio by using only the S&P 500 ETF (SPY) as a risk-on asset. Here is the link to the new model.
Simulation Results
The model was simulated over the time interval from January 2016 to October 2022.
The first table shows the summary performance of the two portfolios with quarterly trading.
Table 1. Summary Performance of Quarterly Trading Portfolios
|
Out of Market Asset |
CAGR |
stdev |
maxDD |
Sharpe Ratio |
Sortino Ratio |
|
IEF |
17.66% |
11.53% |
-15.68% |
1.39 |
2.93 |
|
UUP |
20.58% |
10.99% |
-6.38% |
1.68 |
3.92 |
All other things being equal, it is clear that using UUP as an out of market asset instead of IEF, improved the performance significantly. As shown in the table of annual returns, the difference was made in the 2022 bear market.
Table 2. Annual Returns of Portfolios with IEF or UUP as out of market asset
| Year | IEF | UUP |
| 2016 | 15.84% | 5.75% |
| 2017 | 16.08% | 12.68% |
| 2018 | 1.96% | 7.87% |
| 2019 | 31.22% | 31.22% |
| 2020 | 62.33% | 51.78% |
| 2021 | 21.74% | 17.44% |
| 2022 | -15.68% | 17.64% |
The following table shows the asset allocations for the model using IEF as out of market asset.
Portfolio Visualizer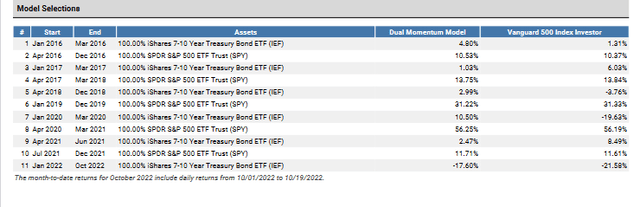
Following is a graph of portfolio growth for the IEF model.
Portfolio Visualizer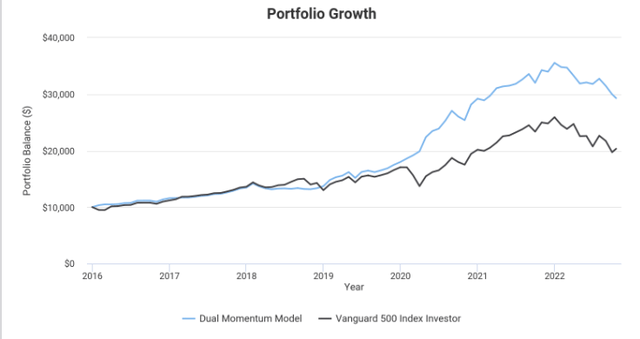
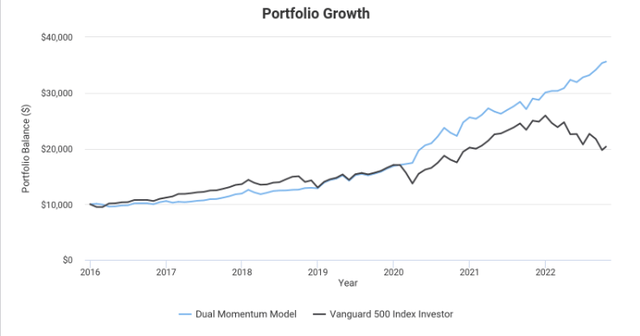
Next are the asset allocations and the portfolio growth for the model using UUP as out of market asset.
Portfolio Visualizer Portfolio Visualizer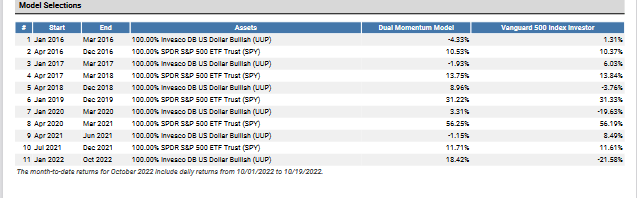
Market Direction
For the past week, the stock market has rallied. All the S&P 500 sectors have positive returns with higher returns for energy, financials, technology and consumer discretionary, and lower returns for “defensive sectors” such as consumer staples and utilities. These are all indications of a market in an uptrend.
Some investors may be inclined to go fully invested in equities to profit of the market rally. My stance is that because of the behavior of the bond market it is likely that, at best, we deal with a bear market rally.
The total bond market return has been in a downtrend since September 2021 and it shows no signs of reversal. This indicator has a reliable record in predicting the market behavior on quarterly time periods. For the conservative investors, the takeaway is to keep a low allocation to equities for the fourth quarter.
Conclusions
The Bond Market Indicator applied Quarterly with UUP as the safe or out of market asset continued working well for the past two years. Its risk-off stance starting in January 2022 has been the right choice if the out of market asset has been the US Dollar. The US Treasury Bond Funds have not worked well in 2022 as an out of market asset.
While the recent market equity gains may encourage some investors to increase their exposure to equities, I would limit that exposure to, at most, 50%. The Bond Market Indicator suggests a continuation of stocks sell-off.
Be the first to comment