

Marat Musabirov/iStock via Getty Images
Do you dream of retiring in comfort or even splendor? Who doesn’t?!
Do you wish your retirement standard of living could be 100% free from the market’s crazy gyrations? I know I do.
Does the idea of being able to count on steadily growing income in all market, economic, inflation, and interest rate conditions, sound appealing? It does to me.
Well then blue-chip dividend investing might be just what you’re looking for.
When you hear “dividend investing” you probably think of boring, mature, and stable businesses like Altria (MO), Verizon (VZ) or Pepsi (PEP).
And while those are indeed wonderful ways to earn generous, very safe, and steadily growing income today, if you want to maximize long-term retirement income there is no better way than combining high-yield and fast-growth.
Why? Let’s consider the examples of two fast-growing dividend chip stocks, QUALCOMM Incorporated (NASDAQ:QCOM) and NVIDIA Corporation (NASDAQ:NVDA).
Let’s see what happens when we combine high-yield with fast-growth.
Historical Total Returns Since 2011
Portfolio Visualizer Premium 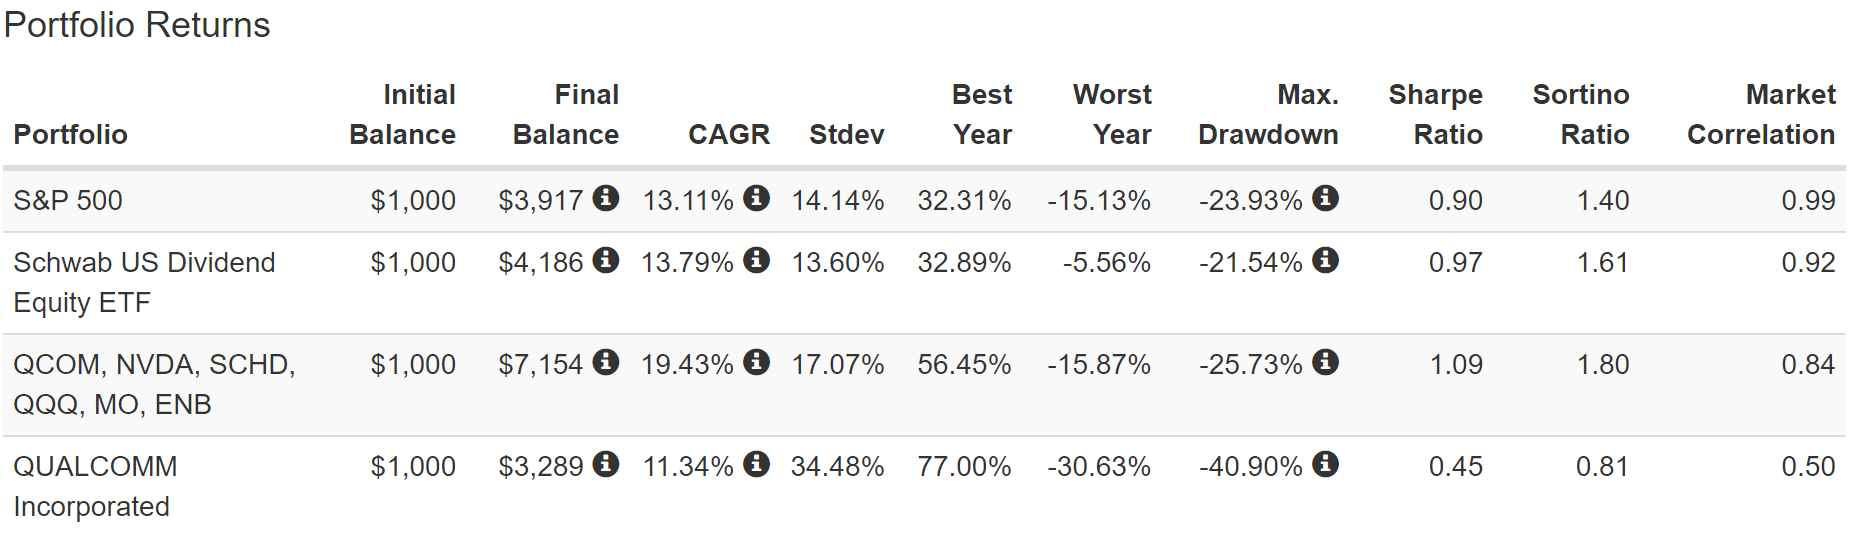
Combining the world’s best high-yield and growth exchange-traded funds (“ETFs”) with the growth and ultra-yield blue-chips created a far better performing portfolio over the last 11 years.
Portfolio Visualizer Premium 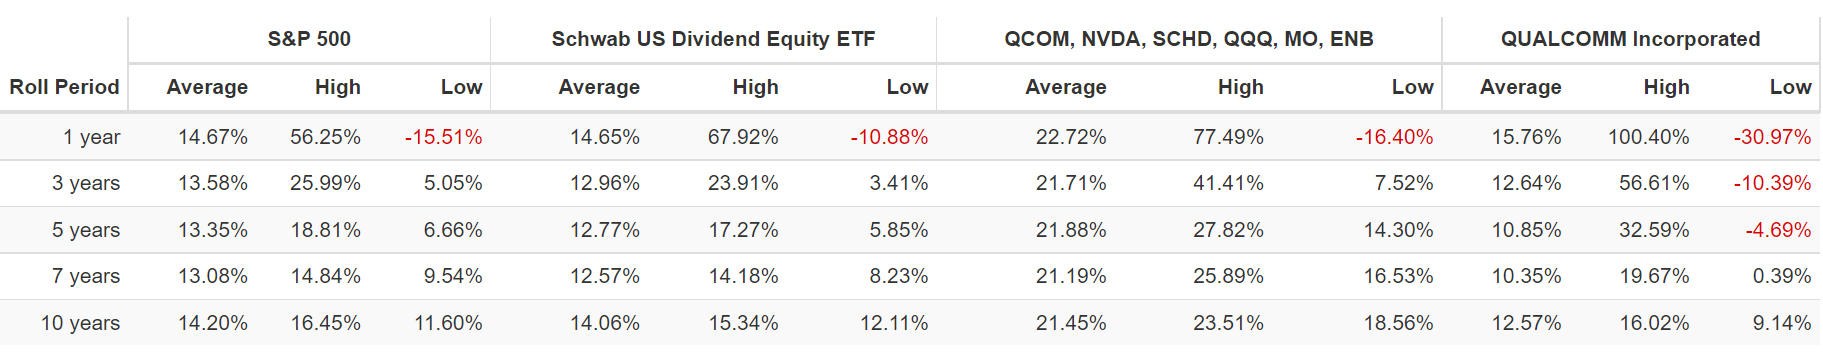
But more importantly for income investors, it also delivered superior income over time.
Income Growth Rich Retirement Dreams Are Made Of
Portfolio Visualizer Premium 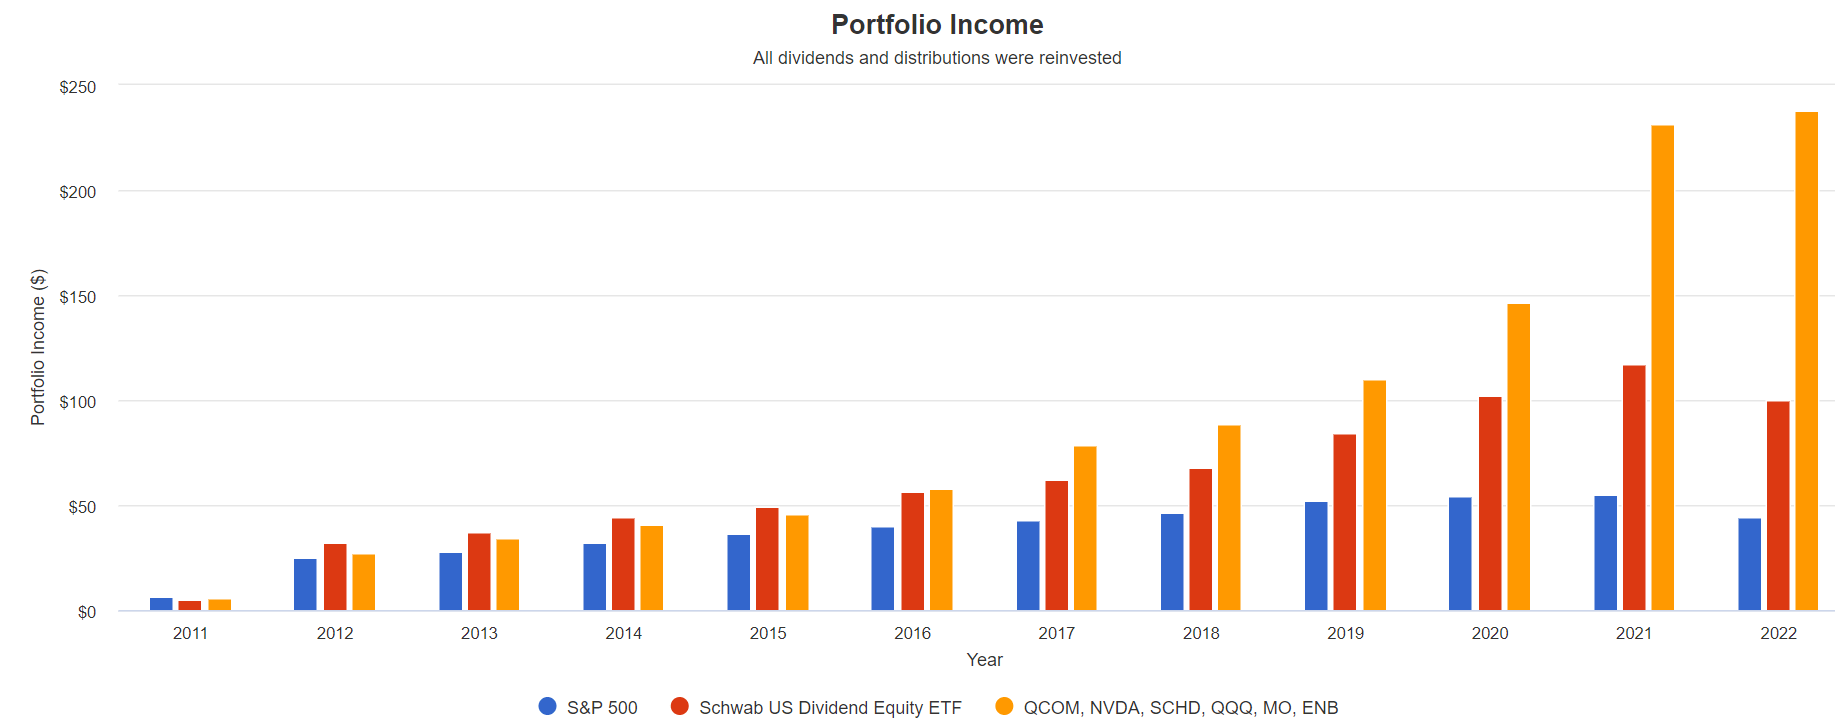
Cumulative Dividends Since 2012: Per $1,000 Initial Investment
| Metric | S&P 500 | SCHD | SCHD, QQQ, ENB, MO, NVDA, QCOM |
| Total Dividends | $471 | $785 | $1,177 |
| Total Inflation-Adjusted Dividends | $359.54 | $599.24 | $898.47 |
| Annualized Income Growth Rate | 9.0% | 15.3% | 27.9% |
| Total Income/Initial Investment % | 0.47 | 0.79 | 1.18 |
| Inflation-Adjusted Income/Initial Investment % | 0.36 | 0.60 | 0.90 |
| More Inflation-Adjusted Income Than S&P | NA | 1.67 | 2.50 |
| Starting Yield | 2.5% | 3.2% | 2.7% |
| Today’s Annual Dividend Return On Your Starting Investment (Yield On Cost) | 5.9% | 13.3% | 31.7% |
| 2022 Inflation-Adjusted Annual Dividend Return On Your Starting Investment (Inflation-Adjusted Yield On Cost) | 4.5% | 10.2% | 24.2% |
(Source: Portfolio Visualizer Premium)
By combining yield and growth over the last 10 year income investors have enjoyed 28% annual income growth, 2X better than Schwab U.S. Dividend Equity ETF (SCHD), and 3X better than the S&P 500 (SP500).
They’ve gotten back 90% of their initial investment in inflation-adjusted dividends, and enjoyed 2.5X more income than the S&P 500 and 50% more income than SCHD alone.
And for every $1 invested in 2011 they are now getting $.24 in annual inflation-adjusted dividends, and that’s growing exponentially each year.
- SCHD investors are getting $0.1 in annual income per $1 investment
- S&P 500 investors $0.05.
Ok, so that’s fine for those with 10+ years to invest, but surely retirees should stick to high-yield only right? WRONG!
Unless you expect to drop dead in 10 years let’s not forget that retirements last a long time.
Hamilton Project 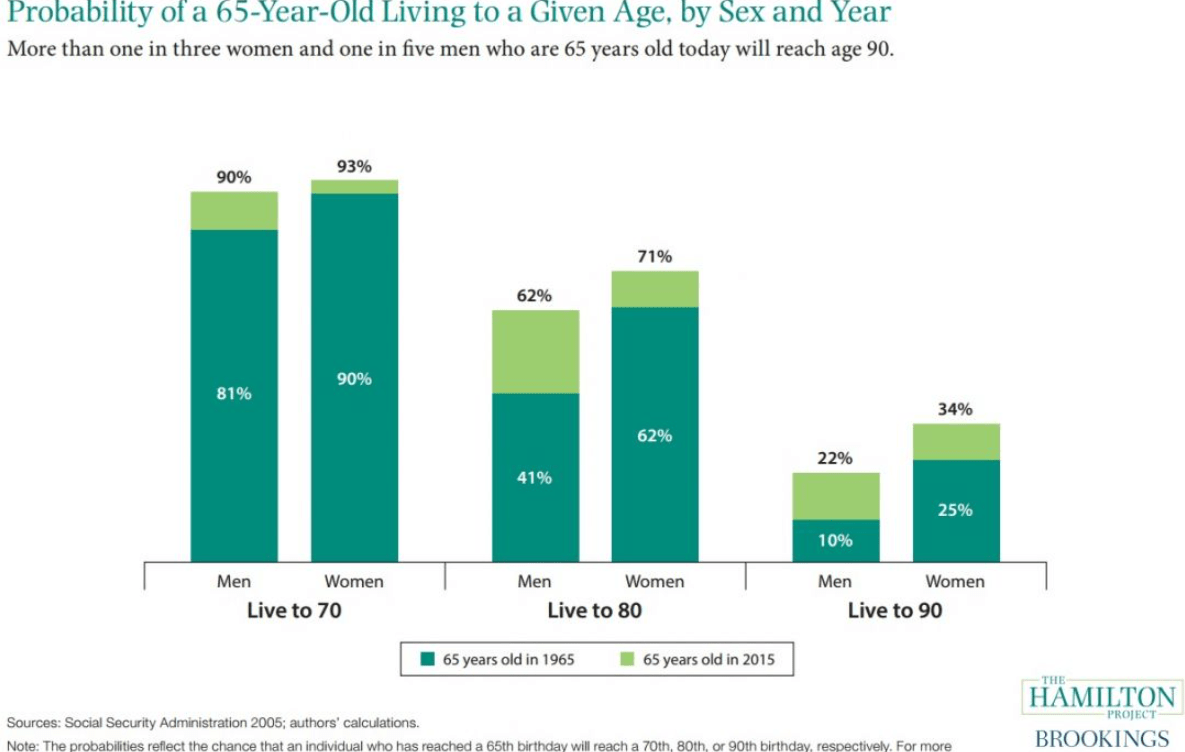
22% of U.S. men can expect to live to 90 and 34% of woman.
In other words, even if you’re already retired chances are very good that you have a 10+ year, or even 30 to 40 year time horizon.
And that’s where the power of fast dividend compounding really shines.
How powerful is hyper-dividend compounding over 35 years?
MO + LOW Cumulative Dividends Since 1985 Per $1,000 Initial Investment
| Metric | Altria | Lowe’s | Altria + Lowe’s |
| Total Dividends | $282,584 | $37,611 | $286,519 |
| Total Inflation-Adjusted Dividends | $100,563.70 | $13,384.70 | $101,964.06 |
| Annualized Income Growth Rate | 18.8% | 18.2% | 21.7% |
| Total Income/Initial Investment % | 282.58 | 37.61 | 286.52 |
| Inflation-Adjusted Income/Initial Investment % | 100.56 | 13.38 | 101.96 |
| More Inflation-Adjusted Income Than Altria | NA | 0.13 | 1.01 |
| Starting Yield | 4.8% | 1.4% | 3.0% |
| Today’s Annual Dividend Return On Your Starting Investment (Yield On Cost) | 2774.0% | 682.5% | 4350.4% |
| Today’s Inflation-Adjusted Annual Dividend Return On Your Starting Investment (Inflation-Adjusted Yield On Cost) | 987.2% | 242.9% | 1548.2% |
(Source: Portfolio Visualizer Premium)
You can enjoy 100X your initial investment in inflation-adjusted income and achieve truly mind boggling income by combining ultra-yield with hyper-dividend growth.
And guess what? Combining yield + hyper-growth, even without dividends can be even more powerful.
MO + AMZN Cumulative Dividends Since 1998 Per $1,000 Initial Investment
| Metric | Altria | Altria + Amazon |
| Total Dividends | $3,034.00 | $101,408.00 |
| Total Inflation-Adjusted Dividends | $1,657.92 | $55,414.21 |
| Annualized Income Growth Rate | 3.31% | 27.96% |
| Total Income/Initial Investment % | 3.034 | 101.408 |
| Inflation-Adjusted Income/Initial Investment % | 1.657923497 | 55.41420765 |
| More Inflation-Adjusted Income Than Altria | NA | 33.4 |
| Starting Yield | 3.80% | 4.10% |
| Today’s Annual Dividend Return On Your Starting Investment (Yield On Cost) | 8.30% | 1523.50% |
| 2022 Inflation-Adjusted Annual Dividend Return On Your Starting Investment (Inflation-Adjusted Yield On Cost) | 4.54% | 832.51% |
(Source: Portfolio Visualizer Premium) MO’s dividend growth is low because of the 2007 and 2008 spin-offs.
Had you bought both AMZN and MO back in 1997, reinvested dividends, and rebalanced annually, today you’ve received 33X more inflation-adjusted income over the last 24 years.
28% annual income growth means a 208X higher inflation-adjusted yield on cost.
Income growth over time tends to track total returns, so you want to make sure that you’re dividend portfolio is likely to generate strong returns. Not just to keep up with inflation (2.3% long-term according to the bond market).
You want your standard of living to keep rising in retirement, no matter how long you live.
And that’s where growth stocks like QCOM and NVDA can help.
Several members have asked for an update on those chip titans and after carefully examining both companies most recent fundamentals I have come to a surprising conclusion.
At the moment, Nvidia is the far better chip dividend stock to buy, for anyone looking to maximize long-term income. Let me show you why.
Qualcomm: A Wonderful World-Beater Facing A Slower Growth Future
Ycharts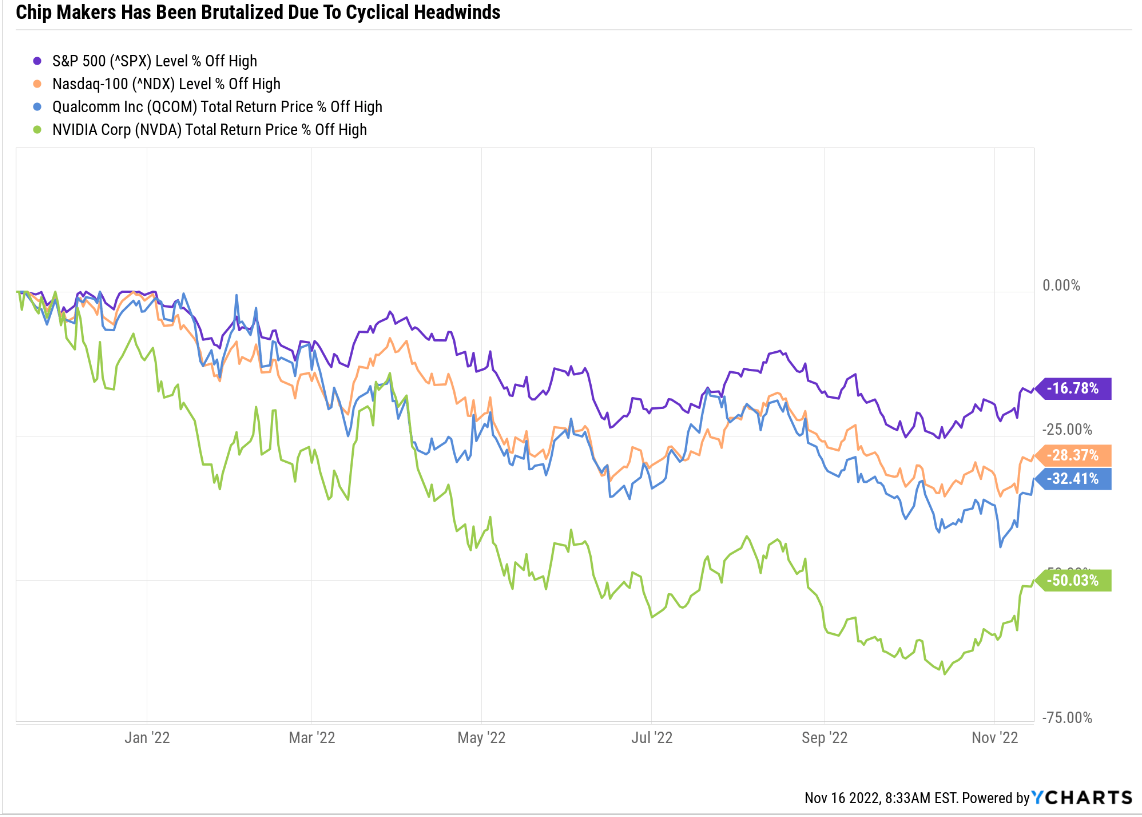
Chip makers are up 26% in the last month, though that’s only after getting crushed in a ferocious bear market.
Portfolio Visualizer Premium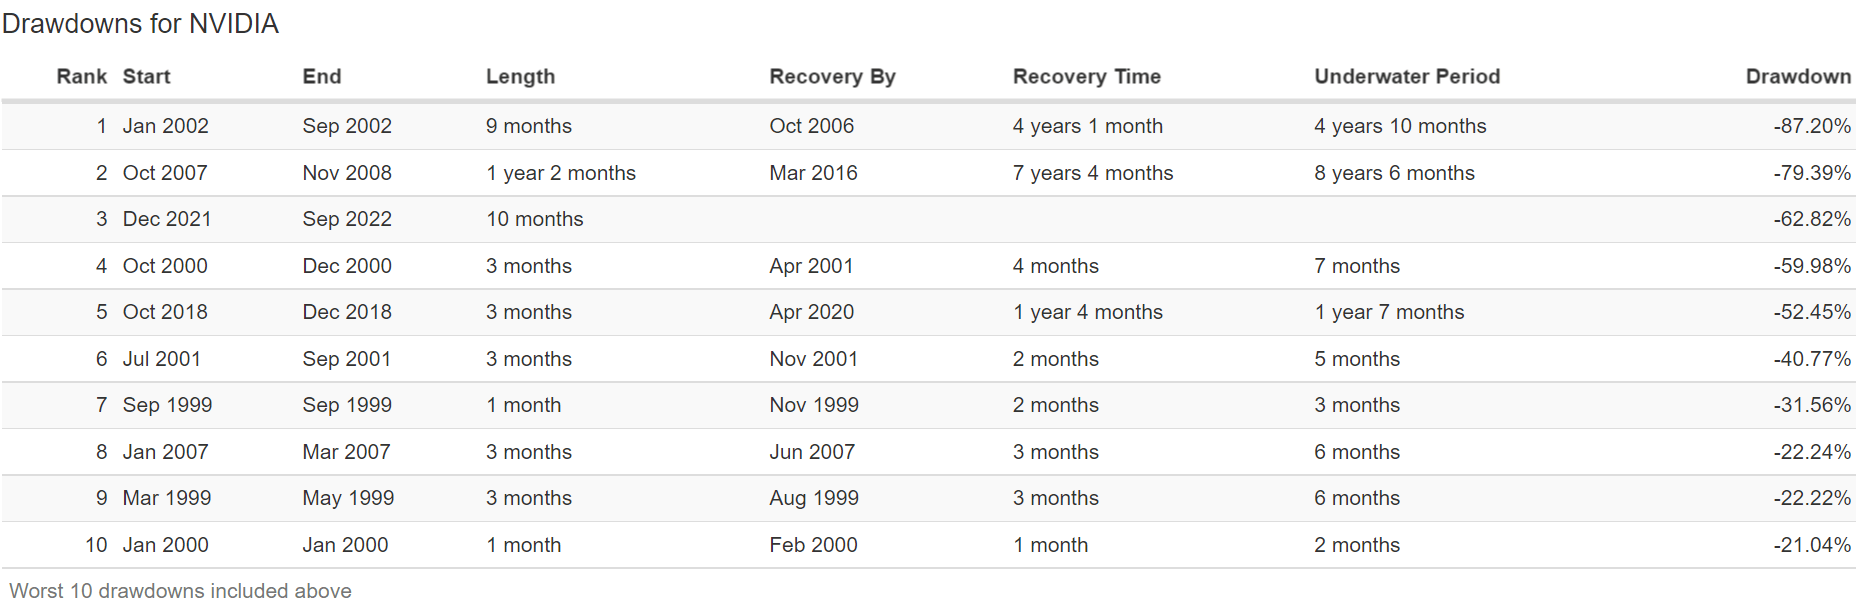
Nvidia fell as much as 63% in this bear market (so far). That’s its 3rd worst bear market in history.
Portfolio Visualizer Premium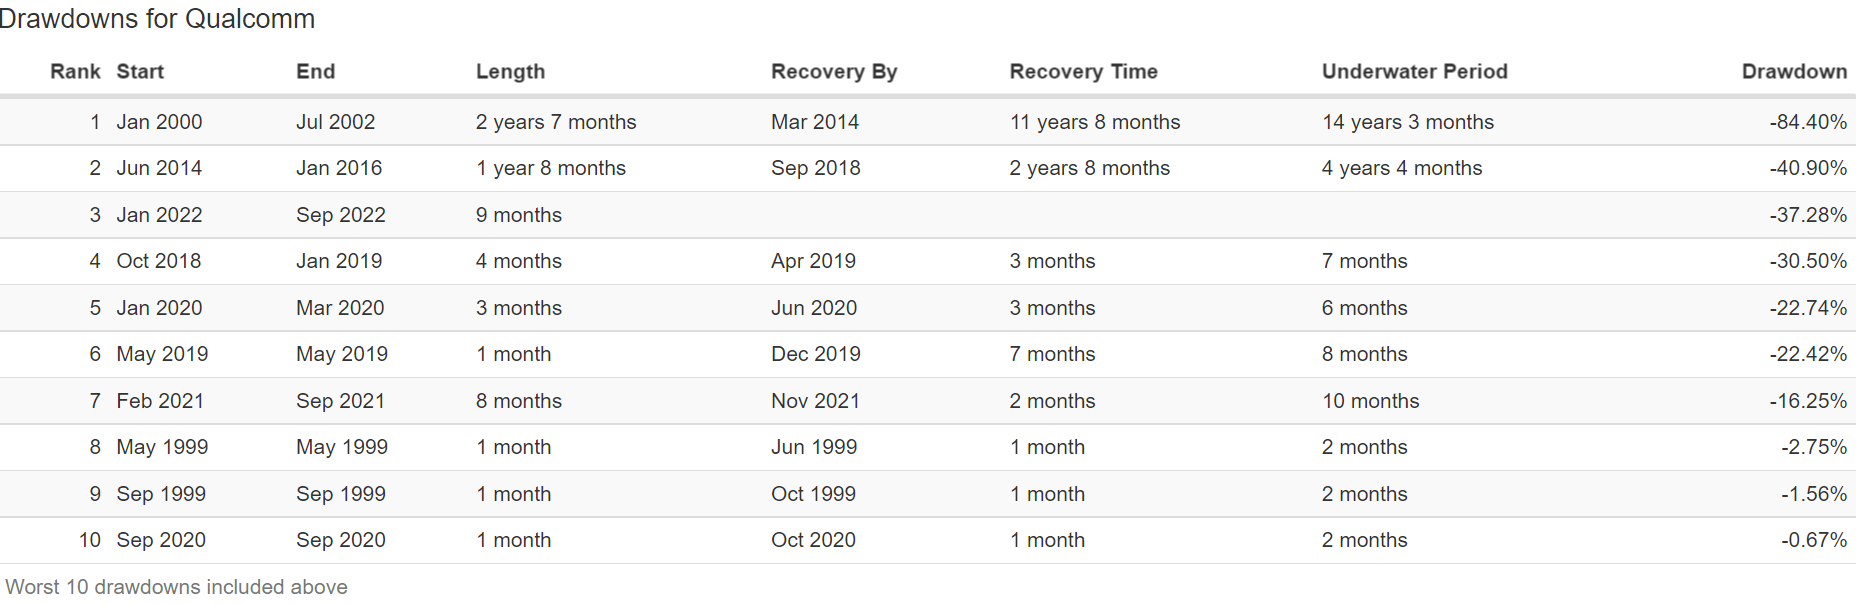
QCOM has fallen as much as 37% in this bear market, also it’s 3rd worst bear market.
Smartphone Weakness Finally Catches Up to Qualcomm As Inventories Build
Qualcomm’s guidance includes an estimated negative impact of about $2 billion in revenue due to weaker demand, foreign exchange headwinds, and excess inventories.” – Morningstar
One year ago, chip makers were the darlings of Wall Street. The Pandemic supply chain disruptions caused a chip shortage, while record $30 trillion in global stimulus caused a boom in demand for physical goods. Many of which require computer chips.
Some in the industry were even talking about a permanent industry shift, from cyclical boom and bust cycles, to a world in which chip makers could deliver steady, tech utility like secular growth.
Well, scratch that idea. It turns out chips are still a cyclical industry and smartphone demand is falling rapidly as the global economy weakens.
Qualcomm said it expects its mobile-phone handset business to fall In “a low double-digit percentage range” this year from last year. The company had earlier forecast a “mid-single-digit percentage decline” from 2021.” – Seeking Alpha
As early as Q2 QCOM’s sales were soaring 36% on the back of strong smartphone demand.
Now they are expected to decline and so are earnings.
FactSet Research Terminal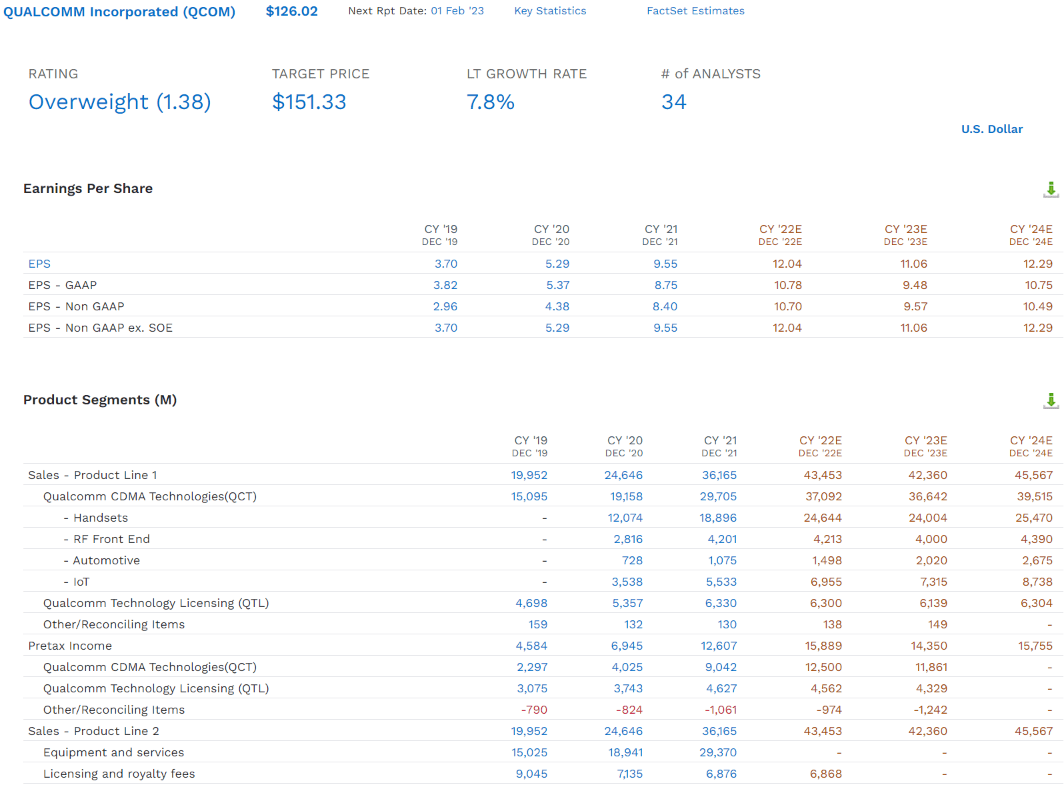
After exploding higher during the pandemic, QCOM’s earnings are expected to:
- fall 8% in 2023
- grow 11% in 2024
- 2% EPS growth from 2022 to 2024.
QCOM’s licensing business, which generates incredible 73% operating margins, isn’t expected to grow in the future, though its 263,708 patents are still expected to mint free cash flow for years to come.
At least in the short-term analysts growth outlooks have dimmed for QCOM which is now expected to grow around 8% over the long-term, after we get past the 2023 recession.
FAST Graphs, FactSet FAST Graphs, FactSet FAST Graphs, FactSet FAST Graphs, FactSet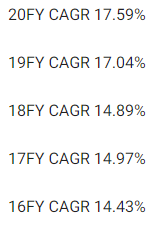
Is QCOM likely to actually grow at 8% over time? Which would make the total return outlook rather uninspiring?
| Investment Strategy | Yield | LT Consensus Growth | LT Consensus Total Return Potential | Long-Term Risk-Adjusted Expected Return | Long-Term Inflation And Risk-Adjusted Expected Returns | Years To Double Your Inflation & Risk-Adjusted Wealth |
10-Year Inflation And Risk-Adjusted Expected Return |
| Nasdaq | 0.8% | 11.8% | 12.6% | 8.8% | 6.5% | 11.0 | 1.88 |
| Schwab US Dividend Equity ETF | 3.6% | 8.5% | 12.1% | 8.4% | 6.1% | 11.8 | 1.81 |
| Dividend Aristocrats | 2.6% | 8.5% | 11.1% | 7.8% | 5.4% | 13.2 | 1.70 |
| S&P 500 | 1.8% | 8.5% | 10.3% | 7.2% | 4.9% | 14.8 | 1.61 |
| Qualcomm | 2.4% | 7.8% | 10.2% | 7.1% | 4.8% | 15.0 | 1.60 |
(Source: DK Research Terminal, FactSet)
If analysts are right, then QCOM might merely match the market going forward.
But I don’t actually expect QCOM to grow at just 8% in the future, and here are two reasons why.
Investor presentation 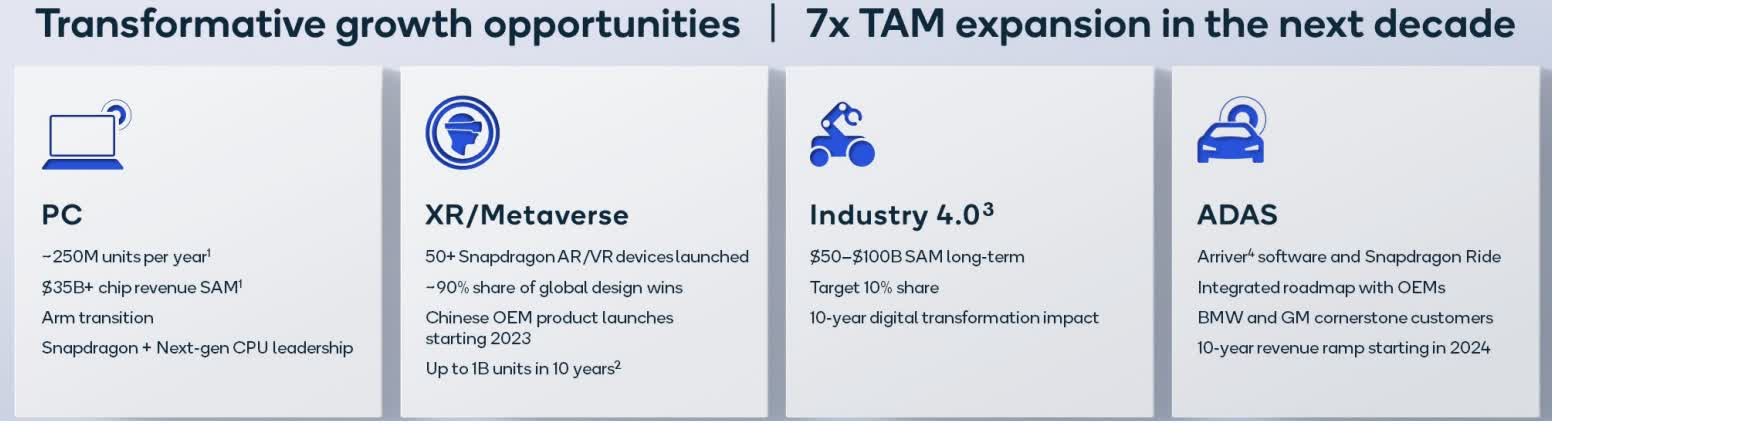
QCOM’s addressable market is expected to grow from $100 billion per year (43% market share) to $700 billion in the next decade. QCOM is diversifying into cloud computing, driverless cars, and the internet of things or IOT.
This makes me think that the recent decline in growth outlook is due to the recent cyclical downturn, which often happens with chip makers.
Ycharts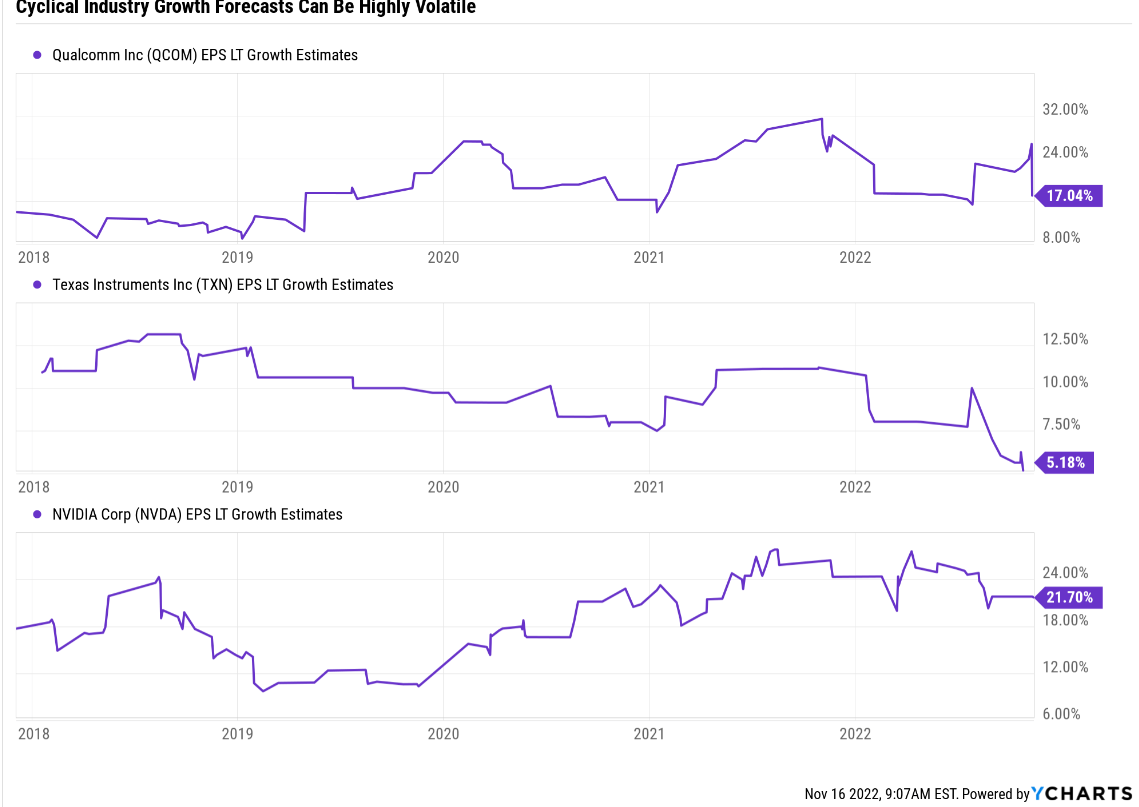
However, in the short-term QCOM investors are going to have to be patient, because the recent face-ripping rally has reduced the total return potential for the next few years.
Ycharts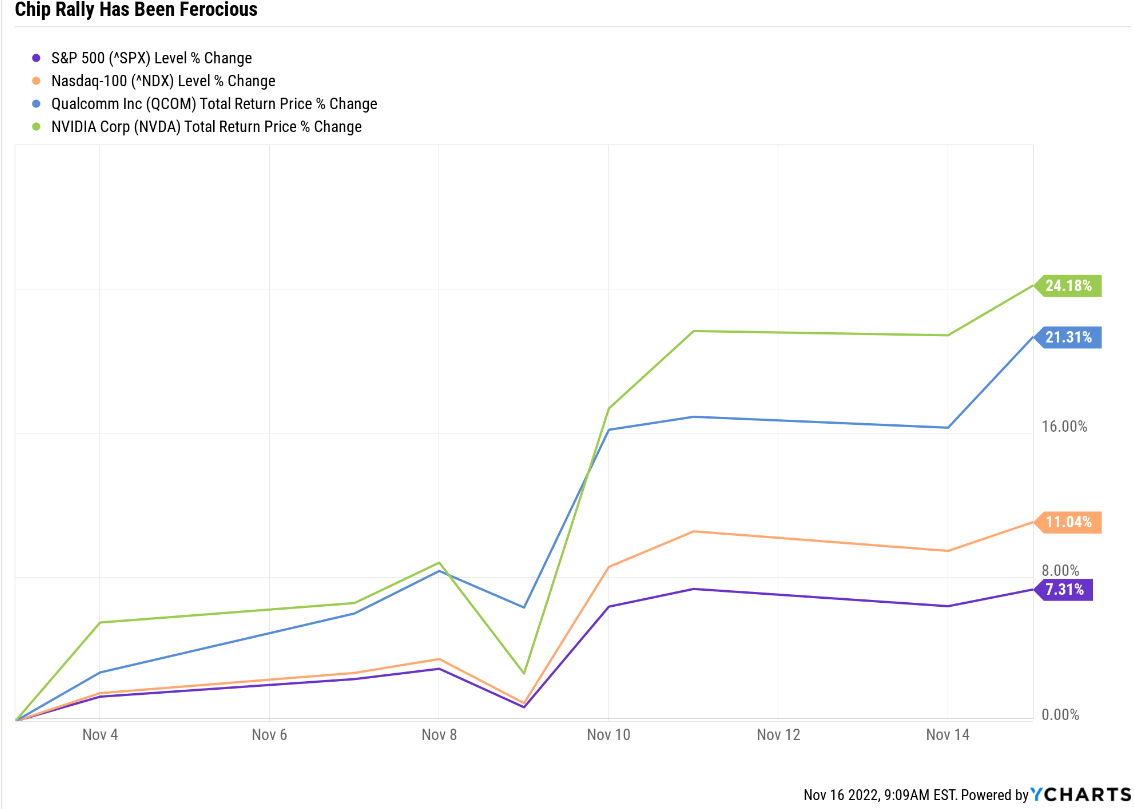
QCOM has rallied 21% off its November 3rd lows, and combined with a weak global growth outlook for 2023, means that short-term growth prospects are rather weak.
But that doesn’t mean that QCOM isn’t a potentially attractive buy.
- fair value: $163.92
- current price: $126.02
- discount to fair value: 23%
- DK rating: potentially strong buy.
FactSet Research Terminal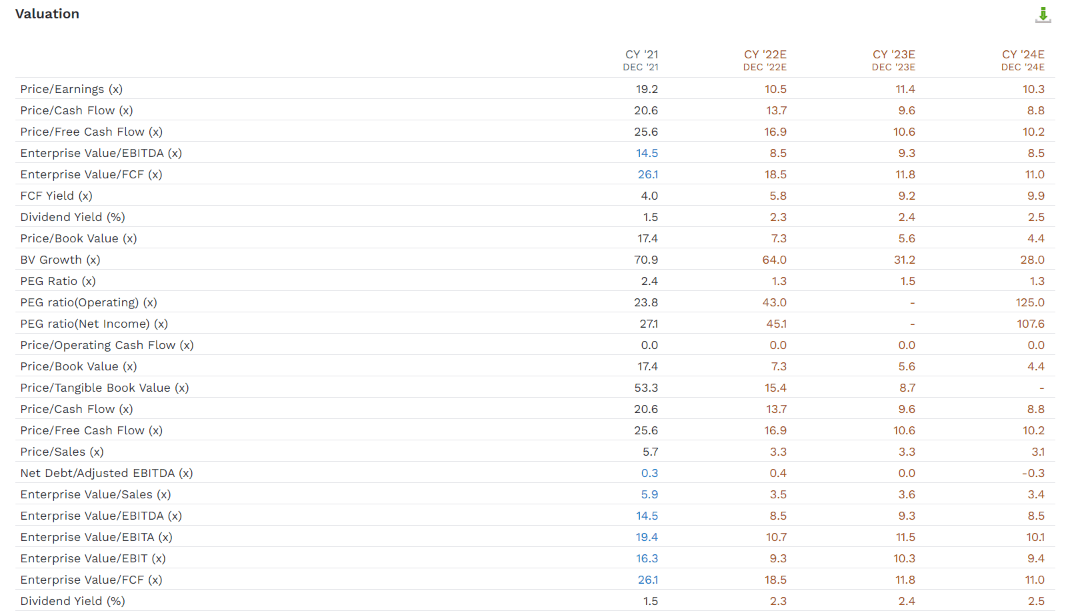
QCOM is trading at 11.4X consensus trough earnings, and just 9.3X cash-adjusted trough earnings.
That means it’s pricing in approximately 1.6% CAGR long-term growth, far below the 7.8% analysts currently expect.
Qualcomm 2024 Consensus Return Potential
FAST Graphs, FactSet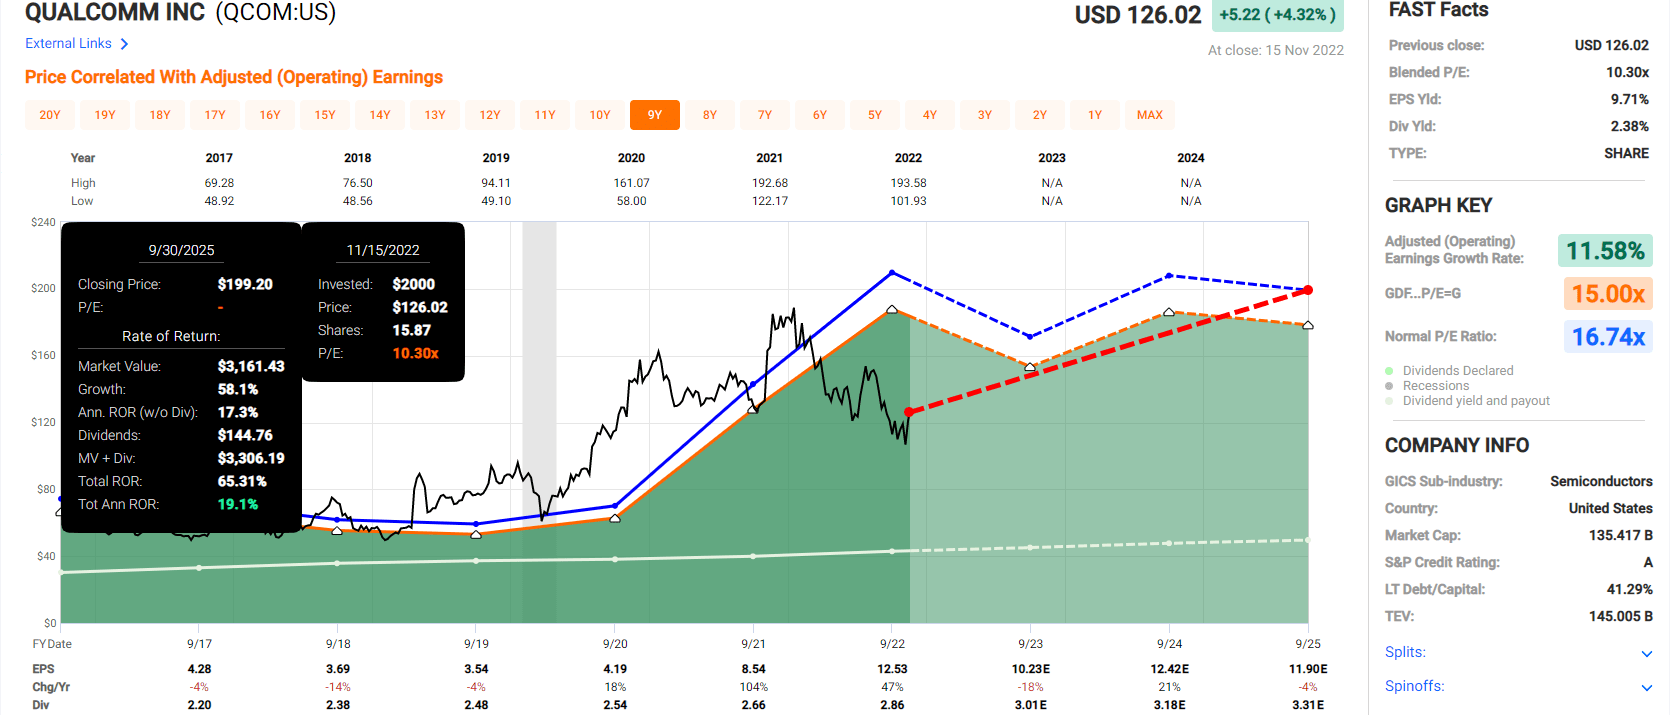
Which means that if QCOM grows as expected and returns to historical market-determined fair value it could deliver Buffett-like 19% annual returns over the next three years.
- about 2X the S&P consensus
Qualcomm 2028 Consensus Return Potential
FAST Graphs, FactSet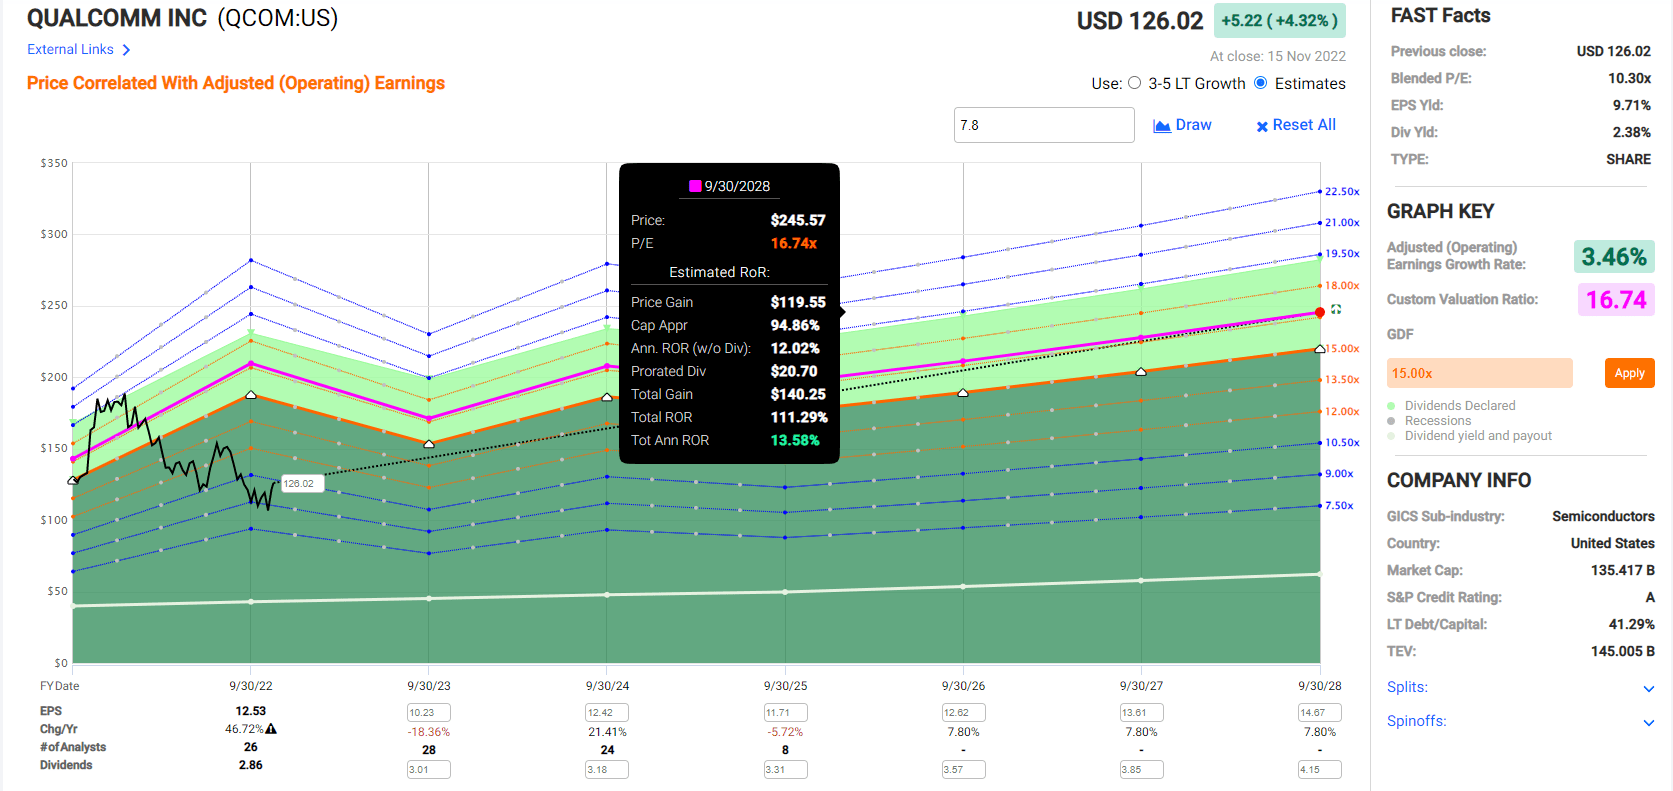
Even with just 3.5% annual EPS growth expected through 2028, QCOM could more than double your money, delivering 14% annual returns, about 2X the S&P consensus.
Or to put another way, if you buy QCOM today, you get an Ultra-SWAN quality dividend growth powerhouse, that could more than double your money as we wait to see if QCOM’s growth outlook improves in the future.
FAST Graphs, FActSet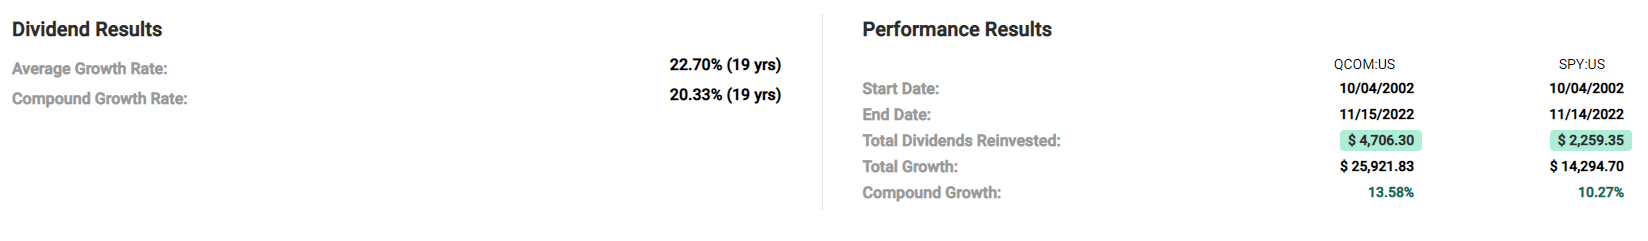
QCOM has been paying a dividend for 19 consecutive years, and raised it every year. The dividend growth rate has been a stellar 20% annually and its delivered close to 14% annual returns.
- the current five year consensus return forecast.
I think long-term QCOM should be able to continue delivering 13% to 14% long-term returns, which makes it worth buying today, or at least holding it if you already own it.
- 13% to 14% long-term returns is better than SCHD, the S&P, dividend aristocrats, and the Nasdaq.
Qualcomm Investment Decision Score
DK Dividend Kings Automated Investment Decision Tool
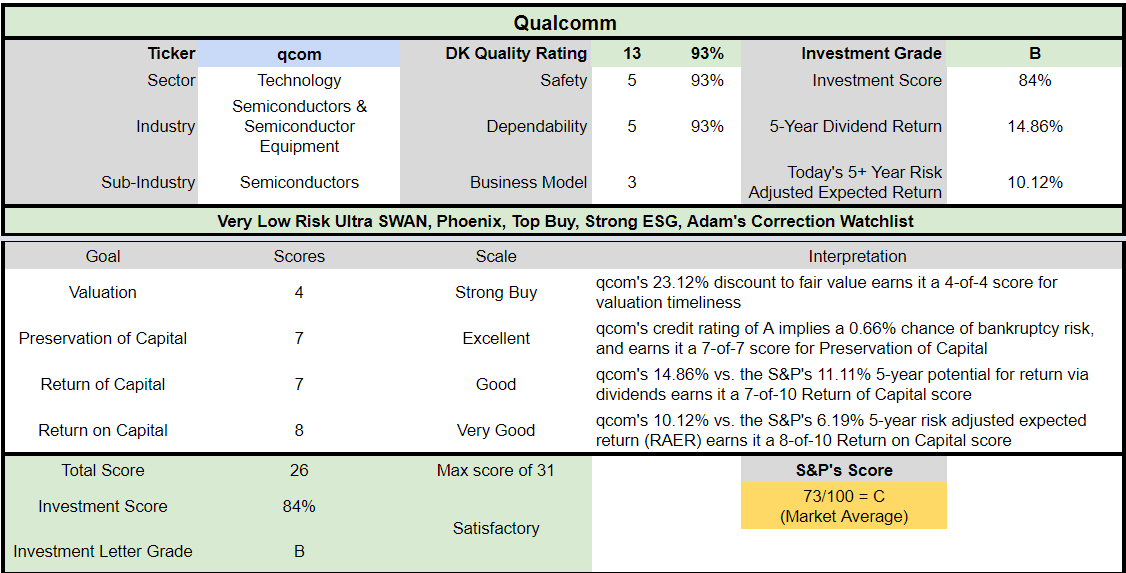
QCOM might not be a table-pounding buy compared to the S&P 500, but it’s still a satisfactory one that’s offering:
- superior and safer yield
- a faster-growing dividend
- better medium-term total returns
- 66% better risk-adjusted expected returns
- 30% higher income potential over the next five years than the S&P
NVIDIA: A Chip Specialist Facing A Cyclical Downturn But Whose Hyper-Growth Outlook Remains Intact
NVDA fell off a cliff when the Biden Administration announced export controls on chips to China.
Fortunately the company adapted quickly and has already announced new export control compliant chips.
Ycharts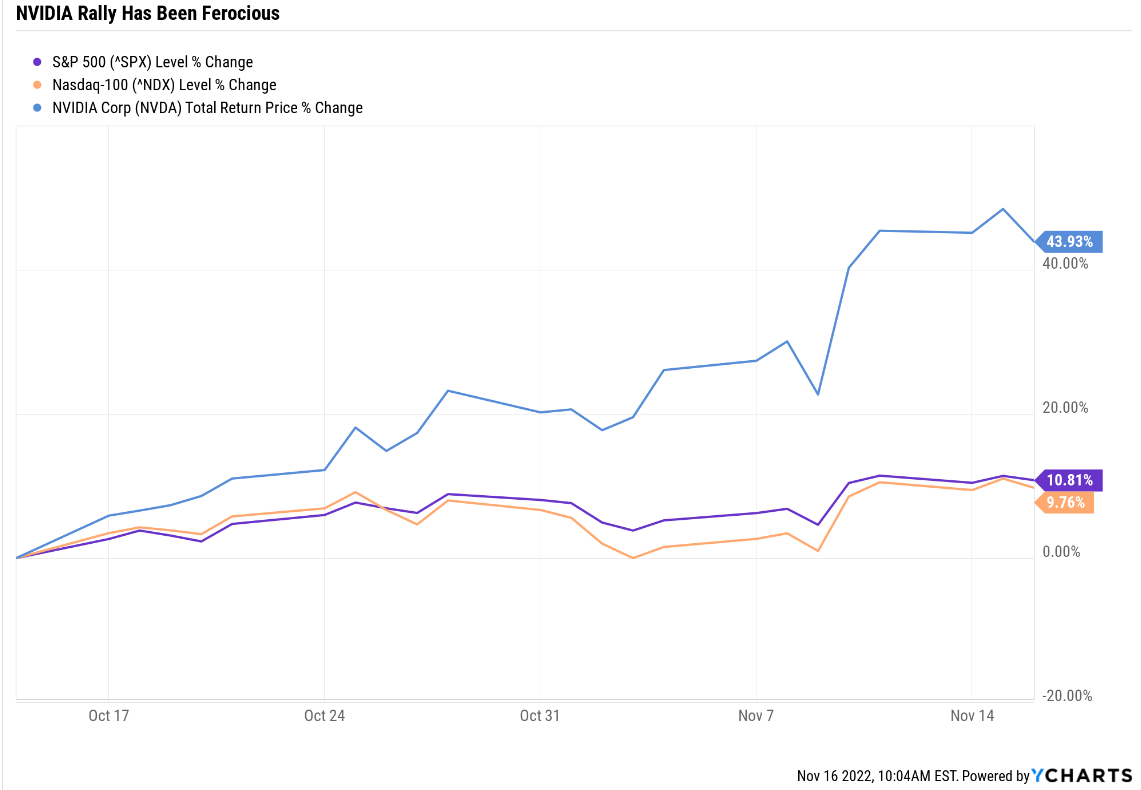
News like that, along with the overall “risk on” sentiment in stocks, has helped drive NVDA up 44% in recent weeks.
This isn’t surprising given that NVDA is a very volatile stock, historically 2.2X more volatile than the S&P 500.
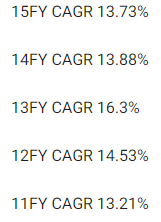
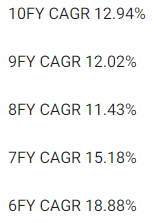
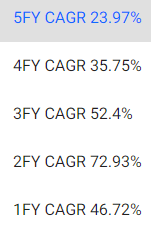
Nvidia Rolling Returns Since Feb 1999 IPO
Portfolio Visualizer Premium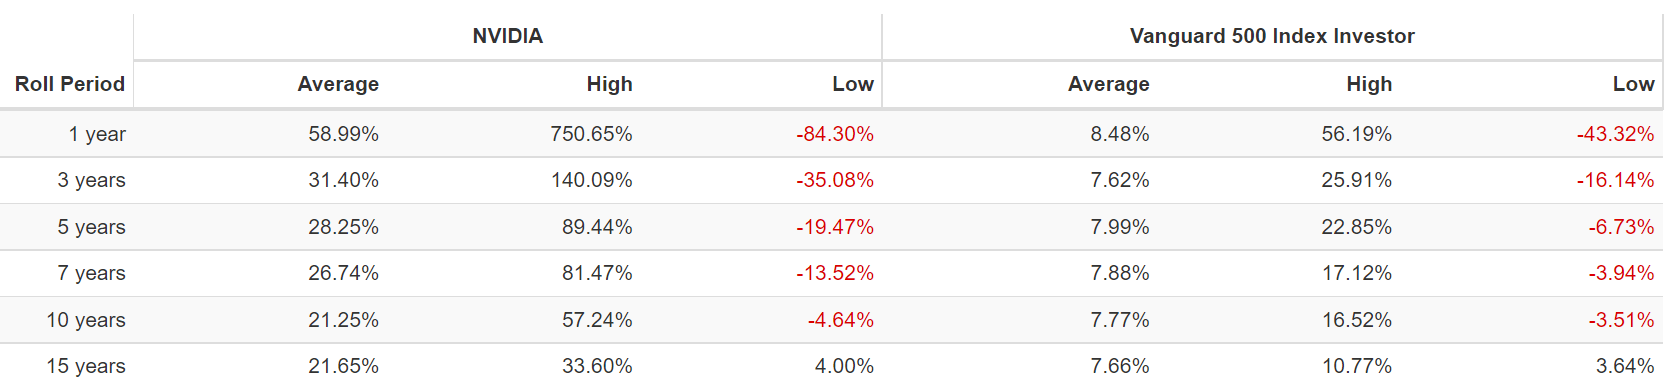
Gut churning volatility cuts both ways, with 90% crashes followed by 751% one year rallies.
From bear market lows NVDA is capable of:
- 140% annual returns for 3 years = 13.8X in 3 years
- 89% annual returns for five years = 24.1X in five years
- 81% annual returns for seven years = 64.9X in seven years
- 47% annual returns for 10 years = 92.4X in 10 years
- 34% annual returns for 15 years = 77.1X in 15 years.
The question investors need answered today, is what does NVDA’s long-term outlook like now that the U.S. and China are in an economic cold war?
Nvidia’s Data Center Business Drives the Firm’s Wide Moat Rating
Nvidia is the top designer of discrete graphics processing units that enhance the visual experience on computing platforms. The firm’s chips are used in a variety of end markets, including high-end PCs for gaming and data centers.” – Morningstar
NVDA might have started out focused on gaming PCs, but it’s now at the forefront of some of the world’s best secular growth trends.
- cloud computing
- AI
- driverless cars
- automation.
investor presentation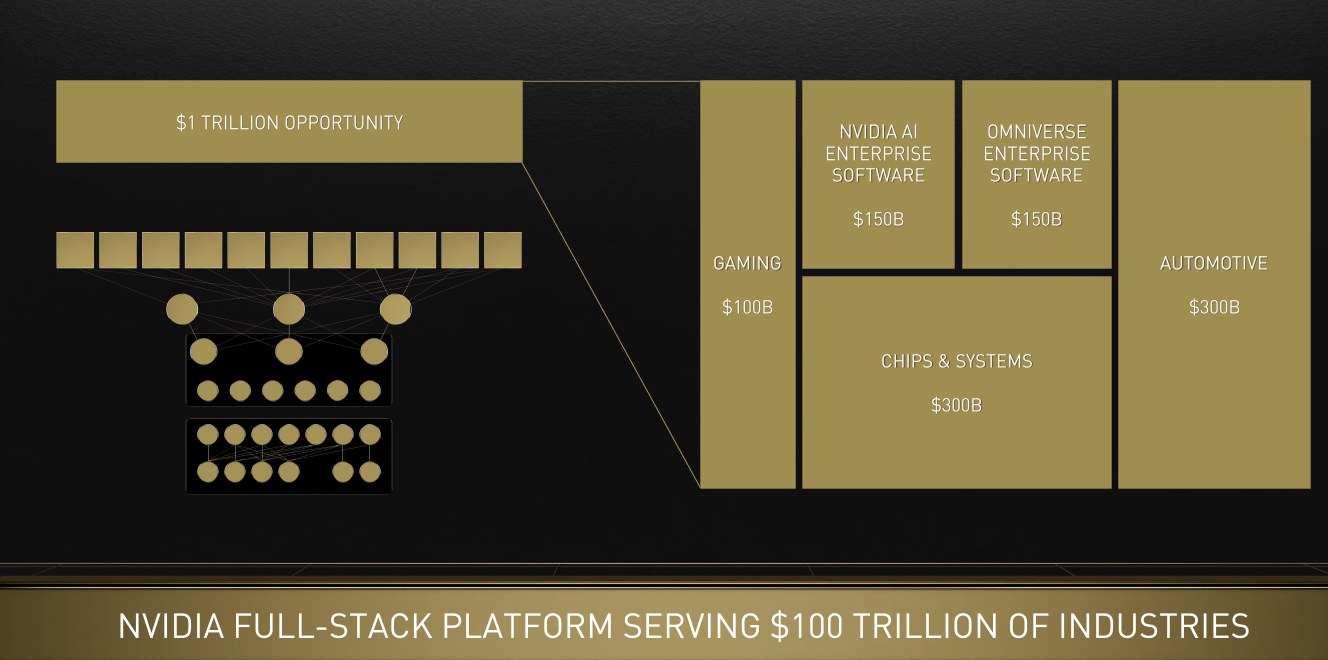
Management estimates NVDA’s total addressable market is $1 trillion per year (2.7% market share) and those markets are the backbone of the entire $100 trillion global economy.
The acquisition of Mellanox has helped diversify Nvidia’s end-market exposure, and we suspect the firm will derive over half of revenue from the data center segment going forward, which should help mitigate some of the volatility Nvidia has faced in its gaming and cryptocurrency mining-related sales over the past few years.” – Morningstar
NVDA has been diversifying away from gaming for years, and Morningstar thinks they could soon get over 50% of sales from datacenters, a far more stable business.
FactSet Research Terminal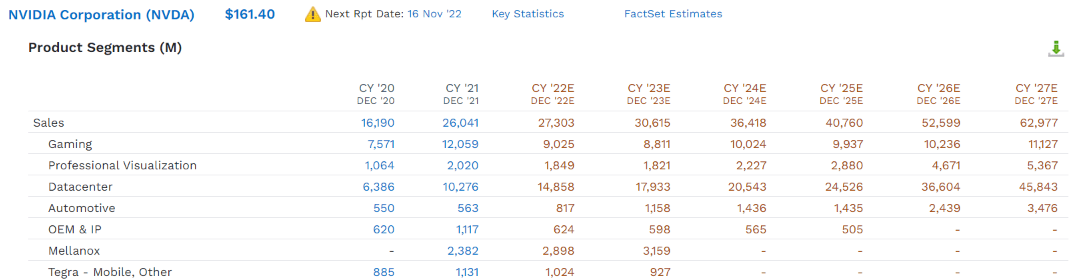
Analysts are even more bullish on the datacenter business, expecting it to triple in the next five years.
By 2027 analysts think 73% of NVDA’s sales will be coming from datacenters.
Why? Because datacenters are enterprise and big businesses don’t mind spending millions on the best hardware if it saves them money in the long-term.
What kind of businesses are NVDA’s datacenter customers?
investor presentation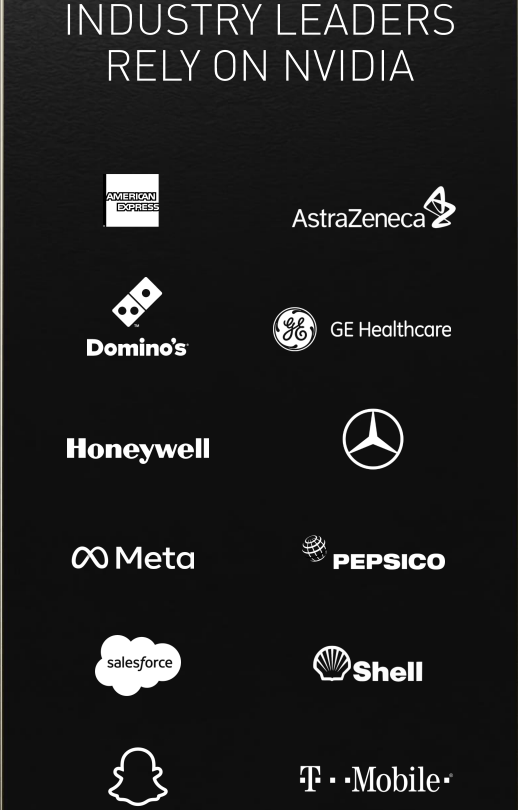
NVDA’s datacenter customers have deep pockets and are expected to help drive incredible long-term growth. How incredible?
FactSet Research Terminal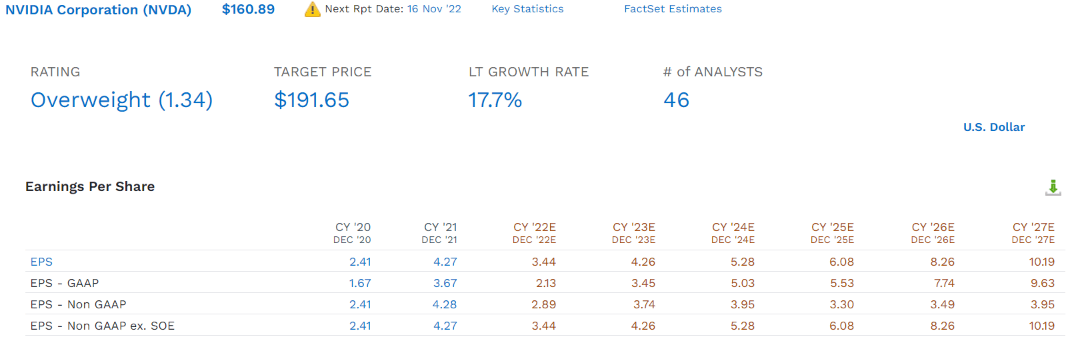
How about tripling earnings in five years, and 18% long-term earnings growth?
- 20% to 78% CAGR growth over the last 20 years.
Given NVDA’s massive $1 trillion addressable market, and dominance in advanced GPUs (the “super chips” that drive the future) I consider 18% long-term growth a reasonable estimate from all 46 analysts who cover it.
What does that potentially mean for investors?
| Investment Strategy | Yield | LT Consensus Growth | LT Consensus Total Return Potential | Long-Term Risk-Adjusted Expected Return | Long-Term Inflation And Risk-Adjusted Expected Returns | Years To Double Your Inflation & Risk-Adjusted Wealth |
10-Year Inflation And Risk-Adjusted Expected Return |
| Nvidia | 0.1% | 17.7% | 17.8% | 12.5% | 10.1% | 7.1 | 2.62 |
| Nasdaq | 0.8% | 11.8% | 12.6% | 8.8% | 6.5% | 11.0 | 1.88 |
| Schwab US Dividend Equity ETF | 3.6% | 8.5% | 12.1% | 8.4% | 6.1% | 11.8 | 1.81 |
| Dividend Aristocrats | 2.6% | 8.5% | 11.1% | 7.8% | 5.4% | 13.2 | 1.70 |
| S&P 500 | 1.8% | 8.5% | 10.3% | 7.2% | 4.9% | 14.8 | 1.61 |
| Qualcomm | 2.4% | 7.8% | 10.2% | 7.1% | 4.8% | 15.0 | 1.60 |
(Sources: DK Research Terminal, FactSet, Morningstar, Ycharts)
Analysts expect Buffett-like 18% long-term returns from NVDA, not much bellow its 22% CAGR rolling 15-year returns since 1999.
In other words:
- QCOM is struggling with several slow years of growth due to cyclical headwinds
- NVDA’s growth engine is firing on all cylinders thanks to its dominance of super chip GPUs driving the future of the world economy
OK, so NVDA is the best chip stock right? And clearly better than QCOM? Not necessarily.
The Biggest Problem Income Investors Will Have With Nvidia
What is there to not love about NVDA? Is it the balance sheet?
- A stable credit rating from S&P = 0.66% 30-year bankruptcy risk
- $11 billion in net cash on the balance sheet
- $6.6 billion in annual free cash flow.
No, NVDA’s balanced sheet is a fortress and it’s a free cash flow minting machine.
No, the biggest issue about NVDA is how stingy management is with the dividend.
FAST Graphs, FactSet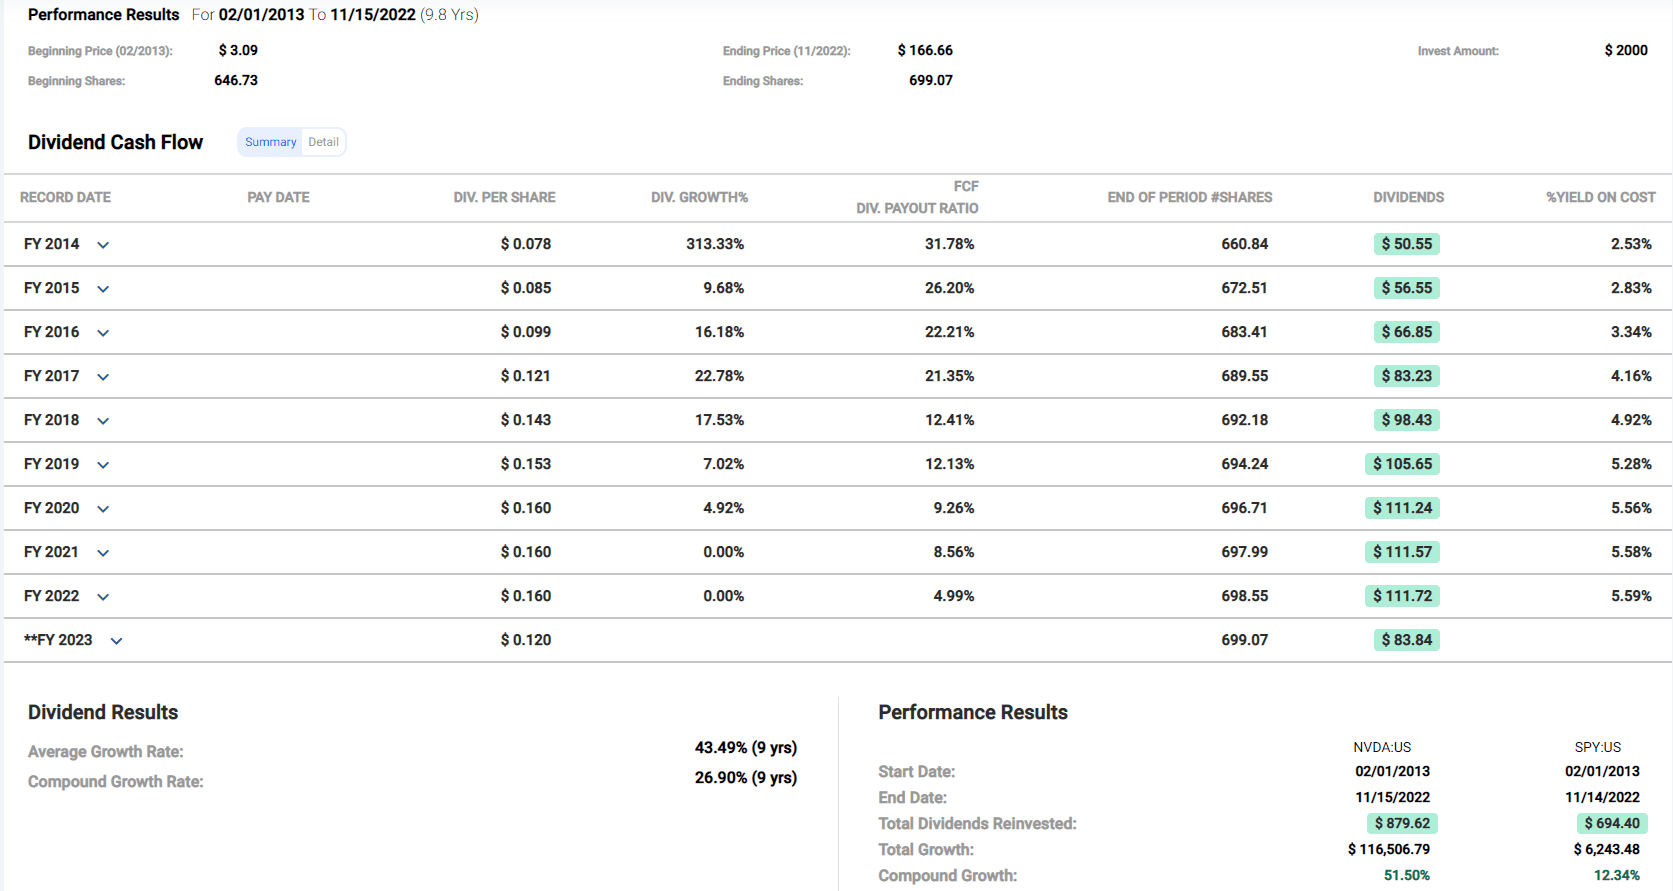
NVDA’s overall dividend growth rate is expectational, 27% CAGR since it began paying on in 2013. And its 52% CAGR annual total returns over that time period put even Amazon (AMZN) to shame.
But note how the dividend growth rate began slowing in 2018 and it hasn’t raised its dividend for two years. The free cash flow (“FCF”) payout ratio has fallen to 5%, 1/10th the credit rating safety guideline for this industry.
NVDA’s dividend yield is 0.1% and even if management were to take the payout ratio to the 50% safety guideline it would be just 1%, far below other world-beater blue-chip dividend chip stocks.
FactSet Research Terminal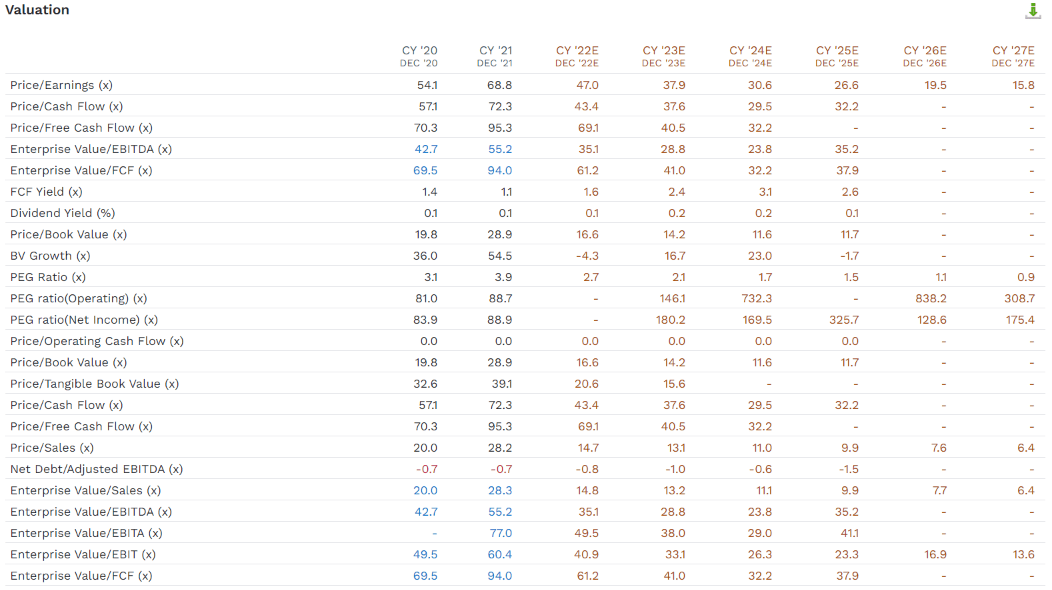
Value investors might also be uncomfortable with a company trading at 38X forward earnings.
What is NVDA’s fair value?
- NVDA fair value: $136.39
- current price: $160.55
- discount to fair value: -18%
- DK rating: hold.
NVDA’s 45% rally in recent weeks meant the margin of safety went from 21% to -18%.
Today NVDA is at a premium price that means a lot of downside risk for one of the most volatile world-beater tech blue-chips in the world.
If the 2023 recession causes earnings estimates to come down in the coming quarters? Then NVDA could suffer a sharp decline like these.
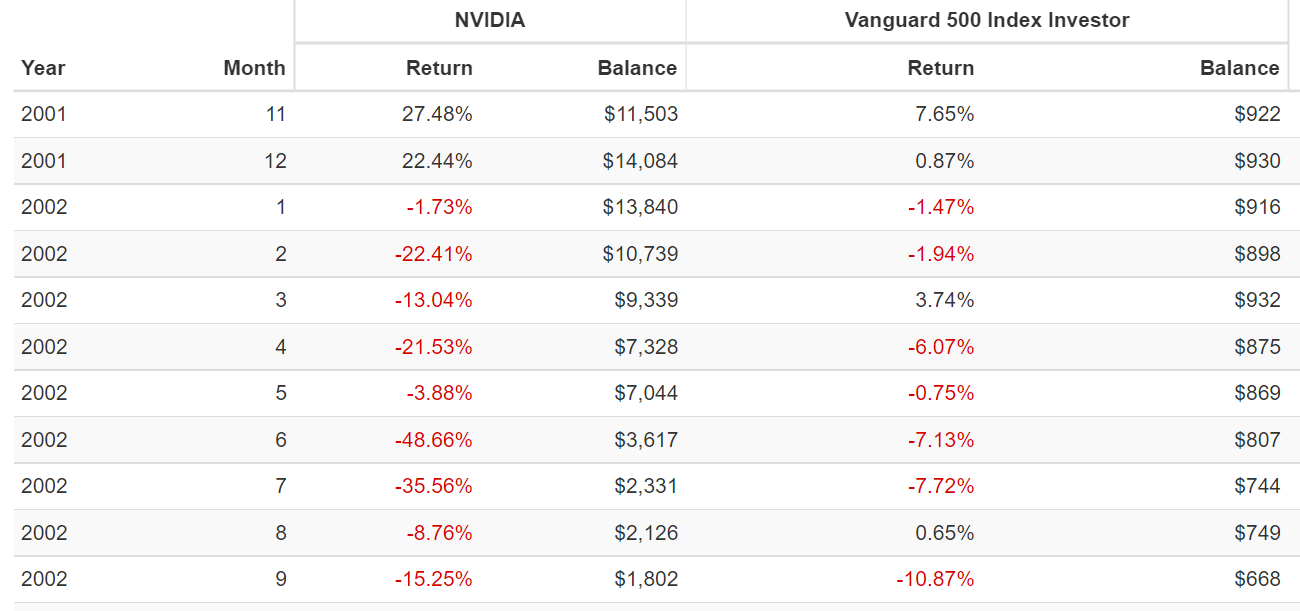
Nvidia In The 2022 Bear Market
Portfolio Visualizer Premium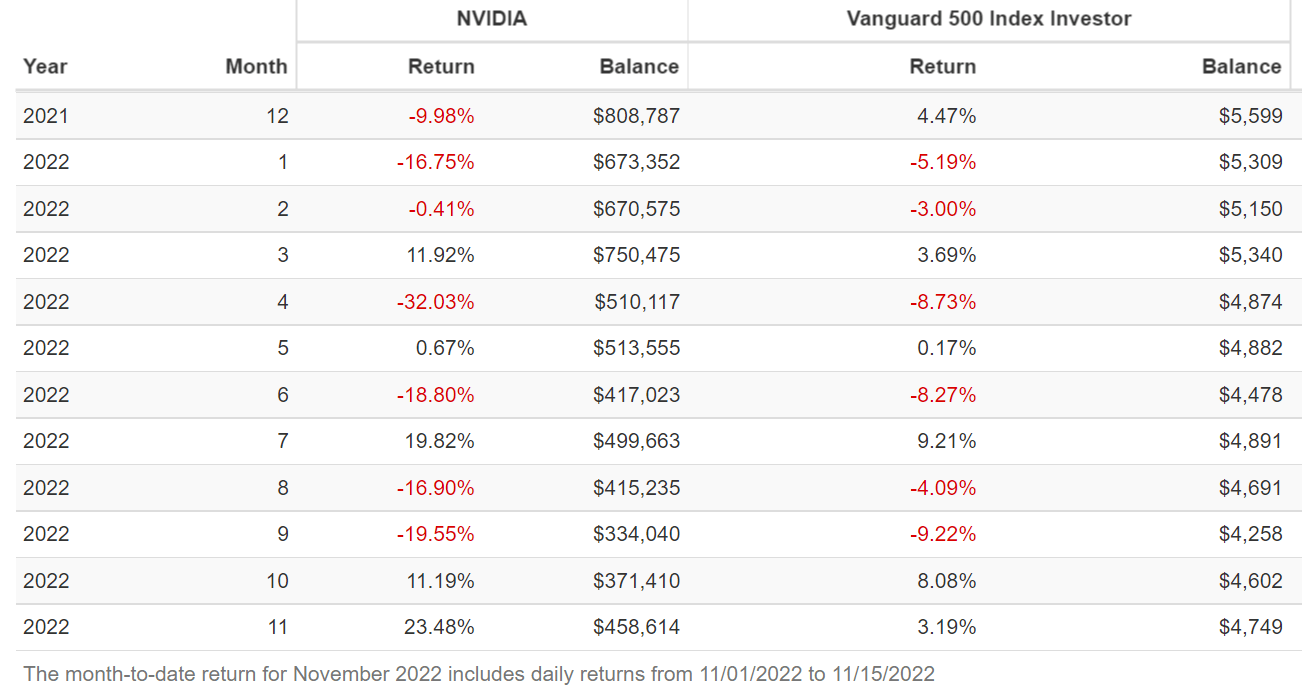
In the past year alone NVDA has suffered double-digit monthly declines no less than six times, including 32% crash in April.
Nvidia In The Pandemic
Portfolio Visualizer Premium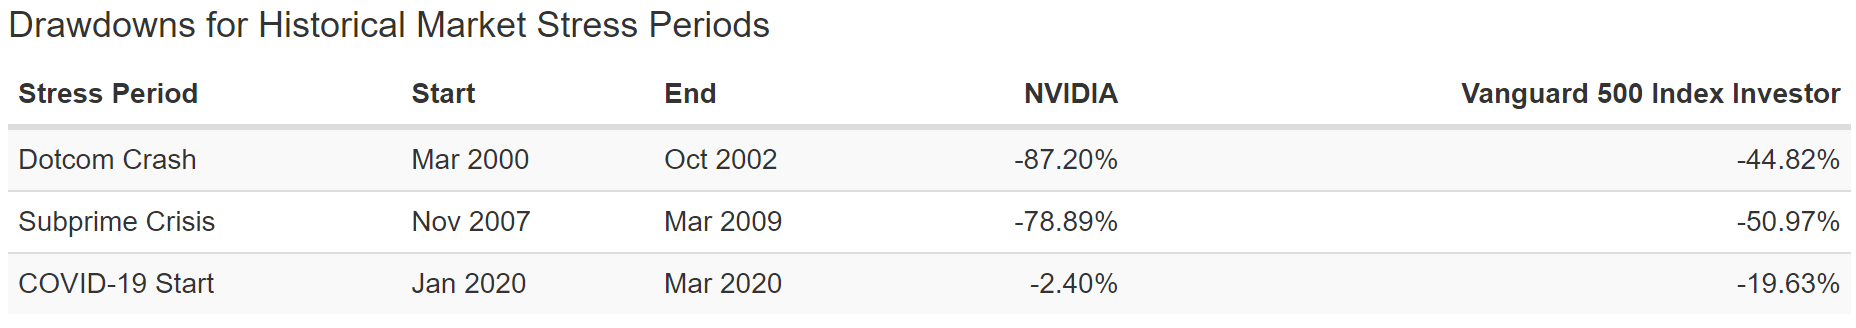
Nvidia held up well in the Pandemic, as did most tech stocks.
- The Nasdaq 100 fell just 12% while the S&P fell 34%.
But NVDA’s crashes are the stuff of legend, and anyone owning it should be prepared for truly gut-wrenching volatility in the future. What kind of volatility?
Nvidia In The 2018 Bear Market
Portfolio Visualizer Premium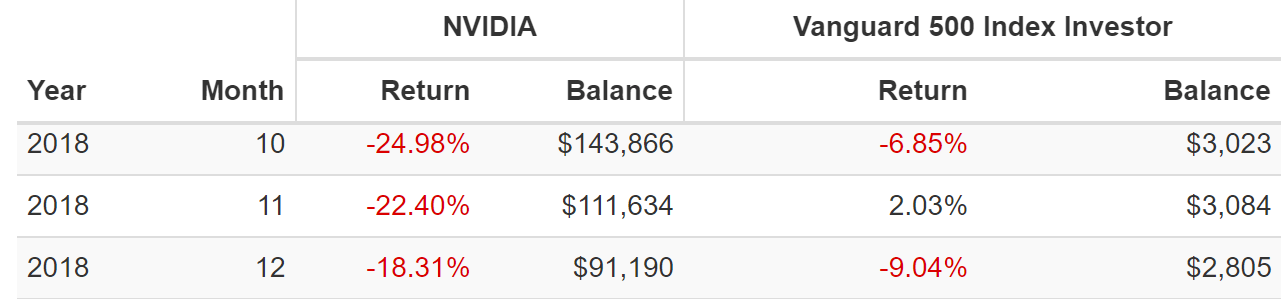
Imagine a stock you own falls 25% in a month, then 22% the next month, and then another 18% the following month.
That’s what happened in the 2018 bear market.
- 53% decline in 3 months
- S&P fell 21%.
And that was just the 4th largest bear market in NVDA’s history.
- it’s suffered six 40+% crashes in the last 23 years
- averaging once every four years.
Nvidia In The 2011 Bear Market
Portfolio Visualizer Premium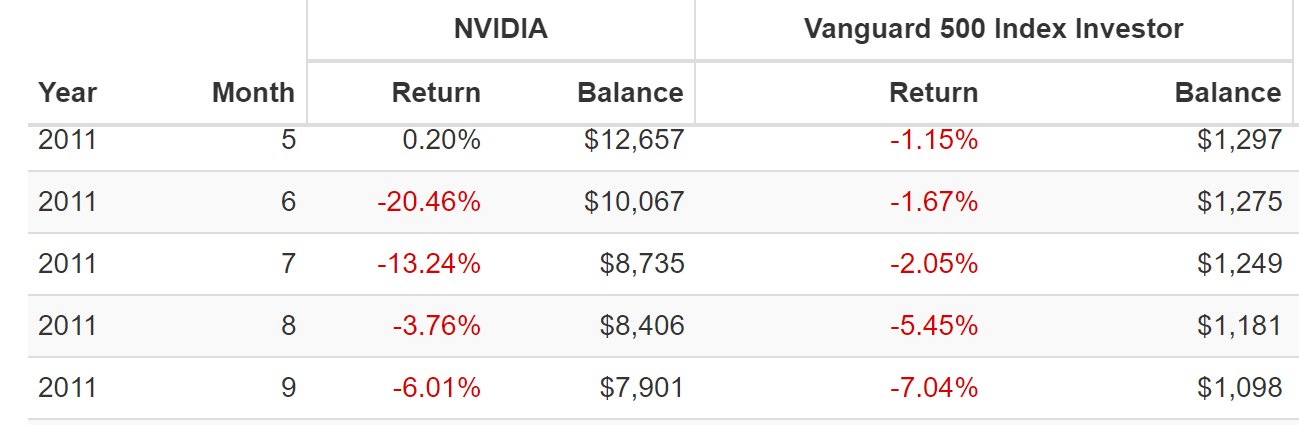
Compared to some its crashes, the 2011 bear market decline of 38% was relatively tame.
Nvidia In The Great Recession
Portfolio Visualizer Premium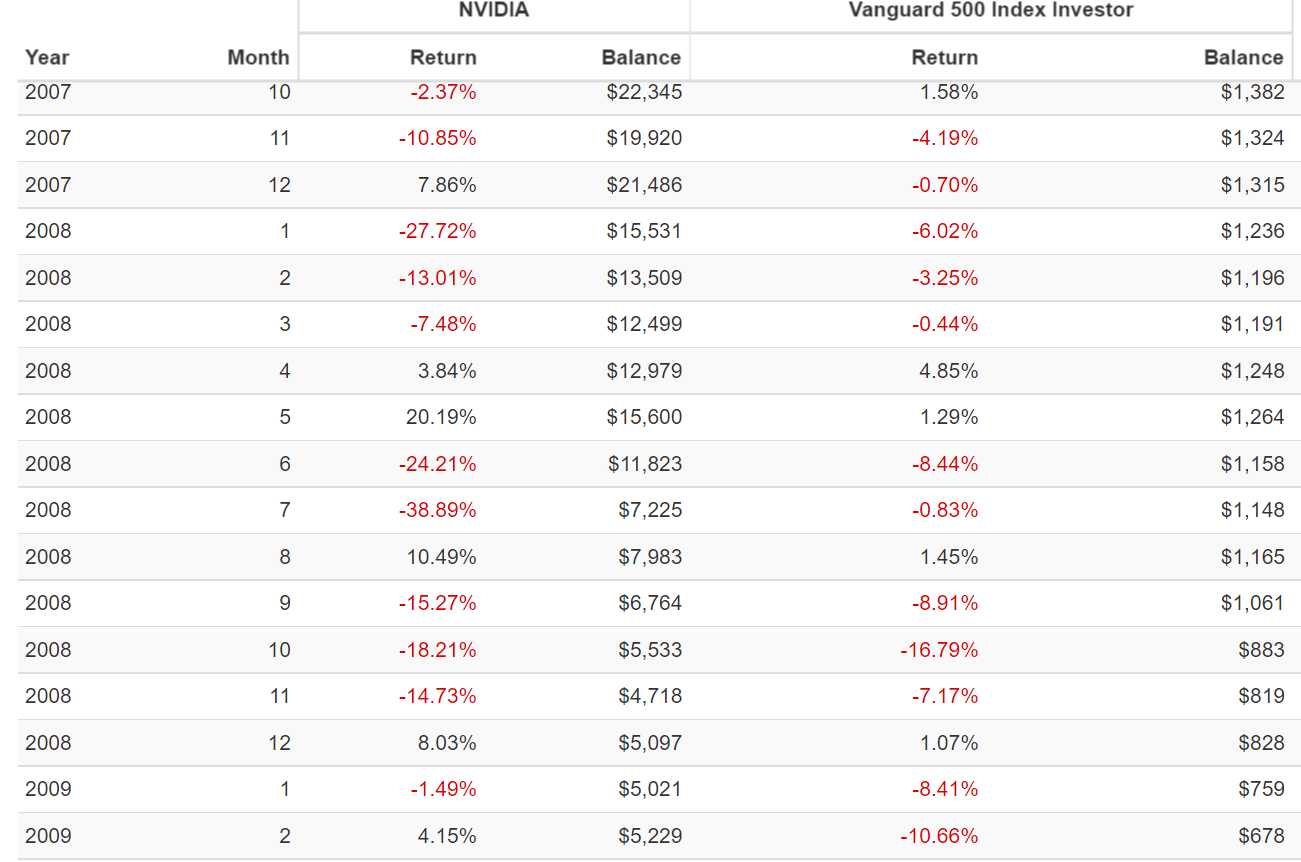
NVDA dell 80% during the Great Recession, including falling almost 40% in July 2008. It fell 54% from June to July of 2008, a level of volatility that only those who owned it in a diversified portfolio could stomach.
Nvidia Pre-Tech Crash
Portfolio Visualizer Premium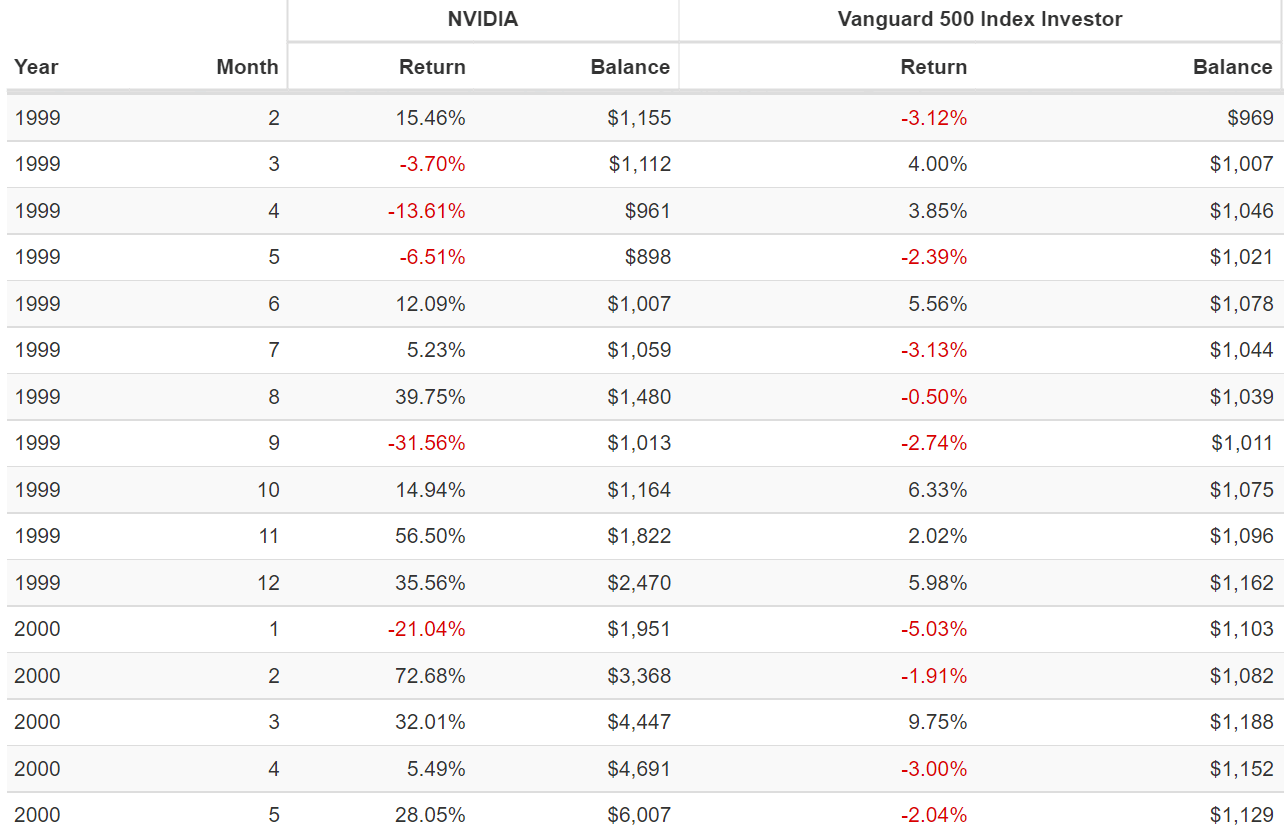
Even before the tech crash of 2000 to 2002, NVDA was capable of falling 32% in a single month.
Nvidia During The Tech Crash
Portfolio Visualizer Premium Portfolio Visualizer Premium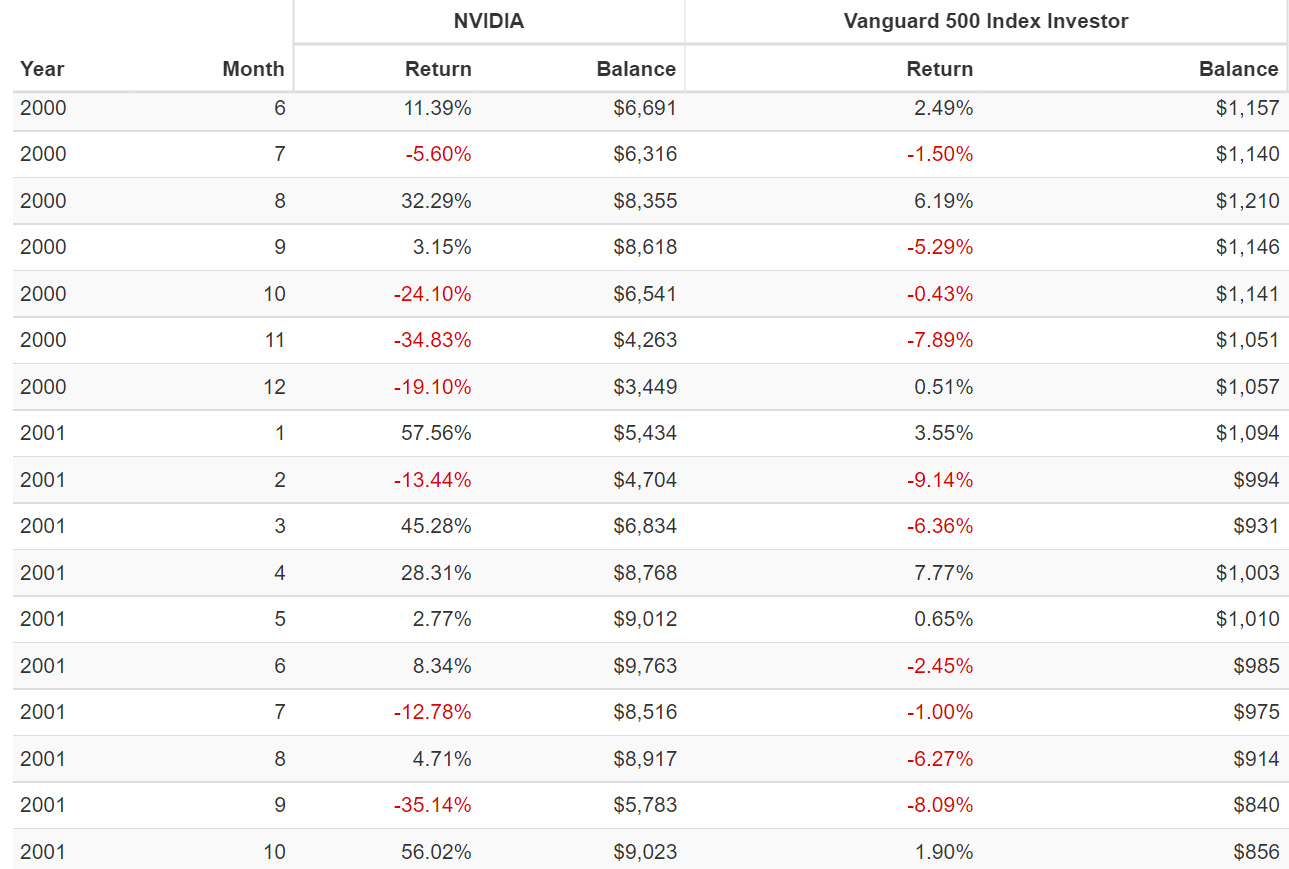
If you think a 45% one month rally means NVDA is out of the woods, you’re wrong.
During the Tech Crash NVDA had nine 20+% single month rallies.
That includes nearly tripling from October 2001 to December 2001.
NVDA then proceeded to fall nine straight months, a total of 87%, including getting cut in half in June 2002.
- after already falling 50% in the previous five months
- and then it fell another 50% before bottoming in September of 2022.
So what if you buy NVDA today? At a 17% historical premium? Will you regret it? That depends on your time horizon. Over the next few months? Probably you’re in for a wild wide…to the downside.
- 2023 recession is expected to cause the market to bottom at 3,000 to 3,400 between Q1 of 2023 and Q4 of 2024.
But in the medium-term and long-term?
Nvidia 2025 Consensus Total Return Potential
(Source: FAST Graphs, FactSet)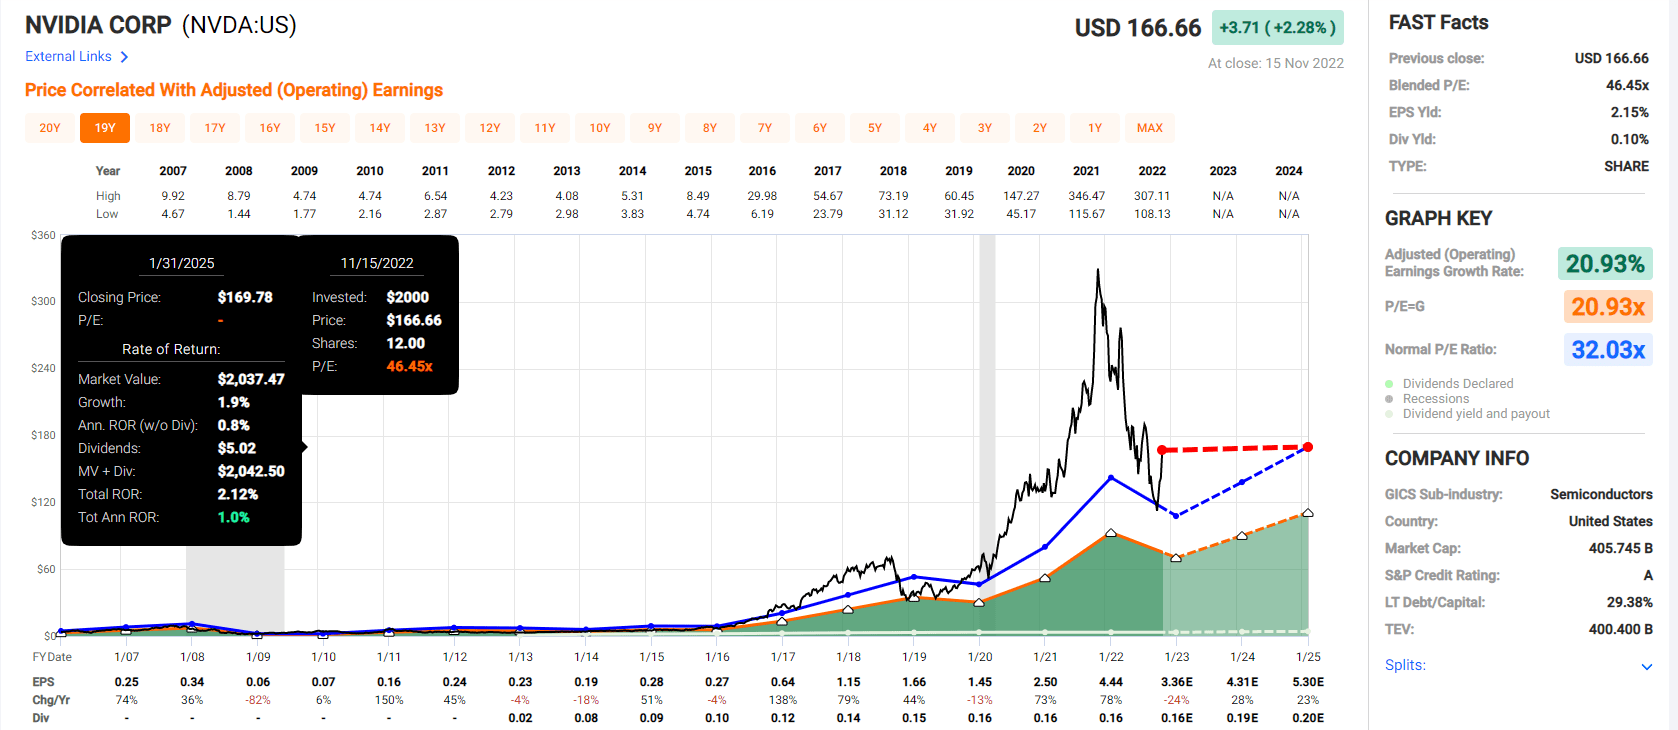
NVDA’s P/E peaked in the Pandemic bubble at 82X, compared to a historical market-determined fair value of 32.
It’s 60% collapse brought it back to historical fair value and then it rallied 45% and became 18% overvalued. Despite strong growth in 2024 and 2025, it’s consensus return potential is effectively zero.
NVIDIA 2028 Consensus Total Return Potential
(Source: FAST Graphs, FactSet)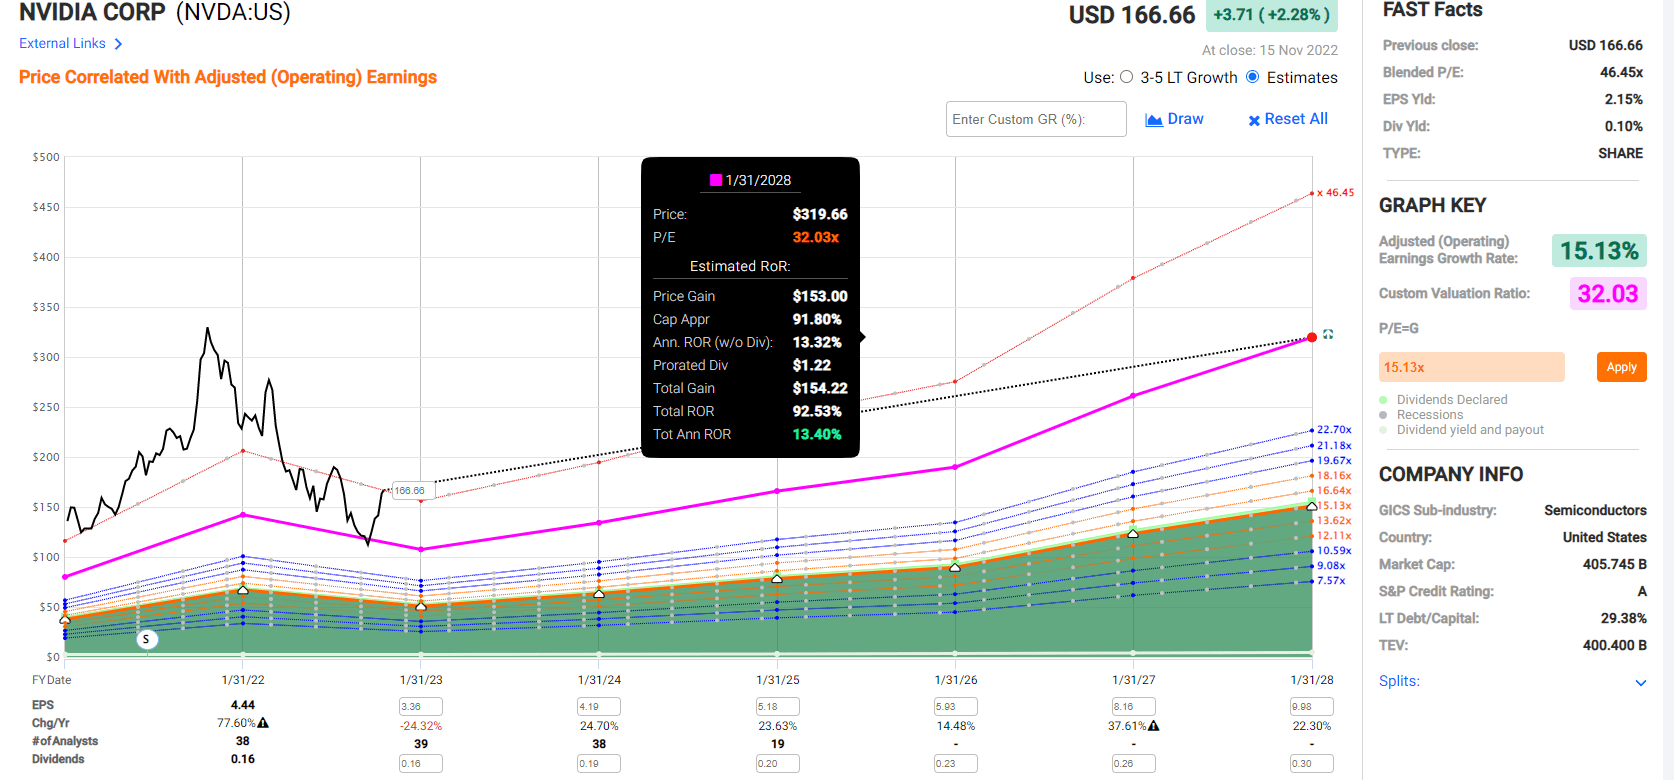
NVDA’s growth rate is so strong that it might almost double even from today’s 18% historical premium.
- approximately 2X the S&P consensus.
But if those estimates come down then NVDA investors could be in for a rough and highly volatile few years.
Nvidia Investment Decision Score
DK Dividend Kings Automated Investment Decision Tool
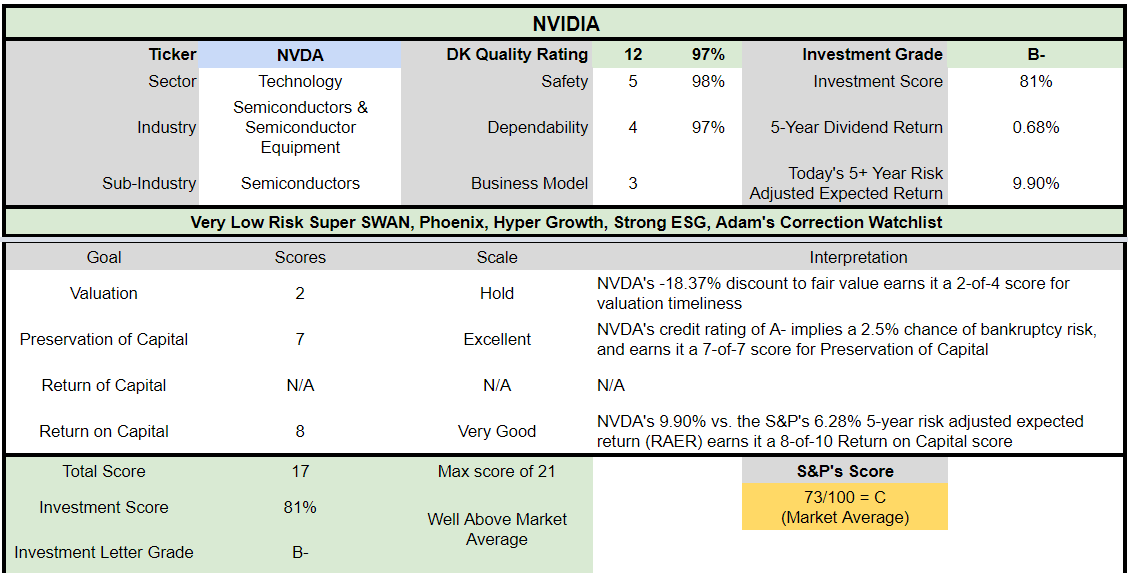
NVDA today, even at an 18% premium, is a superior choice compared to the S&P 500.
- higher risk-adjusted expected return than the S&P over the next five years
- 80% higher long-term annual return potential
Bottom Line: Nvidia Is The Far Better Growth Stock But Qualcomm Is The Far Better Buy Today
When it comes to maximizing safe long-term income, combining hyper-growth with high-yield is the single best strategy.
And that’s why blue-chip income investors love companies like QCOM and NVDA, which can turbocharge their long-term income growth rates.
- SCHD delivered 15% annual income growth over the last decade
- SCHD, QQQ, MO, ENB, QCOM, and NVDA delivered 28% CAGR
- and 50% more overall inflation-adjusted income.
And when it comes to the issue of which chip titan is the better growth stock, it looks like NVDA is the hands down winner.
- a 10X bigger addressable market today (though QCOM is planning to catch up 70% of the way within a decade)
- 2x the median growth consensus
- historically 7% higher annual returns.
So you might think that NVDA is the hands down winner here. But remember that valuation matters, and it matters a lot.
- QCOM is 20% historically undervalued
- NVDA is almost 20% historically overvalued.
Given that NVDA is one of the most volatile companies on earth, capable of rising or falling 60% in a single month, knowingly overpaying for it is just asking for extreme portfolio short-term pain.
If you own NVDA today, as I do? I don’t recommend selling it. Not when you’ve potentially locked in Buffett-like 18% CAGR long-term returns and its growth engines are firing on all cylinders.
But for new money today? QCOM is the far better option, and could more than double in the next five years.
Even if QCOM’s growth outlook never recovers from its current 8%, paying 9.4X cash-adjusted earnings gives you a very nice margin of safety.
One that means anyone buying QCOM today is likely to be pleased in 5+ years, and possibly feel like a stock market genius in 10+ years.
Be the first to comment